Hi @Riveri, Natalia
Based on my test, we cannot add different categories in Forecast sheet settings, it's best to use Power BI or other tools to process the data, get forecast values, and then create a chart or pivot chart with different categories.
But if the number of countries is small, we can combine different forecast charts together.
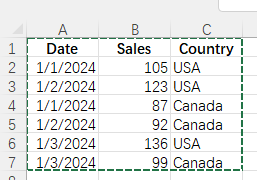
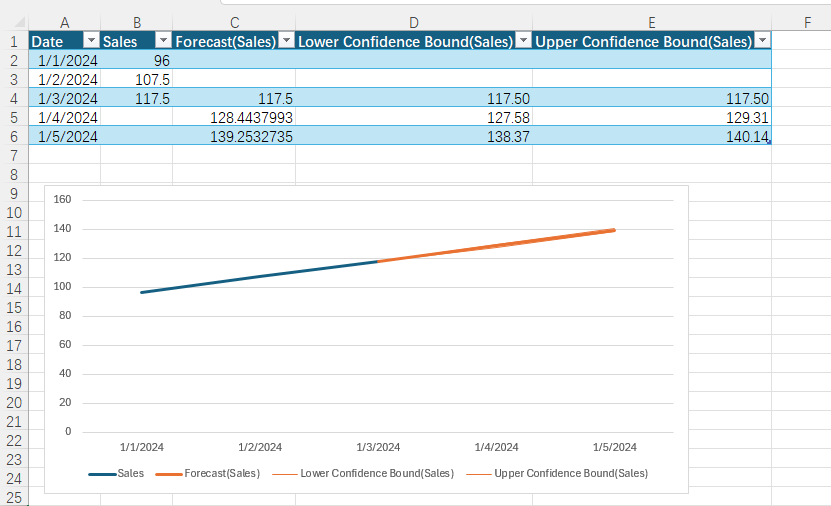
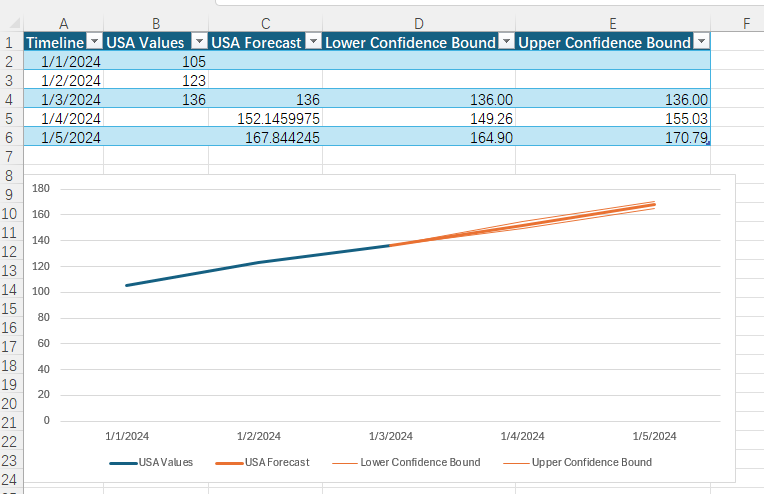
For example, currently I have a range of data and a forecast chart as following, there is only Canada and USA 2 counties.
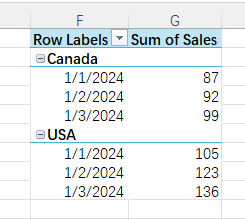
- Then, please create a pivot table for the data, drag the "Country" as the first Rows field, the "Date" as the second one. Drag the "Sales" as the Values field. You may cancel the Subtotals and off the Grand totals in Design tab.
- Select the cells from F3 to G5 and F7 to G9,create forecast charts for different Countries. We can add the country name in the column header names, such as Canada Values, USA Forecast.
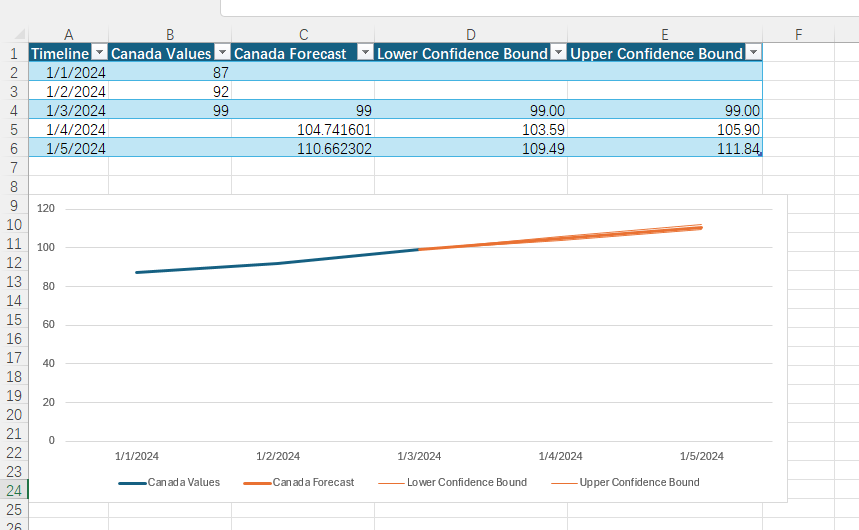
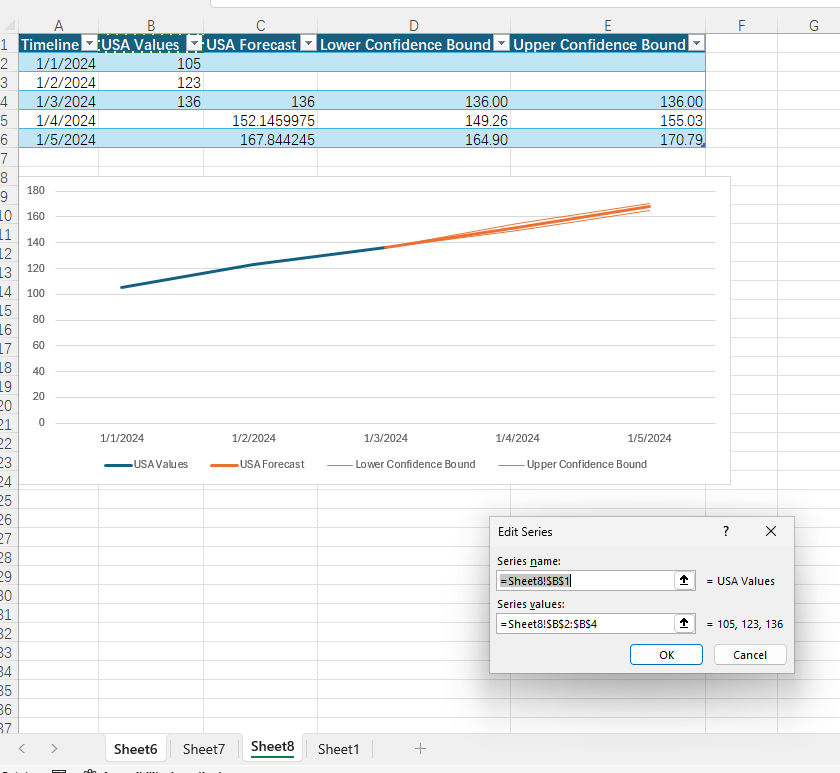
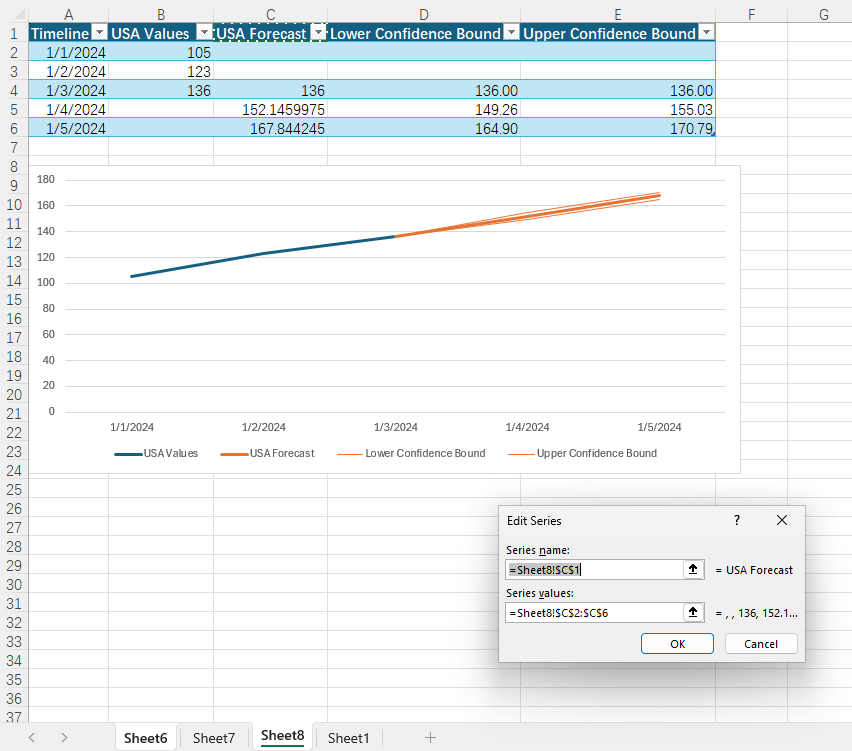
- Let us locate to the first chart, right click it > Select Data > Add (Series) for different countries' values. Take USA as an example, one series, its name is "USA Values", its values are from B2:B4; another series, its name is "USA Forecast", its values are from C2:C6.
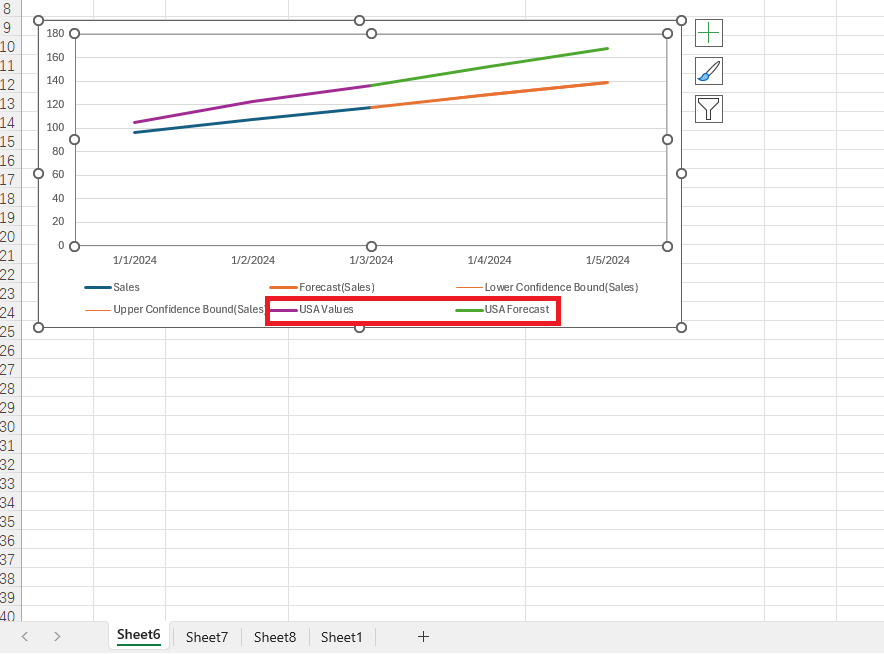
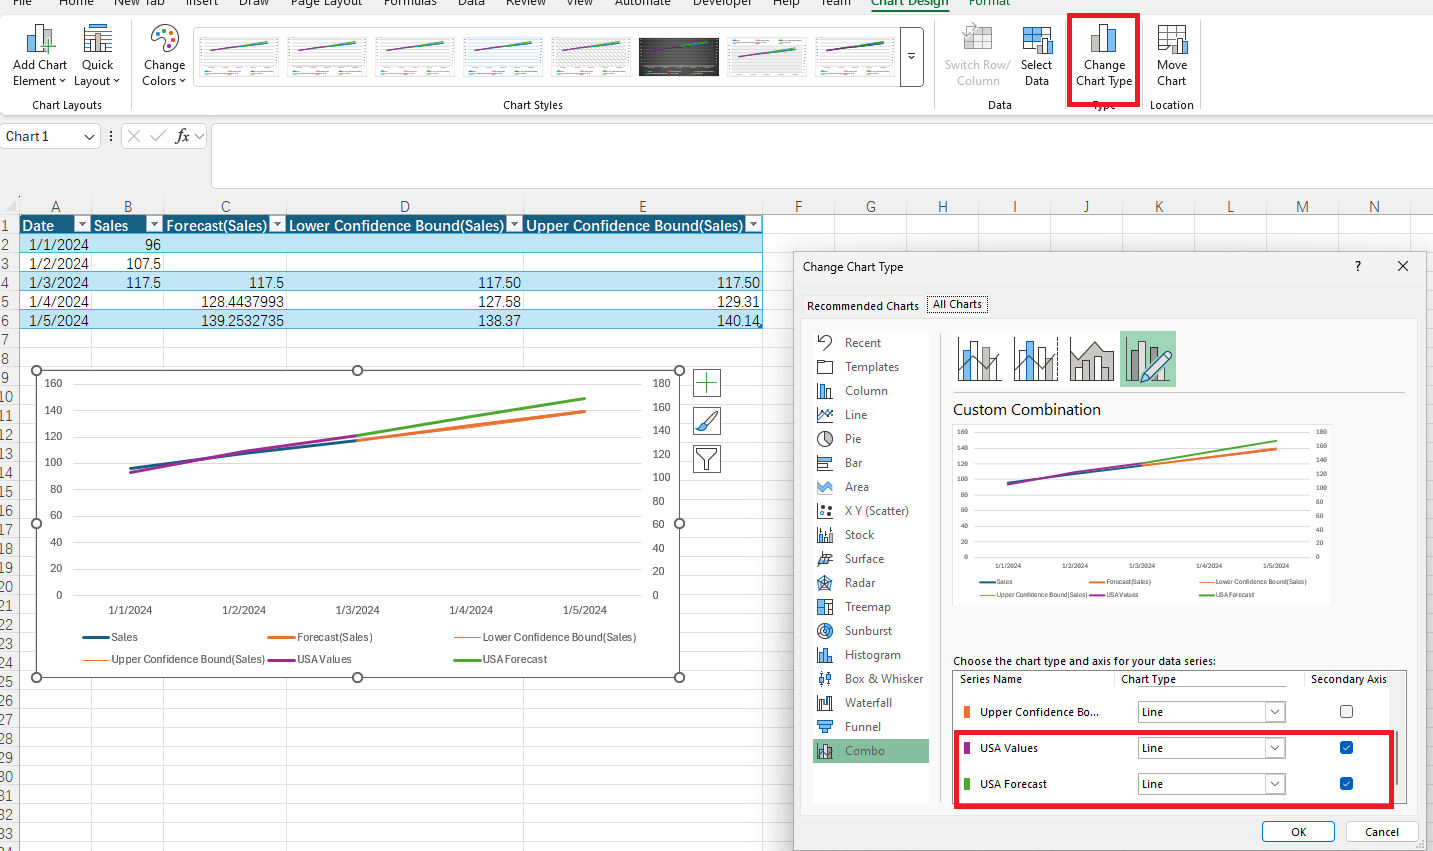
- And then we can find there is a line of USA. We can continue to add other series for other countries. Besides, we can create a second Axis for these country series.
If the answer is helpful, please click "Accept Answer" and kindly upvote it. If you have extra questions about this answer, please click "Comment".
Note: Please follow the steps in our documentation to enable e-mail notifications if you want to receive the related email notification for this thread.
' cx='32' cy='32' r='32' /%3E%3Ctext x='50%25' y='55%25' dominant-baseline='middle' text-anchor='middle' fill='%23FFF' %3ERN%3C/text%3E%3C/svg%3E)

' cx='32' cy='32' r='32' /%3E%3Ctext x='50%25' y='55%25' dominant-baseline='middle' text-anchor='middle' fill='%23FFF' %3EJH%3C/text%3E%3C/svg%3E)