Understand how provisioning integrates with Azure Monitor logs
Provisioning integrates with Azure Monitor logs and Log Analytics. With Azure monitoring you can do things like create workbooks, also known as dashboards, store provisioning logs for 30+ days, and create custom queries and alerts. This article discusses how provisioning logs integrate with Azure Monitor logs. To learn more about how provisioning logs work in general, see provisioning logs.
Enabling provisioning logs integration
If you're not already familiar with Azure Monitor and Log Analytics, explore the following resources and then come back to learn about integrating application provisioning logs with Azure Monitor logs.
- Azure Monitor overview
- Configure a Log Analytics workspace
- Integrate activity logs with Azure Monitor logs
To integrate provisioning logs with Azure Monitor logs:
Sign in to the Microsoft Entra admin center as at least a Security Administrator.
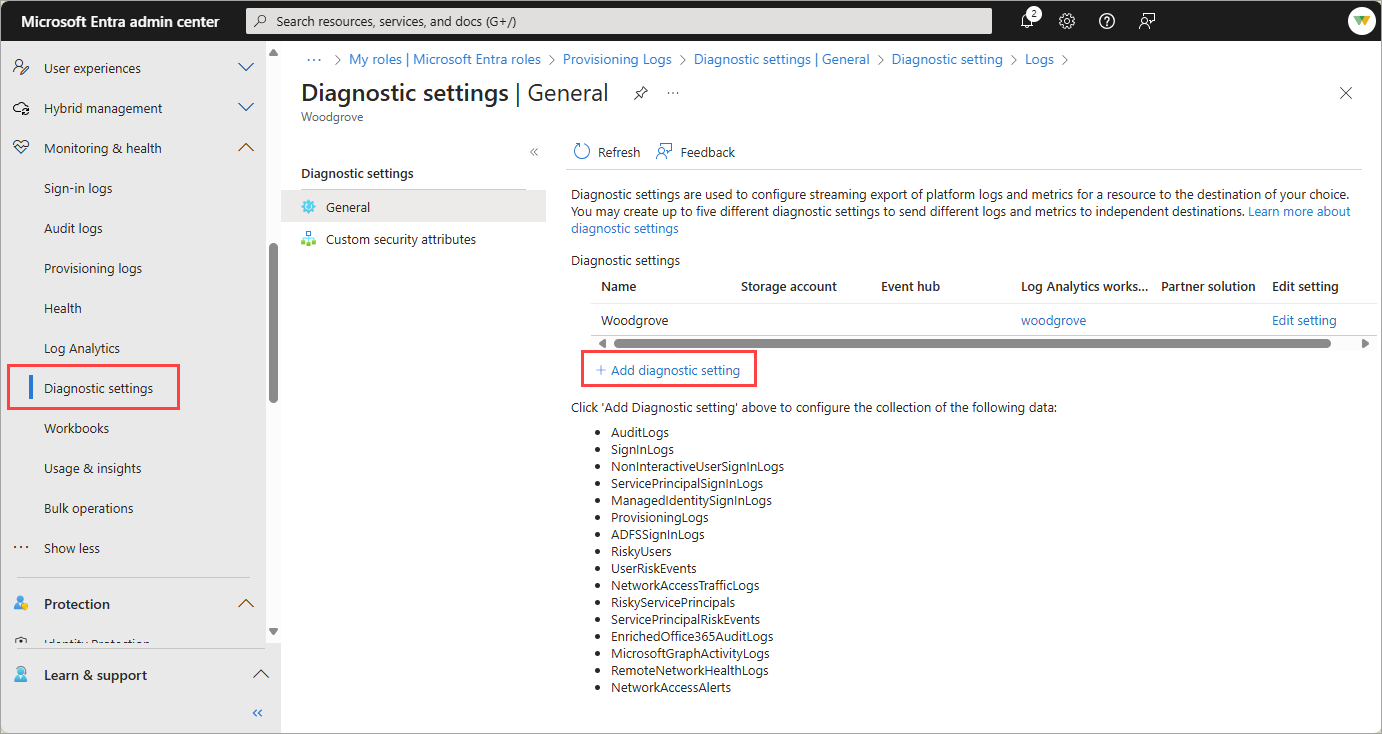
Browse to Identity > Monitoring & health > Diagnostic settings.
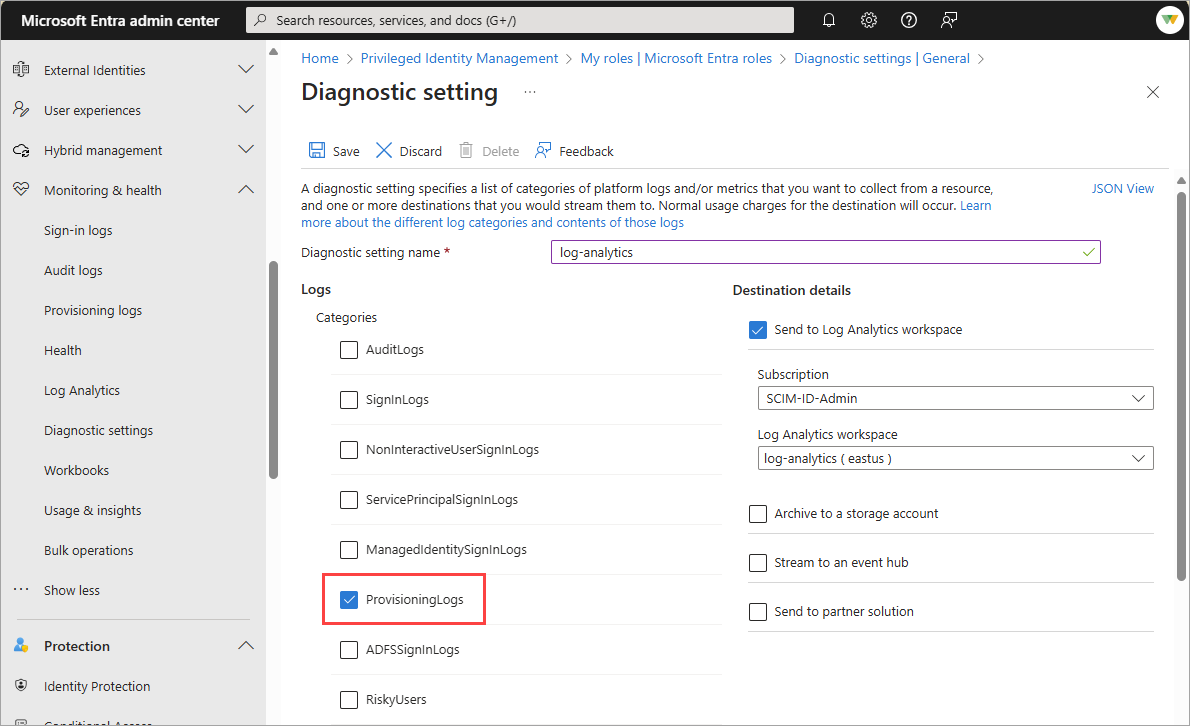
Choose the logs you want to stream, select the Send to Log Analytics workspace option, and complete the fields.
Browse to Identity > Monitoring & health > Log Analytics and begin querying the data.
Note
It can take some time before logs appear in Log Analytics after first enabling the integration. If you receive an error that the subscription is not registered to use microsoft.insights then check back after a few minutes.
Understanding the data
The underlying data stream that Provisioning sends log viewers is almost identical. Azure Monitor logs gets nearly the same stream as the Microsoft Entra admin center and the Microsoft Graph API. There are a few differences in the log fields as outlined in the following table. Log Analytics might display more events than the logs in the Microsoft Entra admin center. To learn more about these fields, see List provisioningObjectSummary.
| Azure Monitor logs | Azure portal UI | Azure API |
|---|---|---|
| errorDescription | reason | resultDescription |
| status | resultType | resultType |
| activityDateTime | TimeGenerated | TimeGenerated |
Microsoft Entra workbooks
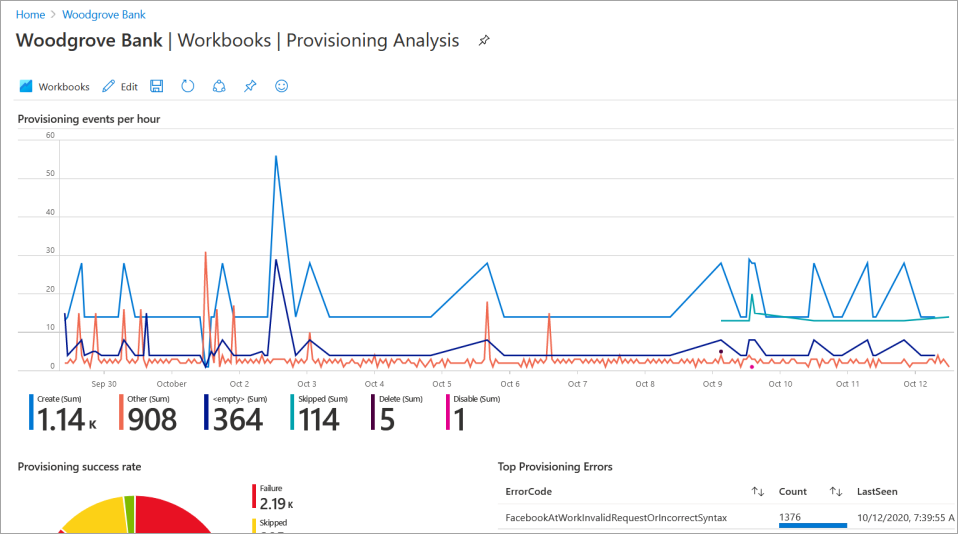
Microsoft Entra identity workbooks provide a flexible canvas for data analysis. They also provide for the creation of rich visual reports within the Azure portal. To learn more, see Microsoft Entra workbooks.
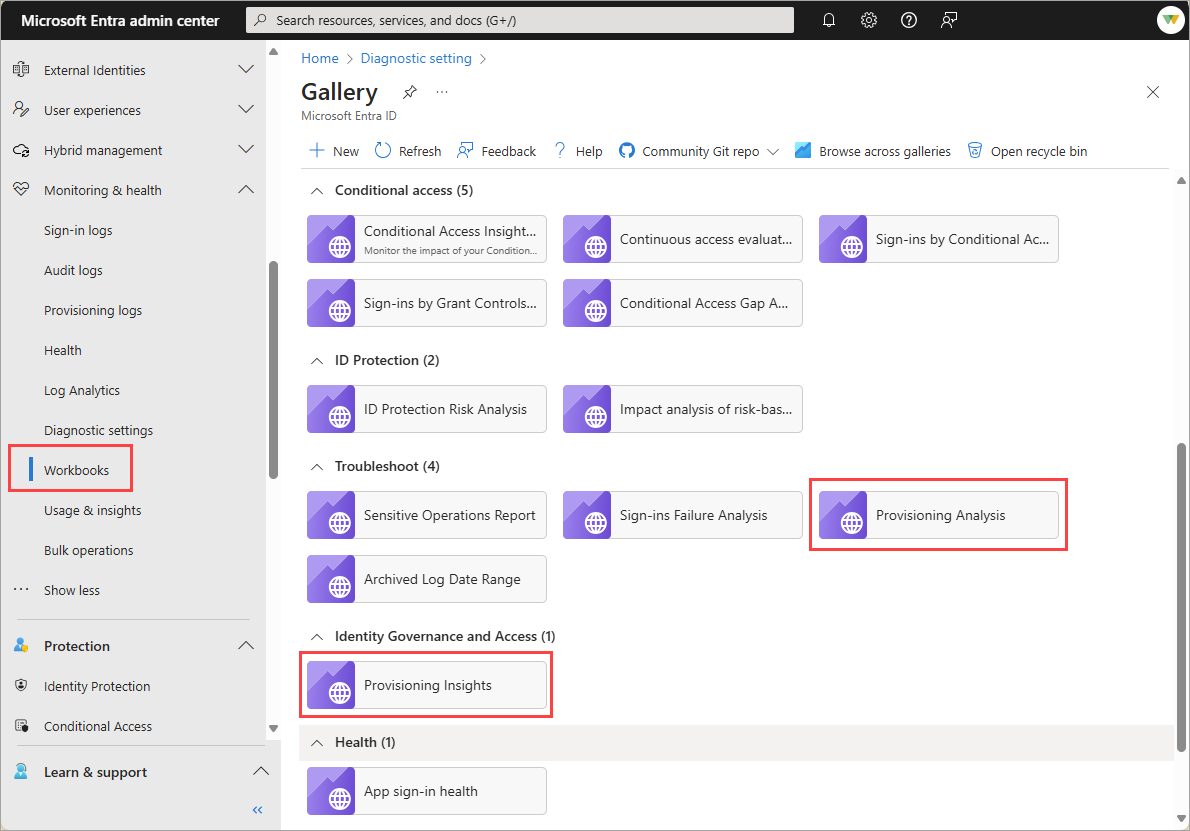
The Provisioning Analysis and Provisioning Insights are two of the prebuilt workbooks available. To view the data, ensure that all the filters (timeRange, jobID, appName) are populated. Also confirm the app was provisioned, otherwise there isn't any data in the logs.
Custom queries
You can create custom queries and show the data in your workbooks. To learn how, see Get started with log queries in Azure Monitor and Log queries in Azure Monitor.
Here are some samples to get started with application provisioning log queries.
Query the logs for a user a based on their ID in the source system:
AADProvisioningLogs
| extend SourceIdentity = parse_json(SourceIdentity)
| where tostring(SourceIdentity.Id) == "49a4974bb-5011-415d-b9b8-78caa7024f9a"
Summarize count per ErrorCode:
AADProvisioningLogs
| summarize count() by ErrorCode = ResultSignature
Summarize count of events per day by action:
AADProvisioningLogs
| where TimeGenerated > ago(7d)
| summarize count() by Action, bin(TimeGenerated, 1d)
Take 100 events and project key properties:
AADProvisioningLogs
| extend SourceIdentity = parse_json(SourceIdentity)
| extend TargetIdentity = parse_json(TargetIdentity)
| extend ServicePrincipal = parse_json(ServicePrincipal)
| where tostring(SourceIdentity.identityType) == "Group"
| project tostring(ServicePrincipal.Id), tostring(ServicePrincipal.Name), ModifiedProperties, JobId, Id, CycleId, ChangeId, Action, SourceIdentity.identityType, SourceIdentity.details, TargetIdentity.identityType, TargetIdentity.details, ProvisioningSteps
| take 100
Retrieve groups with skipped members due to problems resolving references.
AADProvisioningLogs
| where TimeGenerated >= ago(10d)
| where JobId == "Azure2Azure.73f0883f-d67d-4af1-ac8a-45367f8982e0.5ef3be57-f45f-451g-88c4-68a7fda680bb" // Customize by adding a specific app JobId
| extend SourceIdentity = parse_json(SourceIdentity)
| extend ProvisioningSteps = parse_json(ProvisioningSteps)
| where tostring(SourceIdentity.identityType) == "Group"
| where ProvisioningSteps matches regex "UnableToResolveReferenceAttributeValue"
| parse tostring(ProvisioningSteps.[2].description) with "We were unable to assign " userObjectId " as the members of " groupDisplayName "." *
| project groupDisplayName, userObjectId,  JobId
| take 100
Summarize actions by application.
AADProvisioningLogs
| where TimeGenerated > ago(30d)
| where JobId == "Azure2Azure.73f0883f-d67d-4af1-ac8a-45367f8982e0.5ef3be57-f45f-451g-88c4-68a7fda680bb" // Customize by adding a specific app JobId
| extend ProvisioningSteps = parse_json(ProvisioningSteps)
| extend eventName = tostring(ProvisioningSteps.[-1].name)
| summarize count() by eventName, JobId
| order by JobId asc
| take 5
Identify spikes in specific operations.
AADProvisioningLogs
| where TimeGenerated > ago(30d)
| where JobId == "scim.73f0883f-d67d-4af1-ac8a-45367f8982e0.5ef3be57-f45f-451g-88c4-68a7fda680bb" // Customize by adding a specific app JobId
| extend ProvisioningSteps = parse_json(ProvisioningSteps)
| extend eventName = tostring(ProvisioningSteps.[-1].name)
| summarize count() by eventName, bin(TimeGenerated, 1d)
| render timechart
Custom alerts
Azure Monitor lets you configure custom alerts so that you can get notified about key events related to Provisioning. For example, you might want to receive an alert on spikes in failures spikes in disables or deletes. You might also want to be alerted if there's a lack of any provisioning, which indicates something is wrong.
To learn more about alerts, see Azure Monitor Log Alerts. There are many options and configurations, so review the full documentation. But at a high-level, here's how you can create an alert:
- From Log Analytics, select + New alert rule.
- On the Condition tab, select the View result and edit query in Logs link.
- Enter a query you want to alert on, and complete the necessary fields to create the alert.
To create an alert when there's a spike in failures:
AADProvisioningLogs
| where JobId == "string" // Customize by adding a specific app JobId
| where ResultType == "Failure"
There might be an issue that caused the provisioning service to stop running. Use the following query to detect when there are no provisioning events during a given time interval.
AADProvisioningLogs
| take 1
To create an alert when there's a spike in disables or deletes:
AADProvisioningLogs
| where Action in ("Disable", "Delete")
Community contributions
We're taking an open source and community-based approach to application provisioning queries and dashboards. Build a query, alert, or workbook that you think is useful to others, then publish it to the AzureMonitorCommunity GitHub repo. Shoot us an email with a link. We review and publish queries and dashboards to the service so others benefit too. Contact us at provisioningfeedback@microsoft.com.


