Work with Microsoft Sentinel threat intelligence
Accelerate threat detection and remediation with streamlined creation and management of threat intelligence. This article demonstrates how to make the most of threat intelligence integration in the management interface, whether you're accessing it from Microsoft Sentinel in the Azure portal or the Defender portal.
- Create threat intelligence objects using structured threat information expression (STIX)
- Manage threat intelligence by viewing, curating, and visualizing
Important
Microsoft Sentinel is generally available within Microsoft's unified security operations platform in the Microsoft Defender portal. For preview, Microsoft Sentinel is available in the Defender portal without Microsoft Defender XDR or an E5 license. For more information, see Microsoft Sentinel in the Microsoft Defender portal.
Access the management interface
Reference one of the following tabs, depending on where you want to work with threat intelligence. Even though the management interface is accessed differently depending which portal you use, the creation and management tasks have the same steps once you get there.
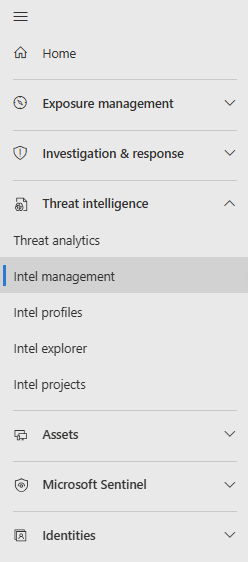
In the Defender portal, navigate to Threat intelligence > Intel management.
Create threat intelligence
Use the management interface to create STIX objects and perform other common threat intelligence tasks such as indicator tagging and establishing connections between objects.
- Define relationships as you create new STIX objects.
- Quickly create multiple objects by using the duplicate feature to copy the metadata from a new or existing TI object.
For more information on supported STIX objects, see Threat intelligence in Microsoft Sentinel.
Create a new STIX object
Select Add new > TI object.
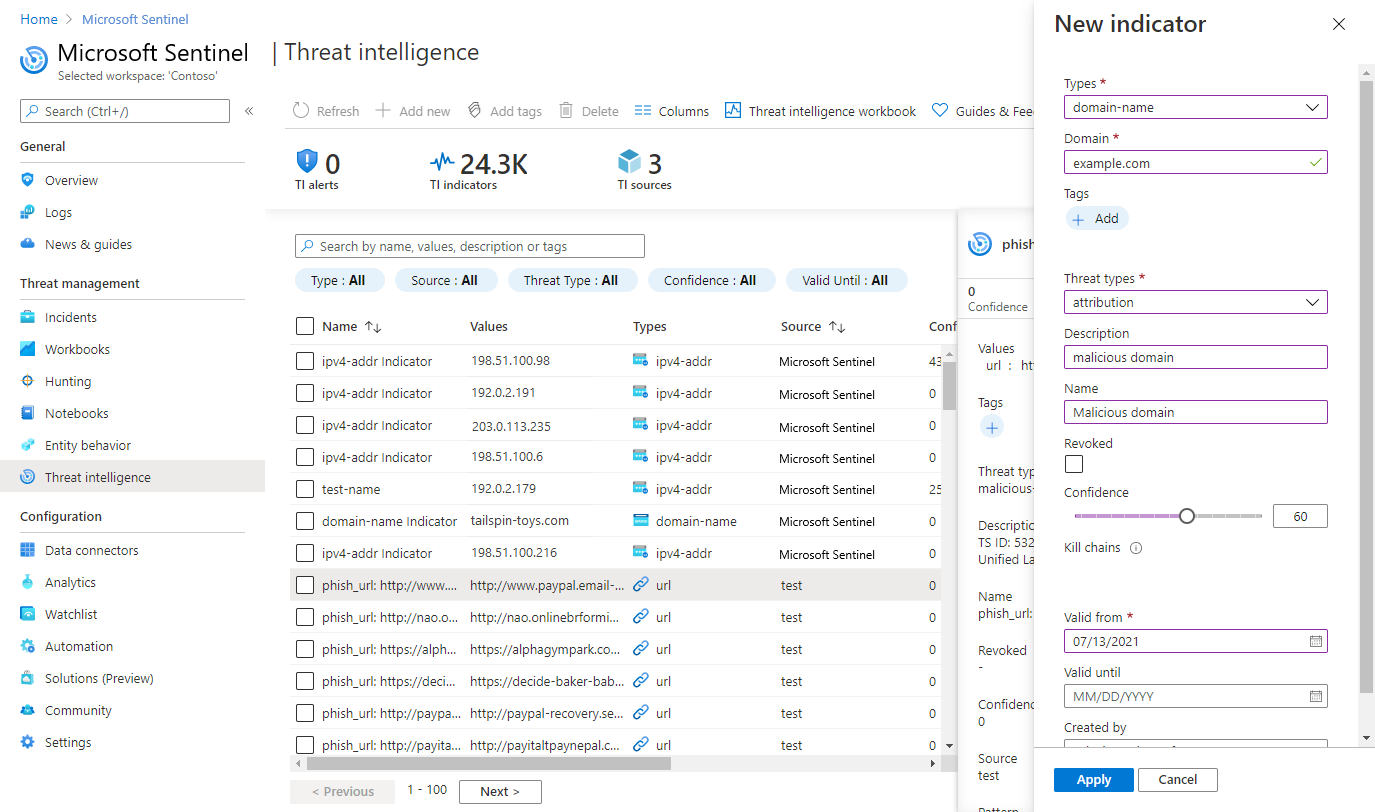
Choose the Object type, then fill in the form on the New TI object page. Required fields are marked with a red asterisk (*).
Consider designating a sensitivity value, or Traffic light protocol (TLP) rating to the TI object. For more information on what the values represent, see Curate threat intelligence.
If you know how this object relates to another threat intelligence object, indicate that connection with the Relationship type and the Target reference.
Select Add for an individual object, or Add and duplicate if you want to create more items with the same metadata. The following image shows the common section of each STIX object's metadata that is duplicated.

Manage threat intelligence
Optimize TI from your sources with ingestion rules. Curate existing TI with the relationship builder. Use the management interface to search, filter and sort, then add tags to your threat intelligence.
Optimize threat intelligence feeds with ingestion rules
Reduce noise from your TI feeds, extend the validity of high value indicators, and add meaningful tags to incoming objects. These are just some of the use cases for ingestion rules. Here are the steps for extending the validity date on high value indicators.
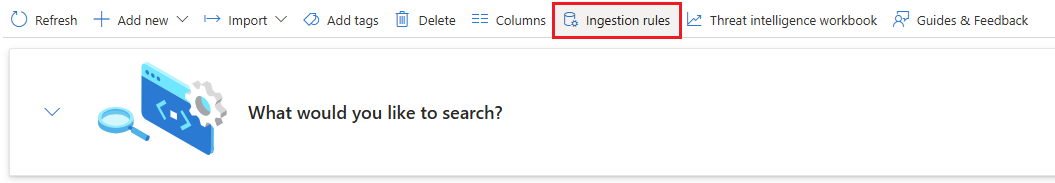
Select Ingestion rules to open a whole new page to view existing rules and construct new rule logic.
Enter a descriptive name for your rule. The ingestion rules page has ample rule for the name, but it's the only text description available to differentiate your rules without editing them.
Select the Object type. This use case is based on extending the
Valid fromproperty which is only available forIndicatorobject types.Add condition for
SourceEqualsand select your high valueSource.Add condition for
ConfidenceGreater than or equaland enter aConfidencescore.Select the Action. Since we want to modify this indicator, select
Edit.Select the Add action for
Valid until,Extend by, and select a time span in days.Consider adding a tag to indicate the high value placed on these indicators, like
Extended. The modified date is not updated by ingestion rules.Select the Order you want the rule to run. Rules run from lowest order number to highest. Each rule evaluates every object ingested.
If the rule is ready to be enabled, toggle Status to on.
Select Add to create the ingestion rule.
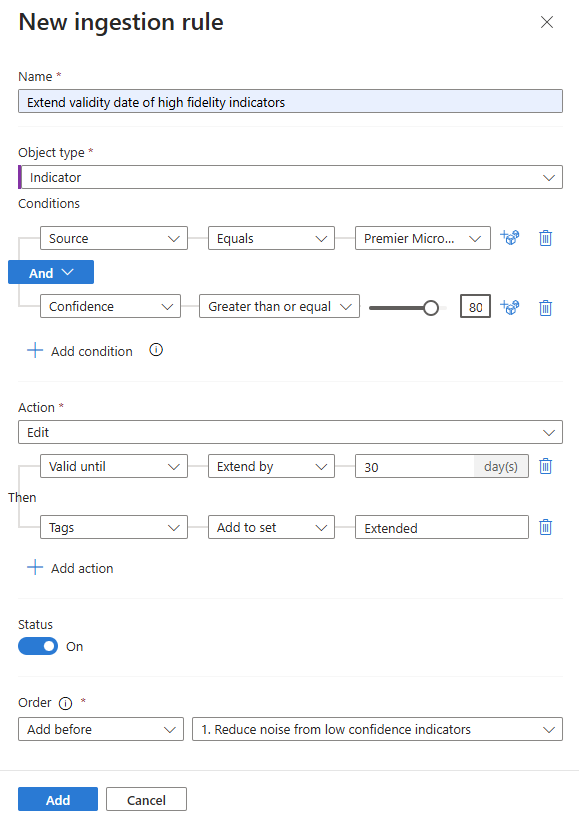
For more information, see Threat intelligence ingestion rules.
Curate threat intelligence with the relationship builder
Connect threat intelligence objects with the relationship builder. There's a maximum of 20 relationships in the builder at once, but more connections can be created through multiple iterations and by adding relationship target references for new objects.
Select Add new > TI relationship.
Start with an existing TI object like a threat actor or attack pattern where the single object connects to one or more existing objects, like indicators.
Add the relationship type according to the best practices outlined in the following table and in the STIX 2.1 reference relationship summary table:
Relationship type Description Duplicate of
Derived from
Related toCommon relationships defined for any STIX domain object (SDO)
For more information, see STIX 2.1 reference on common relationshipsTargets Attack patternorThreat actorTargetsIdentityUses Threat actorUsesAttack patternAttributed to Threat actorAttributed toIdentityIndicates IndicatorIndicatesAttack patternorThreat actorImpersonates Threat actorImpersonatesIdentityUse the following image as an example in how to use the relationship builder. This example demonstrates how to make connections made between a threat actor and an attack pattern, indicator, and identity using the relationship builder in the Defender portal.
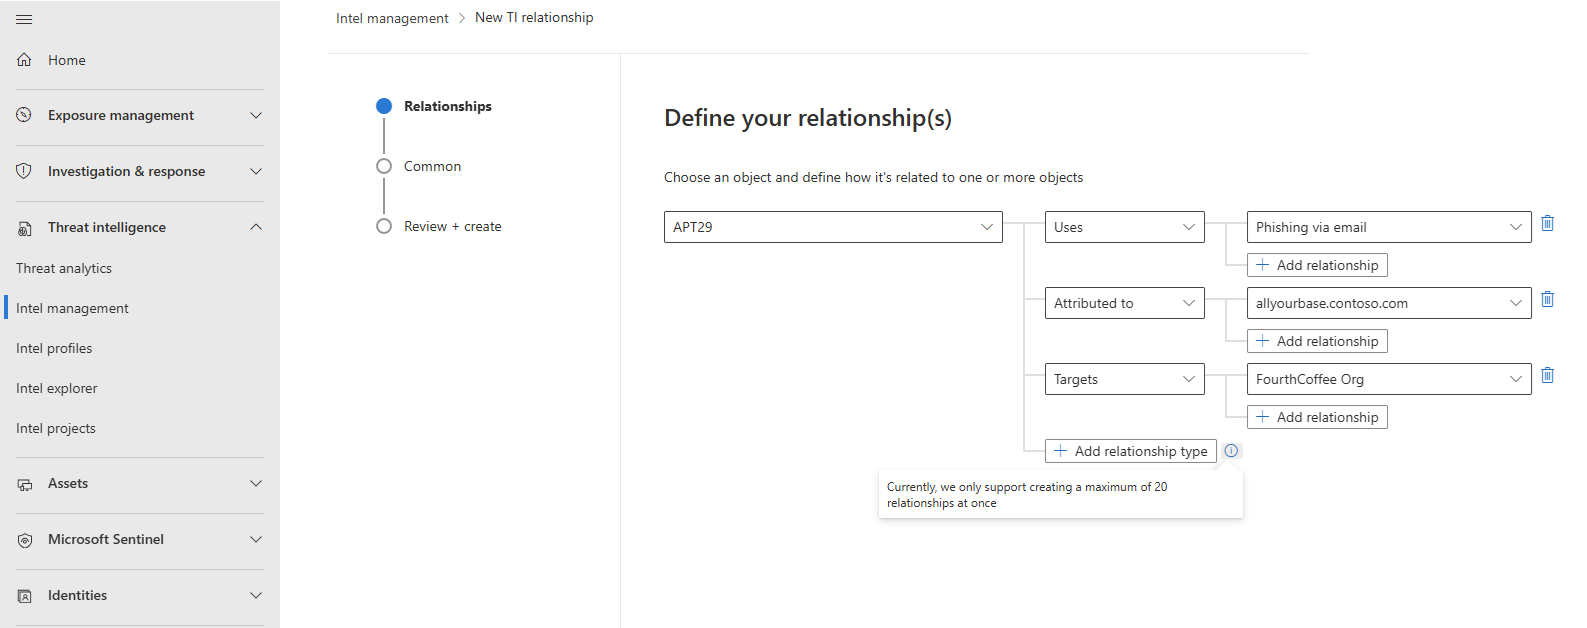
Complete the relationship by configuring Common properties.

View your threat intelligence in the management interface
Use the management interface to sort, filter, and search your threat intelligence from whatever source they were ingested from without writing a Log Analytics query.
From the management interface, expand the What would you like to search? menu.
Select a STIX object type or leave the default All object types.
Select conditions using logical operators.
Select the object you want to see more information about.
In the following image, multiple sources were used to search by placing them in an OR group, while multiple conditions were grouped with the AND operator.

Microsoft Sentinel only displays the most current version of your threat intel in this view. For more information on how objects are updated, see Threat intelligence life cycle.
IP and domain name indicators are enriched with extra GeoLocation and WhoIs data so you can provide more context for any investigations where indicator is found.
Here's an example.

Important
GeoLocation and WhoIs enrichment is currently in preview. The Azure Preview Supplemental Terms include more legal terms that apply to Azure features that are in beta, preview, or otherwise not yet released into general availability.
Tag and edit threat intelligence
Tagging threat intelligence is a quick way to group objects together to make them easier to find. Typically, you might apply tags related to a particular incident. But, if an object represents threats from a particular known actor or well-known attack campaign, consider creating a relationship instead of a tag.
- Use the management interface to sort, filter, and search for your threat intelligence.
- After you find the objects you want to work with, multiselect them choosing one or more objects of the same type.
- Select Add tags and tag them all at once with one or more tags.
- Because tagging is free-form, we recommend that you create standard naming conventions for tags in your organization.
Edit threat intelligence one object at a time, whether created directly in Microsoft Sentinel or from partner sources, like TIP and TAXII servers. For threat intel created in the management interface, all fields are editable. For threat intel ingested from partner sources, only specific fields are editable, including tags, Expiration date, Confidence, and Revoked. Either way, only the latest version of the object appears in the management interface.
For more information on how threat intel is updated, see View your threat intelligence.
Find and view threat intelligence with queries
This procedure describes how to view your threat intelligence with queries, regardless of the source feed or method you used to ingest them.
Threat indicators are stored in the Microsoft Sentinel ThreatIntelligenceIndicator table. This table is the basis for threat intelligence queries performed by other Microsoft Sentinel features, such as Analytics, Hunting, and Workbooks.
Important
Tables supporting the new STIX object schema aren't available publicly. In order to view the STIX objects in queries and unlock the hunting model that uses them, request to opt in with this form. Ingest your threat intelligence into the new tables, ThreatIntelIndicator and ThreatIntelObjects, alongside or instead of the current table, ThreatIntelligenceIndicator, with this opt-in process.
For Microsoft Sentinel in the Defender portal, select Investigation & response > Hunting > Advanced hunting.
The
ThreatIntelligenceIndicatortable is located under the Microsoft Sentinel group.


For more information, see View your threat intelligence.
Visualize your threat intelligence with workbooks
Use a purpose-built Microsoft Sentinel workbook to visualize key information about your threat intelligence in Microsoft Sentinel, and customize the workbook according to your business needs.
Here's how to find the threat intelligence workbook provided in Microsoft Sentinel, and an example of how to make edits to the workbook to customize it.
From the Azure portal, go to Microsoft Sentinel.
Choose the workspace to which you imported threat indicators by using either threat intelligence data connector.
Under the Threat management section of the Microsoft Sentinel menu, select Workbooks.
Find the workbook titled Threat Intelligence. Verify that you have data in the
ThreatIntelligenceIndicatortable.
Select Save, and choose an Azure location in which to store the workbook. This step is required if you intend to modify the workbook in any way and save your changes.
Now select View saved workbook to open the workbook for viewing and editing.
You should now see the default charts provided by the template. To modify a chart, select Edit at the top of the page to start the editing mode for the workbook.
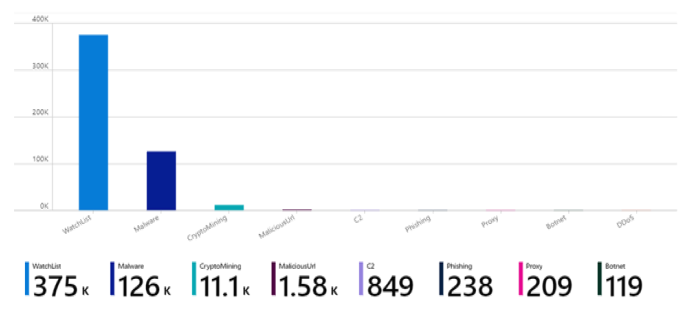
Add a new chart of threat indicators by threat type. Scroll to the bottom of the page and select Add Query.
Add the following text to the Log Analytics workspace Log Query text box:
ThreatIntelligenceIndicator
| summarize count() by ThreatType
See more information on the following items used in the preceding example, in the Kusto documentation:
On the Visualization dropdown menu, select Bar chart.
Select Done editing, and view the new chart for your workbook.
Workbooks provide powerful interactive dashboards that give you insights into all aspects of Microsoft Sentinel. You can do many tasks with workbooks, and the provided templates are a great starting point. Customize the templates or create new dashboards by combining many data sources so that you can visualize your data in unique ways.
Microsoft Sentinel workbooks are based on Azure Monitor workbooks, so extensive documentation and many more templates are available. For more information, see Create interactive reports with Azure Monitor workbooks.
There's also a rich resource for Azure Monitor workbooks on GitHub, where you can download more templates and contribute your own templates.
Related content
For more information, see the following articles:
- Threat intelligence in Microsoft Sentinel.
- Connect Microsoft Sentinel to STIX/TAXII threat intelligence feeds.
- See which TIPs, TAXII feeds, and enrichments can be readily integrated with Microsoft Sentinel.
For more information on KQL, see Kusto Query Language (KQL) overview.
Other resources: