ASP.NET Tips: Finding what is taking up memory
There are some times that you want to figure out what is taking up your memory. There are a few ways that you can do this and some limitations put on this by .NET and ASP.NET.
Memory in a dump file
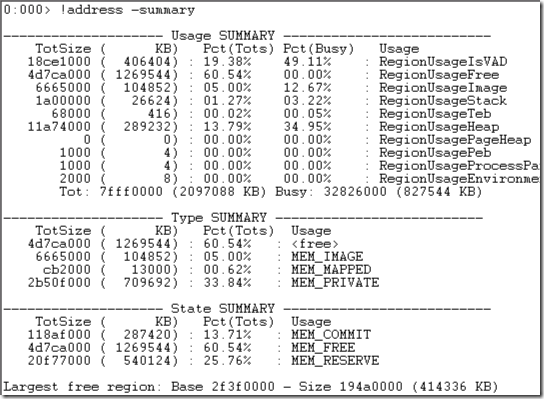
If you are looking at a dump file, the first thing you can do is find out how much memory is being taking up by the NT Heaps, Virtual Allocations, Images (EXE and DLL), this is done by using the command: !address –summary:
Here you can see the amount of data that each of these types holds on to. Another really useful output from this command is being able to see what the largest free region we have in the process. This is shown at the very bottom of this output. If that number is less then the size of a new memory allocation, we will fail with an Out Of Memory error.
Once you have this data, you can start digging deeper on some of these things. For example, you can run lm to see all the loaded modules in the process. Most of the time you will want to dig into the virtual allocations (RegionUsageIsVAD). This is where .NET allocates it’s heaps. Running !eeheap -gc will show the GC Heap Size so that we can see if all our virtual memory is .NET or something else.
Note: In a dump file, we cannot figure out the sizes of all individual pages. This is because these objects hold a reference to their parent object and we will end up getting the size of all the pages, not just the one. If you need that type of details, see the profilers below.
Memory in a live process
To look at memory in a live process, there are a number of different tools you can use depending on the situation. The most versatile and most common one to use is perfmon. There are again a few places to focus depending on the situation. You can look under the Process object and add the Private Bytes and Virtual Bytes to get a good overview of all memory. If you want to look at .NET, focus in the .NET CLR Memory object. You can use the # Total committed Bytes and # Total reserved Bytes to see how much memory is being used.
Other tools you can use to look at memory from a .NET perspective are:
- https://www.memprofiler.com/
- Visual Studio
- Download details- CLR Profiler for the .NET Framework 2.0
- Tools & Utilities on MSDN
You can find a bunch more profilers here.
Comments
Anonymous
June 25, 2008
PingBack from http://blog.a-foton.ru/2008/06/aspnet-tips-finding-what-is-taking-up-memory/Anonymous
June 25, 2008
You've been kicked (a good thing) - Trackback from DotNetKicks.comAnonymous
June 26, 2008
I tried to use !address -summary in the command prompt but it says it's not recognized. Is this the correct place to issue this command?Anonymous
June 26, 2008
John, That is a command that you run inside the debugger. Sorry for the confusion. Take a look at some of my earlier posts to see where to get the debugger package, like: http://blogs.msdn.com/tom/archive/2008/02/25/howto-capture-a-dump-on-a-specific-managed-exception.aspx look for the debugger package link
