Chart only plots one data point after installing MS11-072
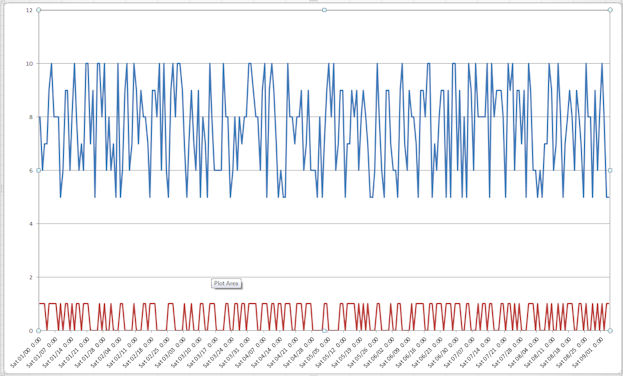
In addition to the two other side effects to installing MS11-072 (https://support.microsoft.com/kb/2553091) , as mentioned in the previous blog, there is yet another issue - this time with charts. Mind you this problem doesn't happen with all charts, but with some charts you will see the horizontal axis is no longer being plotted as separate data points. Before the update your chart may look normal:
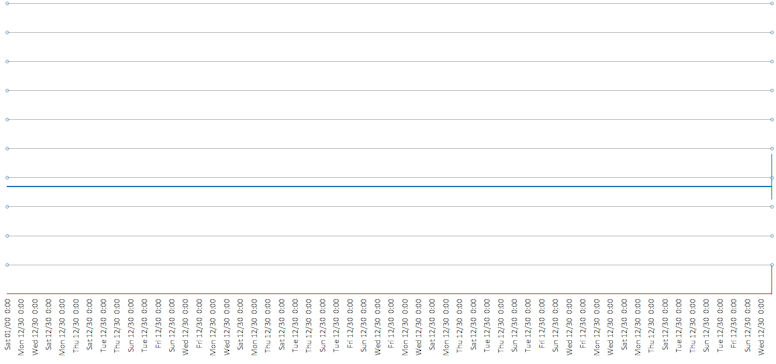
But after the update your chart may suddenly look similar to the following:
There is a workaround for this problem, though not a permanent solution as yet. To work around the problem, right click the horizontal axis and click 'Format Axis'. In the dialog box that comes up you will want to set the 'Axis type' from 'Automatically select based on data' to 'Text Axis'. This will force the chart to render correctly.


