Troubleshooting Applications using Windows Server AppFabric
In our previous post, we discussed the topic of Monitoring Applications using Windows Server AppFabric. In this post, we will show how to use the same tools in more advanced ways to troubleshoot problems in your applications.
Introduction
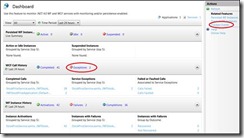
The previous post introduced the AppFabric Dashboard (pictured below). As you can see, it does a good job of giving you a quick view of the state of your WCF and WF services while highlighting potential problems. The AppFabric Dashboard is the starting point for many paths that you can take while troubleshooting. We’ll explore a few of the more common paths to get you familiar with the toolset.
Tracked Events
Most troubleshooting scenarios will require users to examine event data that was captured from the problematic service at the time the problem manifested itself. The dashboard provides several ways to drill down into the relevant event data quickly.
How to Drilldown
AppFabric provides a Tracked Events View that displays event data within IIS manager. This view lets users customize the query that is sent to the monitoring database using common filters. From the dashboard, you can use the Tracked Events Action to see the latest events that have been tracked, and then customize your query. Alternatively, you can click on any of the metrics displayed in the WCF Call History and WF Instance History sections, and a pre-created query will be used to save you time. For example, you could click the Exceptions metric and the resulting query would just show event data that contains exception information.
Using the Main Event List Pane
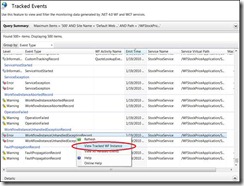
The main pane within the Tracked Events View displays a table of events that match the current query. The sortable columns in the table provide a high level summary of what the events mean. You can also right click rows in the table to get a context menu that provides useful tasks such as relating an event to a tracked Workflow instance. This is useful when you want to get events from an operation that spanned multiple services, maybe even different machines, as long as they are sharing the same monitoring database.
Using the Details Pane
When an event is selected in the main pane, the Details Pane at the bottom of the view displays information that was captured with the selected event. This includes custom event properties, environment information, tracked variables (for Workflow Services), and Error details (if applicable).
Using the Query Summary
As mentioned earlier, the query that is used to retrieve event data from the monitoring database can be customized. You would do this using the Query Summary control at the top of the Tracked Events View. Using this control, you can filter by several common criteria such as Emit Time, Event Type, End To End Activity Id, and Tracked Variables (Workflow only).
Monitoring Configuration
AppFabric provides a default monitoring configuration that is sufficient for common health monitoring and basic troubleshooting tasks. Sometimes, a more granular level of event data is required to troubleshoot a problem. AppFabric provides a UI tool that lets you modify the monitoring configuration that is stored in web.config files.
Changing the Monitoring Level
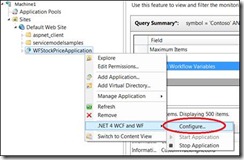
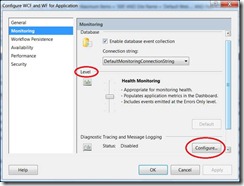
From any scope in the IIS hierarchy (Server, Web Site, Application), select the Configure action from within the .NET 4 WCF and WF Action section and then select the Monitoring tab. You can then choose from one of the 5 predefined monitoring levels.
· Off * – No event data is collected
Use this level if you don’t want to pay any overhead for collection event data
· Errors Only * – Only warning and error information is collected
Use this level if you’re not interested in calculating health monitoring metrics, you want optimal performance, but you still want visibility into errors
· Health Monitoring (default) – Collects all information from “Errors Only” as well as lightweight event data that allows the Dashboard’s metrics to be populated.
Use this level if you want a balance between event collection overhead and visibility into the state of your services
· End To End Monitoring – Collects all information from “Health Monitoring” as well as additional events that allow the construction of message flows across distributed service calls.
Use this level if you need to reconstruct the flow of your service(s)’ execution, either for one service or across services.
· Troubleshooting – Collects all available event data, excluding tracked Workflow variables and arguments. Note that to collect this application specific data a custom tracking profile must be used.
Use this level if you need the most detailed information that is available. This is useful when troubleshooting problems that are not immediately obvious.
* NOTE: at OFF and Error levels dashboard metrics will not be fully functional
Configuring Sytem.Diagnostics Tracing and Message Logging
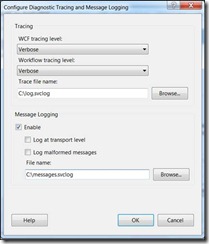
While the tools described above will help you troubleshoot the more common problems, more advanced will warrant more invasive techniques. More detailed log files may be required to diagnose a problem. In this case, a user might want to enable System.Diagnostics Tracing and Message Logging via their configuration files. AppFabric provides a tool that lets you enable and configure these capabilities from within IIS Manager. While on the monitoring tab in the Configure WCF and WF dialog, note the Diagnostic Tracing and Message Logging section. Click Configure. The dialog that appears makes it very easy to configure the level of tracing/message logging, as well as the destination file location(s).
Summary and Additional Resources
In this post, you learned about some of the troubleshooting capabilities built into AppFabric’s IIS Manager Tools. Look for future posts to go into more advanced administration topics that let you use PowerShell and other tools to manage your AppFabric environment.
