Feeling Blue
If you have used Windows for a few years, you have likely encountered a Blue Screen of Death. Fortunately, as reliability has increased with each new release of Windows, BSODs have become progressively less common. What causes these Blue Screens? Primarily, bad drivers or bad hardware. You can rule out defective memory as a cause by running the Windows Memory Diagnostic utility, but how can you find the root cause if you have a buggy driver?
Unfortunately, a message such as DRIVER_IRQL_NOT_LESS_OR_EQUAL does not give you a lot to go on as an end user. What does that mean? How do you fix it?
You could debug the crash dump yourself... Just install the (free) Debugging Tools for Windows, read about crash dump analysis on MSDN, pick up a copy of Windows Internals by Mark Russinovich and David Solomon, and go to town.
As you can see by reading some of the posts on the NT Debugging Blog (https://blogs.msdn.com/ntdebugging/default.aspx), it is not for the faint of heart. My momma didn't raise no fools, but Crash Debugging is WAAAAAAAAY over my head.
If only there was an easier way... Some sort of wizard that automatically ran the necessary debugging commands, downloaded the necessary symbols, and let you see the results of the analysis with as little (or as much) detail as you wanted.
Enter... the Crash Analyzer Wizard which ships as part of the Diagnostic and Recovery Toolset (DaRT) (30-day trial here), available to Volume Licensing customers with Software Assurance. It completely automates the process of analyzing your crash dump and letting you know what driver caused the crash.
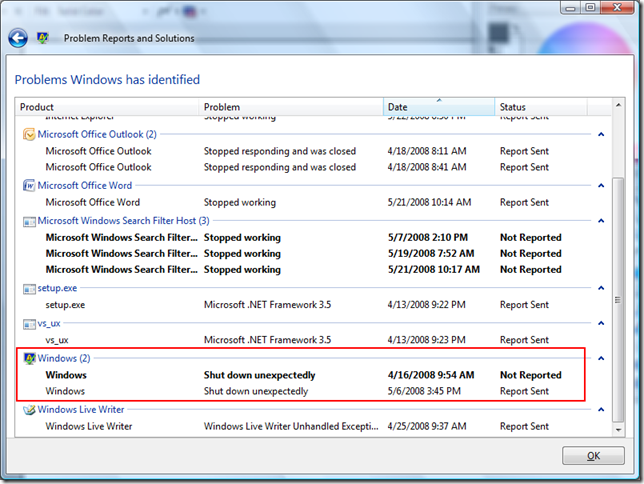
As you can see below, Windows shut down unexpectedly for me last month.
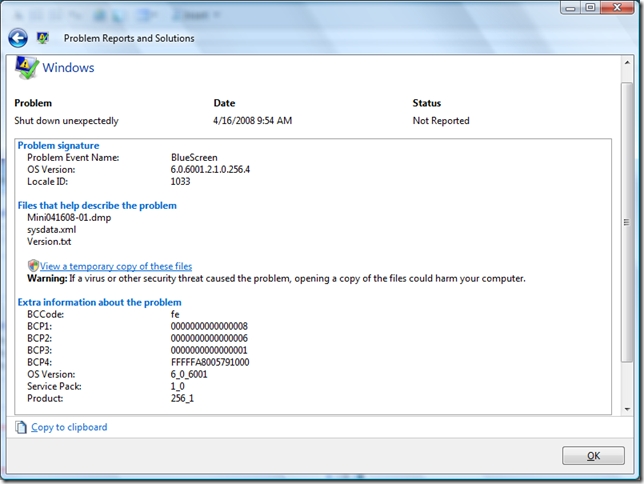
Looking at the details of the crash, there is not much actionable information for me as an end-user.
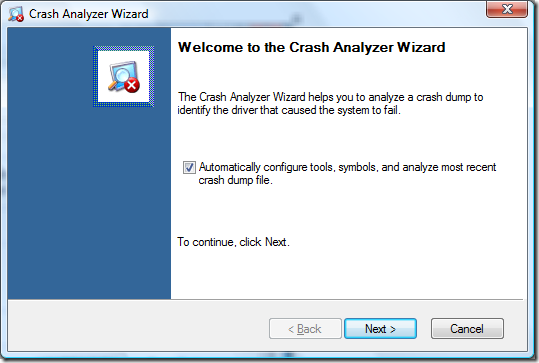
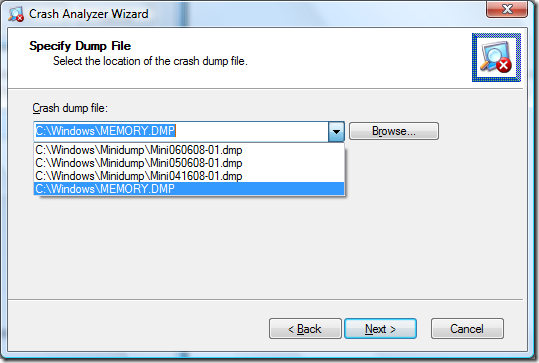
After installing the Debugging tools for Windows and DaRT, I fired up the Crash Analyzer Wizard, and chose the option to automatically configure everything.
You can also uncheck this box and manually specify the symbols location and choose a dump file to analyze.
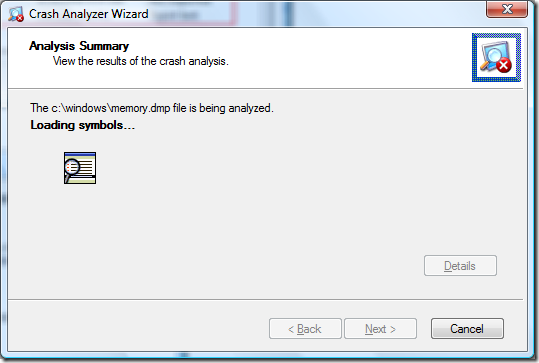
Hit the "Next" button and the wizard goes to town.
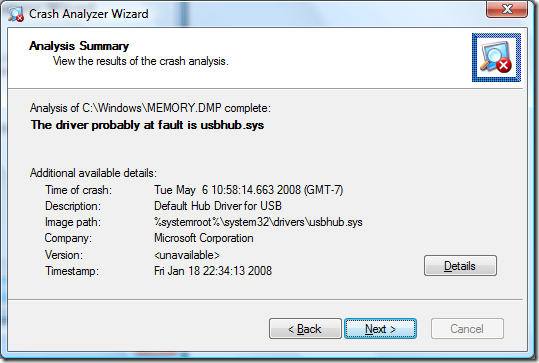
When it is done, you are pointed to the driver that caused your problem. In this particular case, I had a defective USB device that was causing problems. Other dumps I have analyzed indicated that a 3rd-party VPN client/driver was causing problems (updating to a newer version solved the problem)
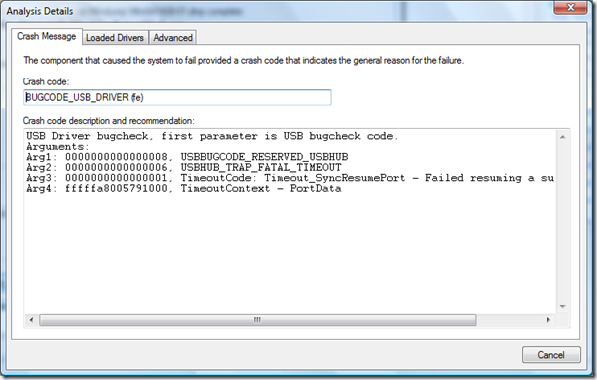
If you hit the "Details" button, you can see more information on the error, look at a list of drivers that were loaded at the time of the crash, and see a verbose analysis (great for forwarding to your friends if you want to impress them ;)
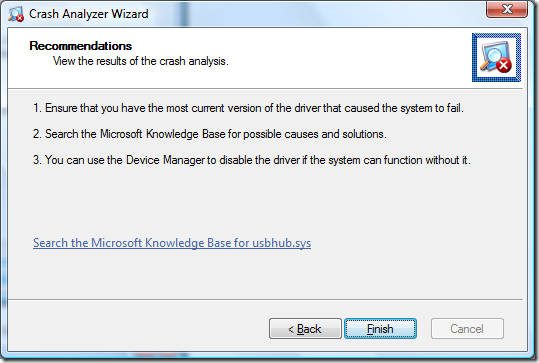
Finally, after pointing to a likely driver, the wizard suggests that you update to the most current version, and offers to search the Microsoft Knowledge Base for possible causes and solutions.
For more information on the Microsoft Desktop Optimization Pack (MDOP) which contains this tool, click here: https://www.microsoft.com/windows/products/windowsvista/enterprise/benefits/tools.mspx
Comments
Anonymous
January 01, 2003
在Teched上面听了盆盆精彩的MDOP Session后,小弟一直想测试一下,可惜无奈一直没有很充分的时间,上个礼拜周末终于抽出了时间,把Dart和App-V都测试了一下,果然如同盆盆Live时的Demo一样的cool哦~Anonymous
January 01, 2003
在Teched上面听了盆盆精彩的MDOP Session后,小弟一直想测试一下,可惜无奈一直没有很充分的时间,上个礼拜周末终于抽出了时间,把Dart和App-V都测试了一下,果然如同盆盆Live时的Demo一样的cool哦~Anonymous
January 01, 2003
Unfortunately, that's still DaRT 5.0, no DaRT 6.0 even for 30-day trial.
