SQL Server DBA Morning Health Checks
Introduction: As a Microsoft Premier Field Engineer, I get to work with amazing colleagues who create incredible customer solutions. Patrick Keisler ( blog | |
|  ) is a long time SQL Server professional, who also works as a PFE supporting customers throughout Europe. He recently created a very handy "SQL Server Morning Health Check" solution on short notice for one of his customers. The solution is very helpful and can be added easily to your morning routine as a DBA to monitor your SQL Server environment. Patrick, thanks for sharing!
SQL Server Morning Health Checks (Created by Patrick Keisler)
A few weeks ago, a customer asked me to help develop a way to improve their morning routine of checking the health of each SQL Server. This daily task would typically take about an hour for the DBA to complete. The solution I provided him, reduced that task to under one minute.
The DBA needed me to answer these questions for each SQL Server:
1. What is the uptime of each SQL Server?
2. What is the status of each database?
3. What is the status of each Availability Group?
4. What is the backup status of each database?
5. What is the available disk space?
6. Are there any SQL Agent failed jobs in the last 24 hours?
7. What errors appeared in the SQL errorlog in the last 24 hours?
In addition, the customer asked to display the results using the typical stop light colors (red, yellow, and green) to represent the condition of each server.
You might be thinking this sounds like a dashboard; however, they just wanted something simple that could be run by the DBA each morning, but also something that could be run by the other non-DBAs that provide backup during off-hours.
I only had a few days to get a solution up and running, so I needed something quick. To make my task a bit easier, the customer had a Central Management Server (CMS) with all servers registered. Armed with this information, I proceeded to use PowerShell to automate each of these tasks.
Step one was to loop through each registered server within CMS. Luckily for me, I had previously written a CMS function (Get-CmsServer) for the SQLPSX module. This function was originally created by Chrissy LeMaire but I had heavily modified it for the SQLPSX project. https://github.com/MikeShepard/SQLPSX https://blog.netnerds.net/smo-recipes/central-management-server/
To use this function, you just need to provide the name of the CMS server and the CMS group to loop through. The output is an array of SQL Servers that you can loop through.
$targetServerList = Get-CmsServer –cmsServer ‘SOLO\CMS’ –cmsGroup ‘PRODDUCTION’
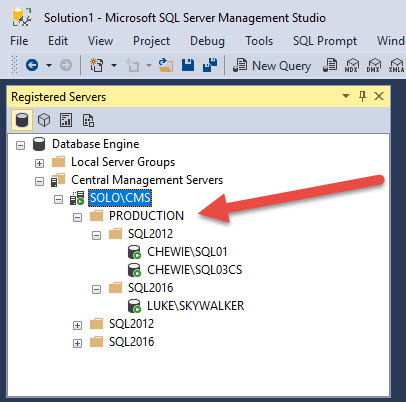
In the example above, we’ll connect to the CMS server ‘SOLO\CMS’ and get all the SQL Servers that are registered in the ‘PRODUCTION’ folder and all subfolders that may exist beneath it. 
In the picture above, if you only wanted to loop through the two servers in the SQL2012 folder, then you would specify the CMS group as -cmsGroup ‘PRODUCTION\SQL2012’.
Now that we can get the list of SQL Servers, we need to use SQL Server Management Objects (SMO) to complete the other tasks. The SMO is a .NET component that allows you to perform any management task against a SQL Server. Going into the how of using SMO is beyond the scope of this article, but links at the end of this article will help guide you. For our purposes, we’ll just be creating a simple ServerConnection to SQL Server.
$srv = New-Object (‘Microsoft.SqlServer.Management.Common.ServerConnection’) ‘MySqlServer\Instance’
$srv.Connect()
In the example above, we create a new ServerConnection object and then call the Connect method. From here, it’s a simple as passing TSQL queries and executing them.
$cmd = ‘SELECT sqlserver_start_time FROM sys.dm_os_sys_info;’
$results = $srv.ExecuteWithResults($cmd)
The output is stored in a dataset ($sqlStartupTime) which we can then use to calculate the uptime of the SQL Server by using New-TimeSpan.
$upTime = New-TimeSpan –Start ($results.Tables[0].sqlserver_start_time) –End ($results.Tables[0].current_timestamp)
Now that we have our up-time value, we can proceed with determining the condition level (critical, warning, or good) and then displaying the results. Each one of the condition checks are based on what my customer requested, but they can easily be changed for your needs.
Critical = SQL uptime < 6 hours
Warning = SQL uptime < 1 day but >= 6 hours
Good = SQL uptime > 1 day
We can just use a simple if statement to determine the condition.
if ($upTime.Day –eq 0 –and $upTime.Hours –lt 6) { #critical }
elseif ($upTime.Day –lt 1 –and $upTime.Hours –ge 6) { #warning }
else { #good }
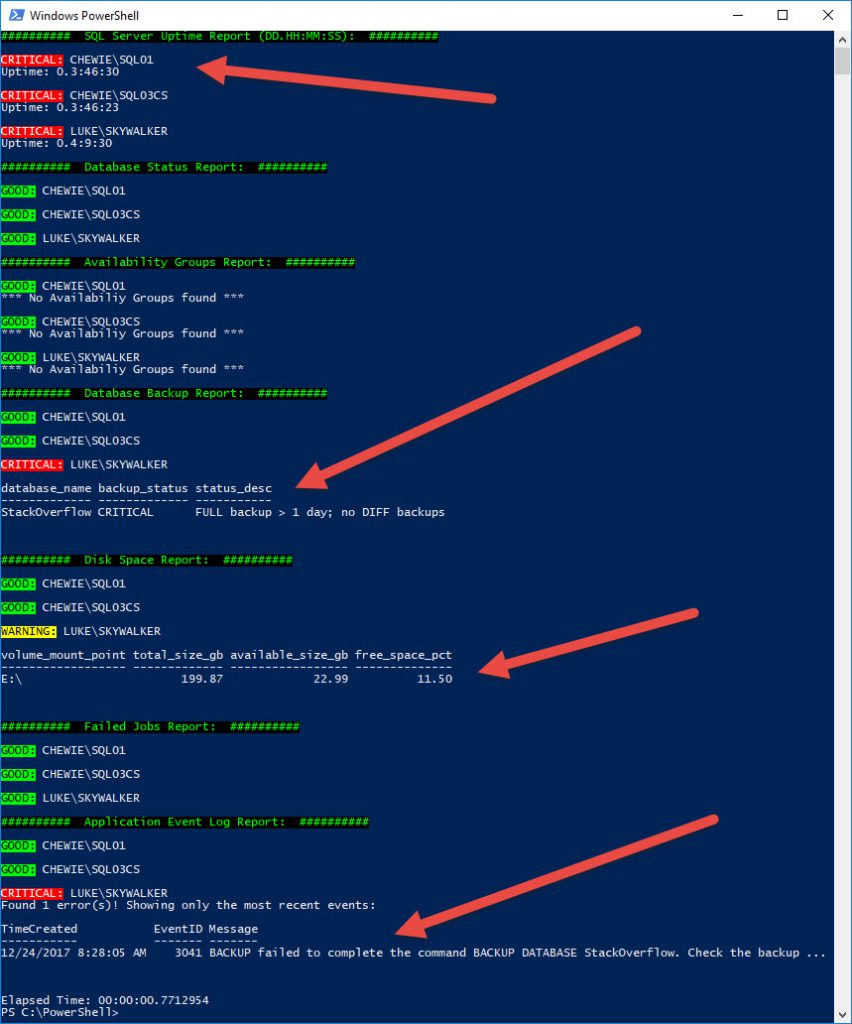
For the “stop light” effect, we will use the Write-Host command and adjust the foreground and background colors. For example, for critical we will use a background of red and foreground of white.
Write-Host “CRITICAL:” –Backgroundcolor Red –ForegroundColor White
The resulting output can be seen below. 
All of the other functions in this script are called and processed in much the same way, except for Get-AppLogEvents. Request #7 required me to scan the SQL Errorlog for any errors. While reading the contents of an Errorlog is simple, there is no real easy or efficient way to scan for specific errors or keywords. However, every time SQL Server writes an event to the Errorlog, it also writes the same event to the Windows Application Log. Knowing that, we can use Get-WinEvent to look for events that are classified as errors. One of the advantages to using Get-WinEvent is that we can use the FilterHashtable to filter our results on the target server before returning the results back to our client. This greatly reduces the amount of time to return results, but it also reduces the amount of data sent across the network.
$events = Get-WinEvent –ComputerName ‘MySqlServer’ –FilterHashtable @{LogName=’Application’;Level=2;StartTime=((Get-Date).AddDays(-1));ProviderName=’MSSQL$Instance’} –ErrorAction SilentlyContinue
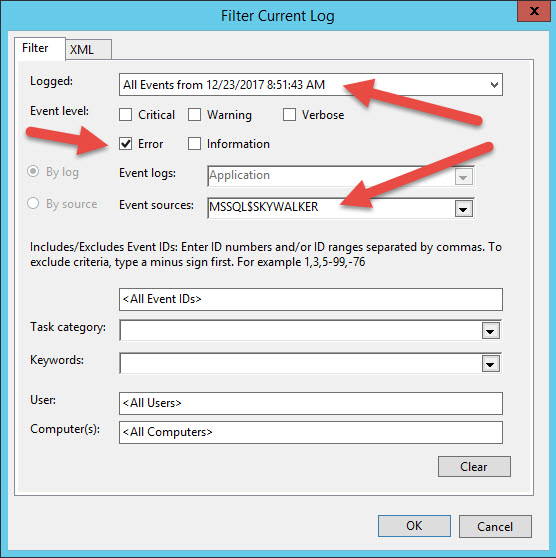
In the example above, the FilterHashtable is used to pass four filters. The first gets the events from the Application log, the second only returns errors (Level=2), the third returns events that occurred within the past 24 hours, and the fourth filters on the source ‘MSSQL$Instance’. If you used Event Viewer, you could filter the same information by selecting these options in the picture below. 
This function works only if your SQL Server does NOT use the “-n” startup option. Using that option prevents SQL Server from writing events to the Windows Application Log.
And there you have it; a simple PowerShell script to capture all that information from your environment. 
The complete script can be downloaded from GitHub. https://github.com/PatrickKeisler/SQLMorningHealthChecks
Additional references: /en-us/sql/relational-databases/server-management-objects-smo/sql-server-management-objects-smo-programming-guide /en-us/sql/database-engine/configure-windows/database-engine-service-startup-options
Comments
- Anonymous
January 02, 2018
I envy your environment where issues can wait to be addressed in the morning during coffee.- Anonymous
January 08, 2018
Agreed
- Anonymous
- Anonymous
February 22, 2018
How to send the same in email? - Anonymous
April 17, 2018
The comment has been removed - Anonymous
June 07, 2018
Can you provide the powershell script to get this output in HTML? - Anonymous
October 12, 2018
How to get the output report to email