View an entity diagram in KQL database (preview)
In Real-Time Intelligence, you can view the lineage and relationship of KQL database items. The view allows you to visually explore relationships between database entities and help you understand the data flow from the source to the destination, providing a clear graph representation. By using the entity diagram, you can efficiently manage your database and gain a deeper understanding of how these entities interact. This visual representation of entities simplifies database management and helps you optimize your data structures, making it easier to track dependencies and take actions quickly.
For information about workspace lineage in Fabric, see Lineage.
Important
This feature is in preview.
Prerequisites
- A workspace with a Microsoft Fabric-enabled capacity
- A KQL database with view permissions
Open entity diagram view
To access the view, browse to your desired KQL database and select Entity diagram.
What do you see in an entity diagram view?
When you open entity diagram view, you see the dependencies between all the items in the KQL database.

The entity diagram view displays the following information:
- Tables
- Update policies
- External tables
- Materialized views
- Functions
- Continuous exports
- Cross-database entities
You can select an item to view its relationships with other items in the database. The entity diagram highlights all the items related to that item, and dims the rest.
View ingestion details
You can also view the ingestion details of each table and materialized view. To view ingestion details, on the right side of the ribbon, select Show details and under Ingestion, select the desired time range. The information is added to the relevant entity's card.

What scenarios can you use an entity diagrams for?
This section explores various scenarios where you can use the entity diagram view in KQL database:
Proactively manage dependencies
Managing dependencies between entities like tables and functions becomes straightforward with lineage. For example, if you rename a table or alter its schema, you can instantly identify which functions rely on that table within their KQL query. This proactive approach helps avoid unexpected issues and ensures seamless updates to your database structure.
Trace relationships between materialized views and source tables
Entity diagrams allow you to trace the relationships between materialized views and their underlying source tables. This makes it simple to identify original data sources, enabling you to track and troubleshoot data flow more effectively.
Interact with elements and act
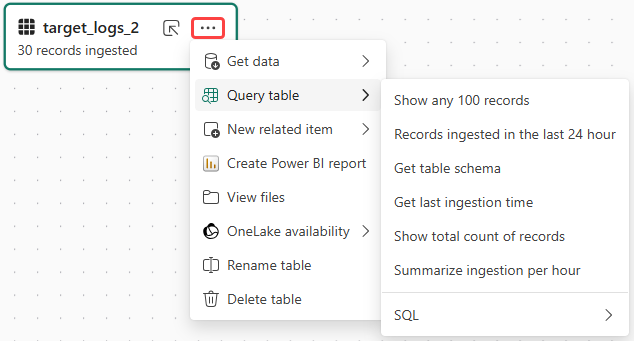
You can select on any element in the graph to highlight its related items, while the rest of the graph is dimmed out, making it easier to focus on specific relationships. For tables and external tables, in the More menu [...], you can select other options, such as querying the table, creating a Power BI report based on the table, and more.
Track record ingestion
Entity diagrams enable you to track how many records were ingested into each table and materialized view. This clear view of data flows helps you stay on top of ingestion size and volume, ensuring your database processes data correctly.