Configure Connection Monitor for Azure ExpressRoute
This article guides you through configuring a Connection Monitor extension to monitor ExpressRoute. Connection Monitor is a cloud-based network monitoring solution that tracks connectivity between Azure cloud deployments and on-premises locations (such as branch offices). It's part of Azure Monitor logs and allows you to monitor network connectivity for both private and Microsoft peering connections. By configuring Connection Monitor for ExpressRoute, you can identify and resolve network issues.
Note
This article was recently updated to use the term Azure Monitor logs instead of Log Analytics. Log data is still stored in a Log Analytics workspace and is still collected and analyzed by the same Log Analytics service. We are updating the terminology to better reflect the role of logs in Azure Monitor. See Azure Monitor terminology changes for details.
With Connection Monitor for ExpressRoute, you can:
- Monitor loss and latency across various VNets and set alerts.
- Monitor all network paths, including redundant ones.
- Troubleshoot transient and point-in-time network issues that are difficult to replicate.
- Identify specific network segments responsible for degraded performance.
Workflow
Monitoring agents are installed on multiple servers, both on-premises and in Azure. These agents communicate by sending TCP handshake packets, allowing Azure to map the network topology and traffic paths.
- Create a Log Analytics workspace.
- Install and configure software agents (not required for Microsoft Peering only):
- Install monitoring agents on on-premises servers and Azure VMs (for private peering).
- Configure settings on monitoring agent servers to allow communication (for example, open firewall ports).
- Configure network security group (NSG) rules to allow communication between monitoring agents on Azure VMs and on-premises agents.
- Enable Network Watcher on your subscription.
- Set up monitoring by creating connection monitors with test groups to monitor source and destination endpoints across your network.
If you're already using Network Performance Monitor (deprecated) or Connection Monitor and have a Log Analytics workspace in a supported region, you can skip steps 1 and 2 and start from step 3.
Create a workspace
Create a workspace in the subscription that has the VNets linked to the ExpressRoute circuit.
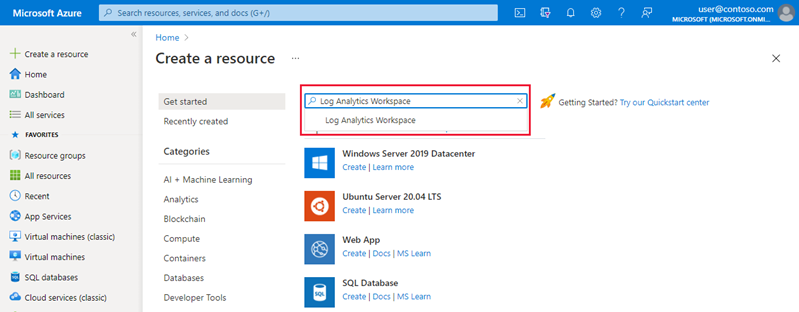
Sign in to the Azure portal. From the subscription with the virtual networks connected to your ExpressRoute circuit, select + Create a resource. Search for Log Analytics Workspace, then select Create.
Note
You can create a new workspace or use an existing one. If using an existing workspace, ensure it's been migrated to the new query language. More information...
Create a workspace by entering or selecting the following information:
Settings Value Subscription Select the subscription with the ExpressRoute circuit. Resource Group Create a new or select an existing resource group. Name Enter a name to identify this workspace. Region Select a region where this workspace is created. 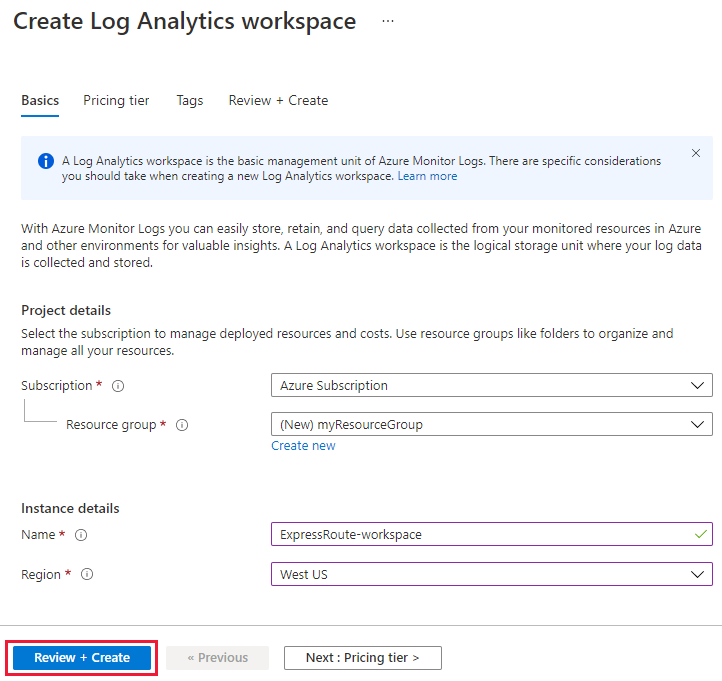
Note
The ExpressRoute circuit can be anywhere in the world. It doesn't have to be in the same region as the workspace.
Select Review + Create to validate and then Create to deploy the workspace. Once deployed, continue to the next section to configure the monitoring solution.
Configure monitoring solution
Complete the Azure PowerShell script by replacing the values for $SubscriptionId, $location, $resourceGroup, and $workspaceName. Then run the script to configure the monitoring solution.
$subscriptionId = "Subscription ID should come here"
Select-AzSubscription -SubscriptionId $subscriptionId

$location = "Workspace location should come here"
$resourceGroup = "Resource group name should come here"
$workspaceName = "Workspace name should come here"

$solution = @{
    Location          = $location
    Properties        = @{
        workspaceResourceId
        workspaceResourceId = "/subscriptions/$($subscriptionId)/resourcegroups/$($resourceGroup)/providers/Microsoft.OperationalInsights/workspaces/$($workspaceName)"
    }
    Plan              = @{
        Name          = "NetworkMonitoring($($workspaceName))"
        Publisher     = "Microsoft"
        Product       = "OMSGallery/NetworkMonitoring"
        PromotionCode = ""
    }
    ResourceName      = "NetworkMonitoring($($workspaceName))"
    ResourceType      = "Microsoft.OperationsManagement/solutions"
    ResourceGroupName = $resourceGroup
}

New-AzResource @solution -Force
Once you configure the monitoring solution, proceed to install and configure the monitoring agents on your servers.
Install and configure agents on-premises
Download the agent setup file
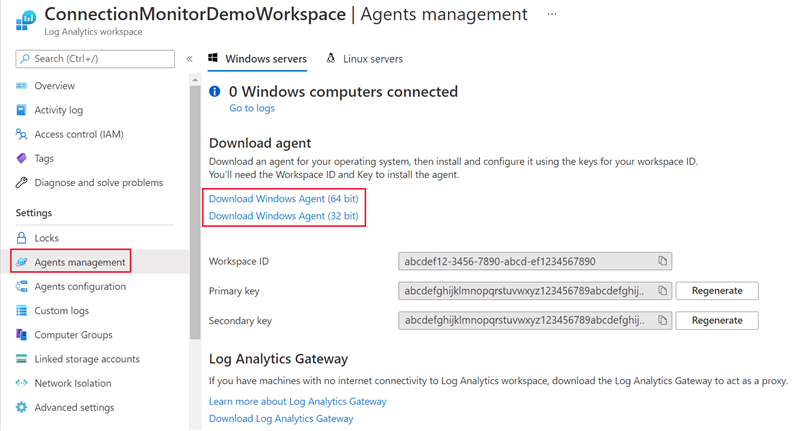
Navigate to the Log Analytics workspace and select Agents management under Settings. Download the agent that corresponds to your machine's operating system.
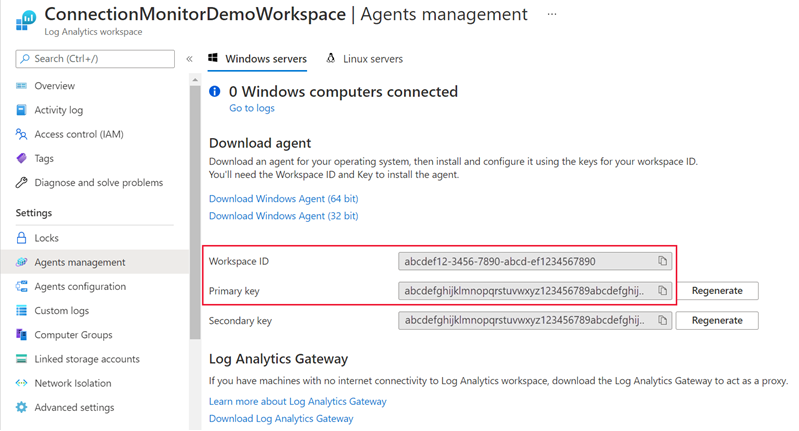
Copy the Workspace ID and Primary Key to Notepad.
For Windows machines, download and run this PowerShell script EnableRules.ps1 in a PowerShell window with Administrator privileges. The script opens the relevant firewall port for TCP transactions.
For Linux machines, change the port number manually:
- Navigate to /var/opt/microsoft/omsagent/npm_state.
- Open the npmdregistry file.
- Change the value for Port Number
PortNumber:<port of your choice>.
Install Log Analytics agent on each monitoring server
Install the Log Analytics agent on at least two servers on both sides of the ExpressRoute connection for redundancy. Follow these steps:
Select the appropriate operating system for the steps to install the Log Analytics agent on your servers:
After installation, the Microsoft Monitoring Agent appears in the Control Panel. Review your configuration and verify the agent connectivity to Azure Monitor logs.
Repeat steps 1 and 2 for other on-premises machines you wish to monitor.
Install Network Watcher agent on each monitoring server
New Azure virtual machine
If creating a new Azure VM for monitoring connectivity, you can install the Network Watcher agent during VM creation.
Existing Azure virtual machine
If using an existing VM, install the Network Agent separately for Linux and Windows.
Open firewall ports on monitoring agent servers
Ensure firewall rules allow TCP or ICMP packets between source and destination servers for connection monitoring.
Windows
Run the EnableRules PowerShell script (downloaded earlier) in a PowerShell window with administrative privileges. This script creates the necessary registry keys and Windows Firewall rules.
Note
The script configures Windows Firewall rules only on the server where it's bring run. Ensure network firewalls allow traffic for the TCP port used by Connection Monitor.
Linux
Change port numbers manually:
- Navigate to /var/opt/microsoft/omsagent/npm_state.
- Open the npmdregistry file.
- Change the value for Port Number
PortNumber:<port of your choice>. Ensure the same port number is used across all agents in a workspace.
Configure Network Security Group rules
To monitor servers in Azure, configure NSG rules to allow TCP or ICMP traffic from Connection Monitor. The default port is 8084.
For more information about NSG, see the tutorial on filtering network traffic.
Note
Ensure agents are installed (both on-premises and Azure) and run the PowerShell script before proceeding.
Enable Network Watcher
Ensure Network Watcher is enabled for your subscription. For more information, see Enable Network Watcher.
Create a connection monitor
For a high-level overview of creating a connection monitor, tests, and test groups, see Create a connection monitor. Follow these steps to configure connection monitoring for Private Peering and Microsoft Peering:
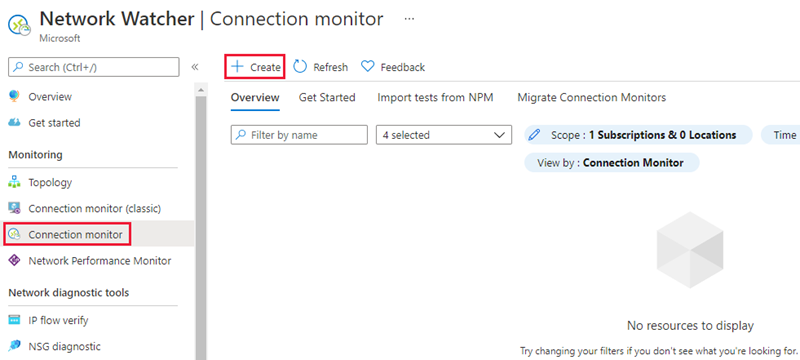
In the Azure portal, navigate to your Network Watcher resource and select Connection monitor under Monitoring. Select Create to create a new connection monitor.
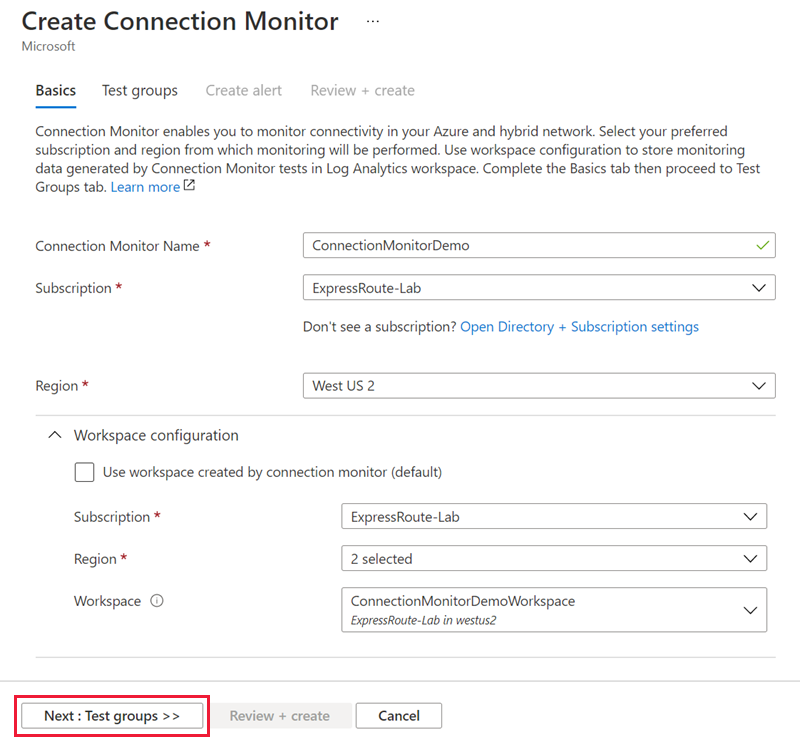
On the Basics tab, select the same region where you deployed your Log Analytics workspace for the Region field. For Workspace configuration, select the existing Log Analytics workspace you created earlier. Then select Next: Test groups >>.
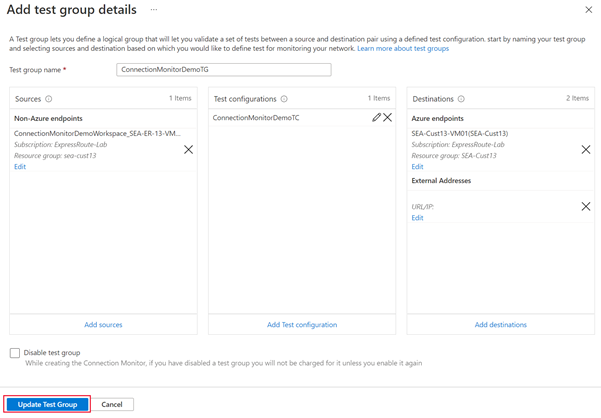
On the Add test group details page, add the source and destination endpoints for your test group. Enter a Name for this test group.
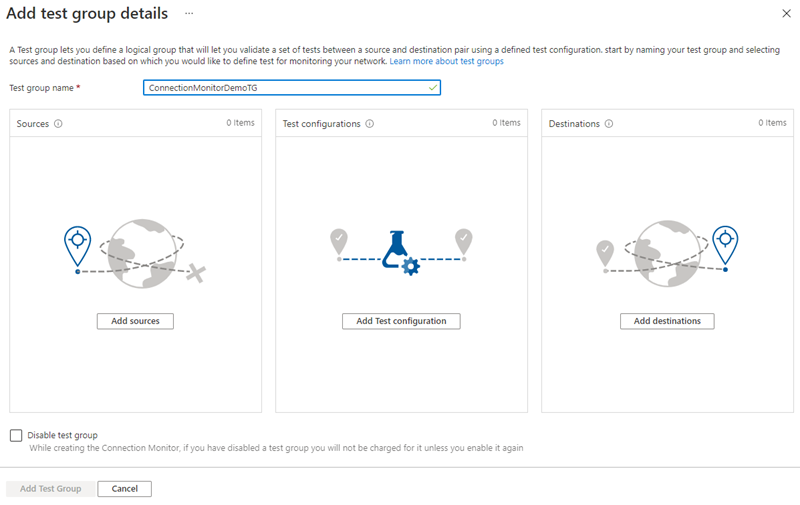
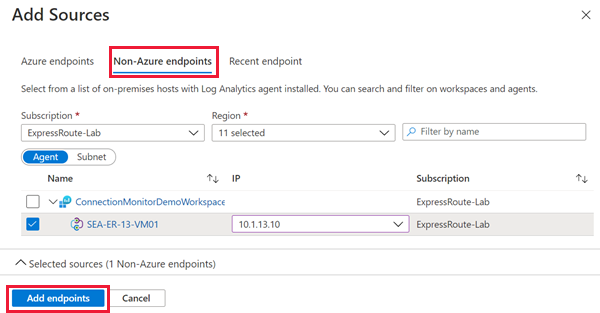
Select Add source and navigate to the Non-Azure endpoints tab. Choose the on-premises resources with Log Analytics agent installed that you want to monitor, then select Add endpoints.
Select Add destinations.
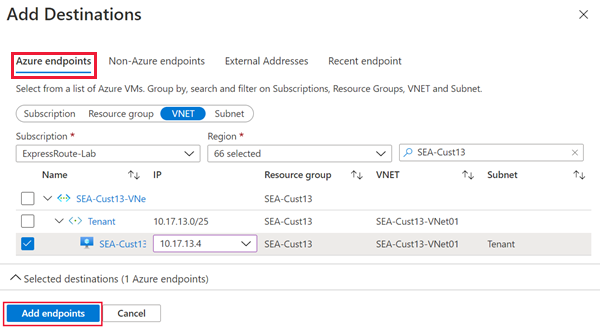
To monitor connectivity over ExpressRoute private peering, navigate to the Azure endpoints tab. Choose the Azure resources with the Network Watcher agent installed that you want to monitor. Select the private IP address of each resource in the IP column. Select Add endpoints.
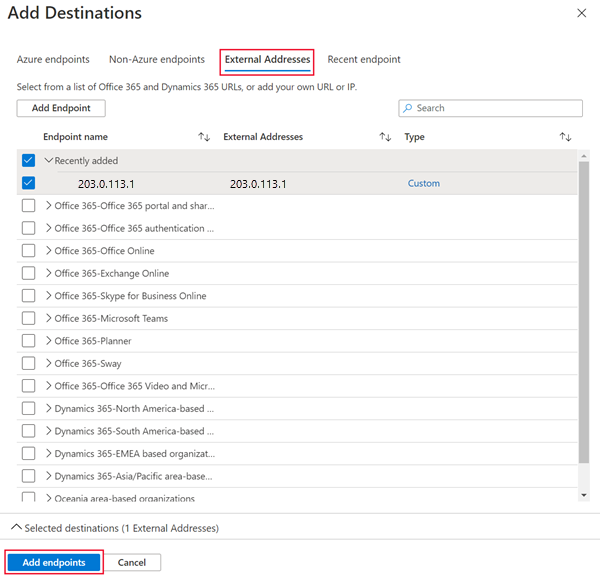
To monitor connectivity over ExpressRoute Microsoft peering, navigate to the External Addresses tab. Select the Microsoft services endpoints you wish to monitor. Select Add endpoints.
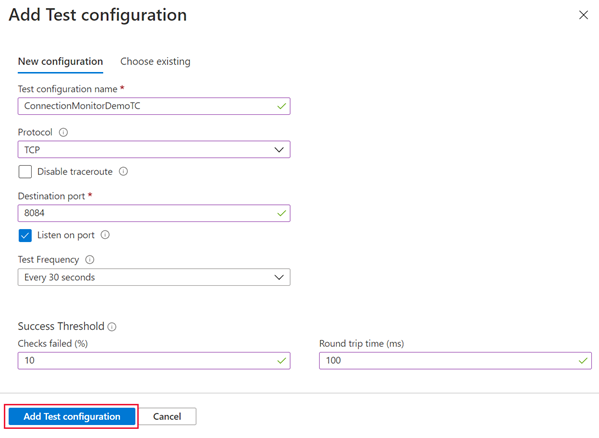
Select Add test configuration. Choose TCP for the protocol, and input the destination port you opened on your servers. Configure your test frequency and thresholds for failed checks and round trip time. Select Add Test configuration.
Select Add Test Group once you've added your sources, destinations, and test configuration.
Select Next : Create alert >> if you want to create alerts. Once completed, select Review + create and then Create.

View results
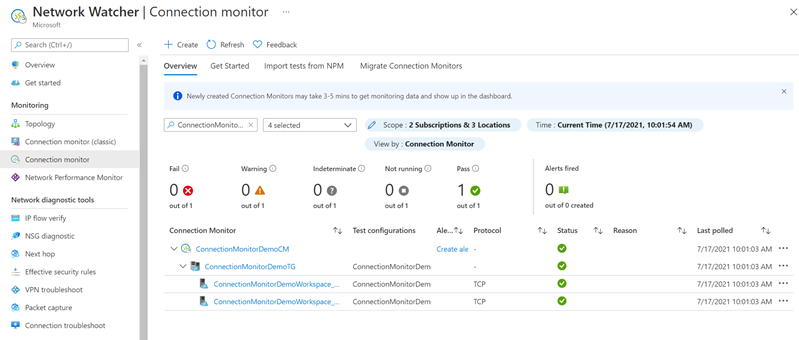
Go to your Network Watcher resource and select Connection monitor under Monitoring. You should see your new connection monitor after 5 minutes. To view the connection monitor's network topology and performance charts, select the test from the test group dropdown.
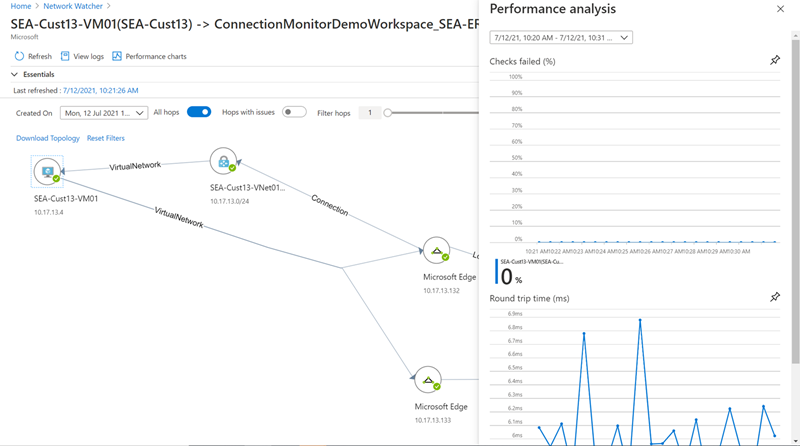
In the Performance analysis panel, view the percentage of check failures and each test's round-trip time results. Adjust the time frame for the displayed data using the dropdown at the top of the panel.
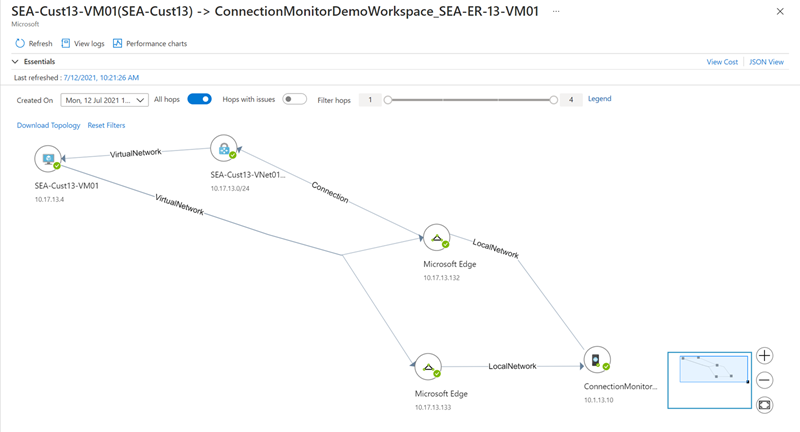
Closing the Performance analysis panel reveals the network topology detected by the connection monitor between the source and destination endpoints. This view shows the bi-directional traffic paths and hop-by-hop latency before reaching Microsoft's edge network.
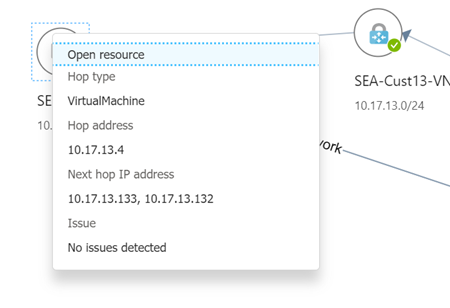
Selecting any hop in the topology view displays additional information about the hop. Any issues detected by the connection monitor are displayed here.


Next steps
Learn more about Monitoring Azure ExpressRoute