Analyze data using Log Analytics simple mode
Log Analytics simple mode offers an intuitive point-and-click interface for analyzing and visualizing log data. You can effortlessly switch between simple and KQL modes, and set Log Analytics to open in simple mode by default.
This article explains how to use Log Analytics simple mode to explore and analyze data in Azure Monitor Logs.
Tutorial video
Note
This video shows an earlier version of the user interface, but the screenshots throughout this article are up to date and reflect the current UI.
How simple mode works
Simple mode lets you get started quickly by retrieving data from one or more tables with one click. You then use a set of intuitive controls to explore and analyze the retrieved data.
Get started in simple mode
In simple mode, you can retrieve logs with one click whether you open Log Analytics in resource or workspace context.
When you select a table or a predefined query or function in simple mode, Log Analytics automatically retrieves the relevant data for you to explore and analyze.
To get started, you can:
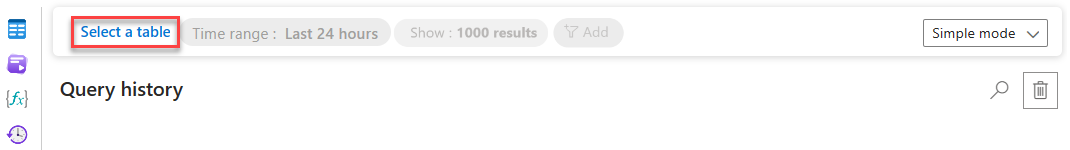
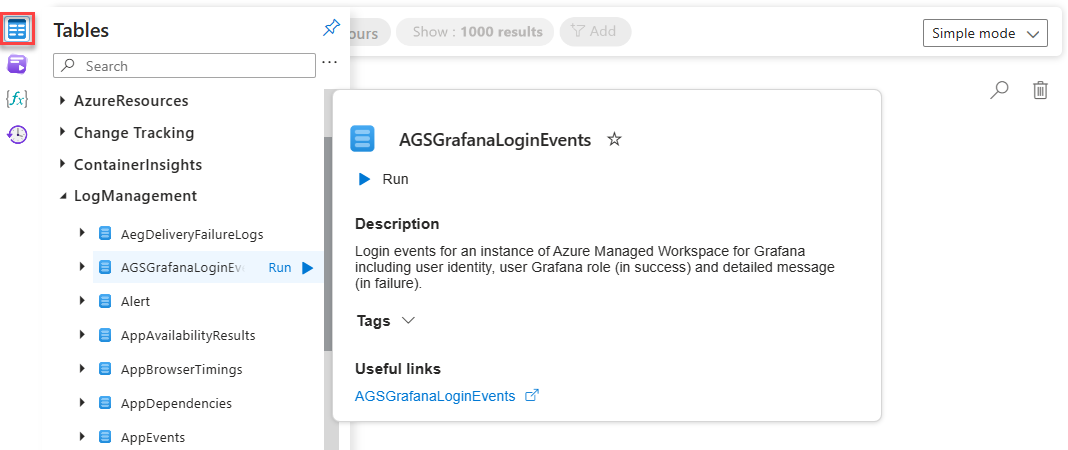
Click Select a table and select a table from the Tables tab to view table data.
Alternatively, select Tables from the left pane to view the list of tables in the workspace.
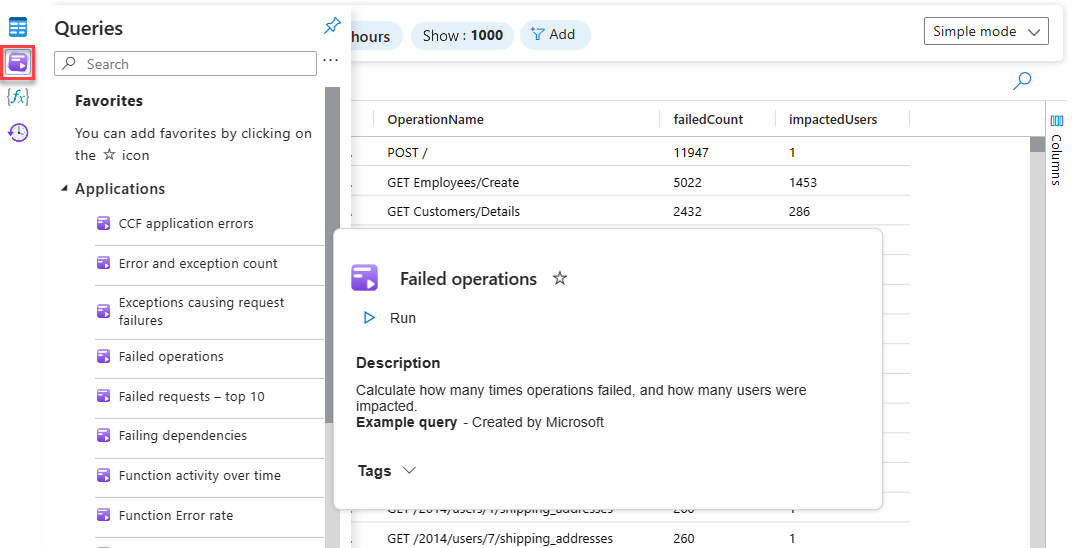
Use an existing query, such as a shared or saved query, or an example query.
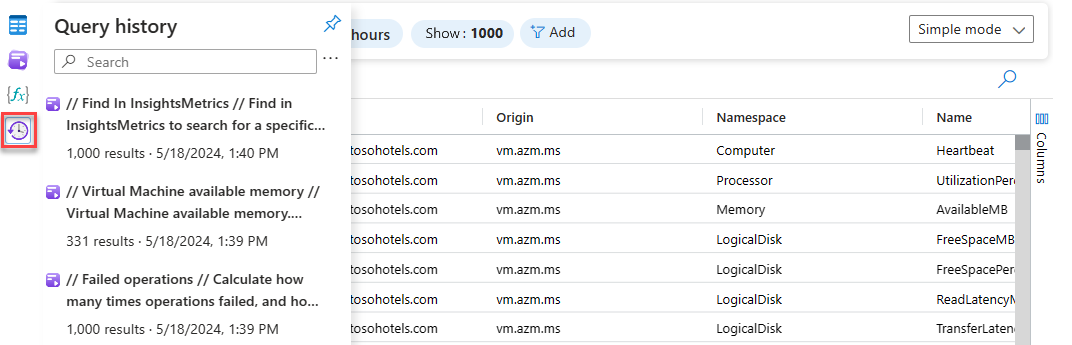
Select a query from your query history.
Select a function.
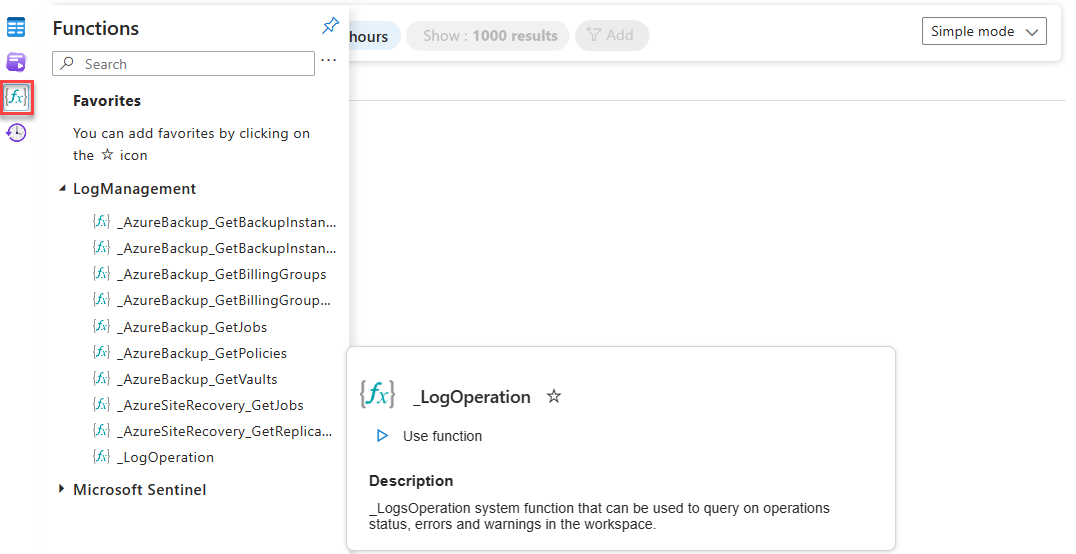
Important
Functions let you reuse query logic and often require input parameters or additional context. In such cases, the function won't run until you switch to KQL mode and provide the required input.


Explore and analyze data in simple mode
After you get started in simple mode, you can explore and analyze data using the top query bar.
Note
The order in which you apply filters and operators affects your query and results. For example, if you apply a filter and then aggregate, Log Analytics applies the aggregation to the filtered data. If you aggregate and then filter, the aggregation is applied to the unfiltered data.
Change time range and number of records displayed
By default, simple mode lists the latest 1,000 entries in the table from the last 24 hours.
To change the time range and number of records displayed, use the Time range and Show selectors. For more information about result limit, see Configure query result limit.

Note
The time range you set is applied at the end of the query and doesn't change the amount of data being queried.
Filter by column
Select Add and choose a column.

Select a value to filter by, or enter text or numbers in the Search box.
If you filter by selecting values from a list, you can select multiple values. If the list is long, you see a Not all results are shown message. Scroll to the bottom of the list and select Load more results to retrieve more values.


Search for entries that have a specific value in the table
Select Add > Search in table.
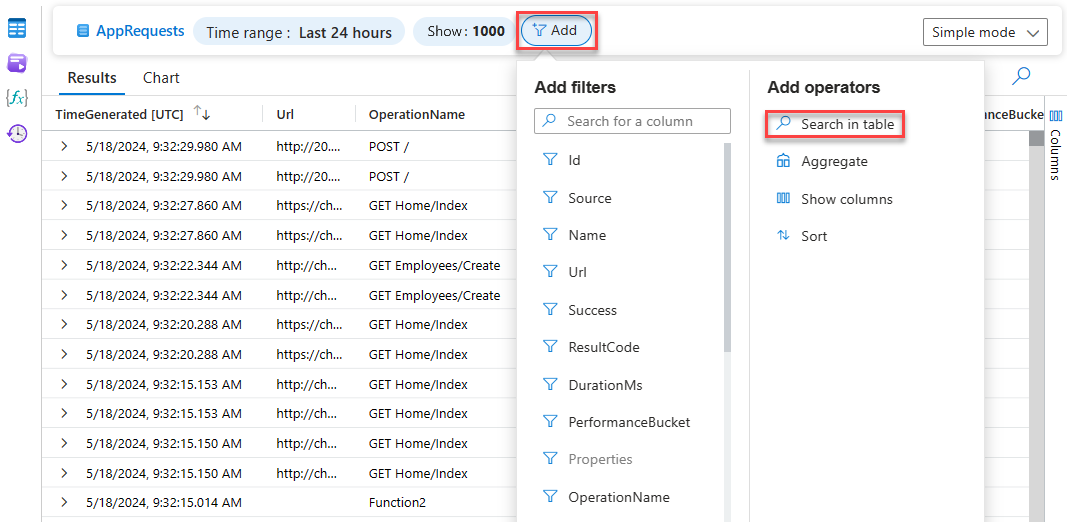
Enter a string in the Search this table box and select Apply.
Log Analytics filters the table to show only entries that contain the string you entered.

Important
We recommend using Filter if you know which column holds the data you're searching for. The search operator is substantially less performant than filtering, and might not function well on large volumes of data.
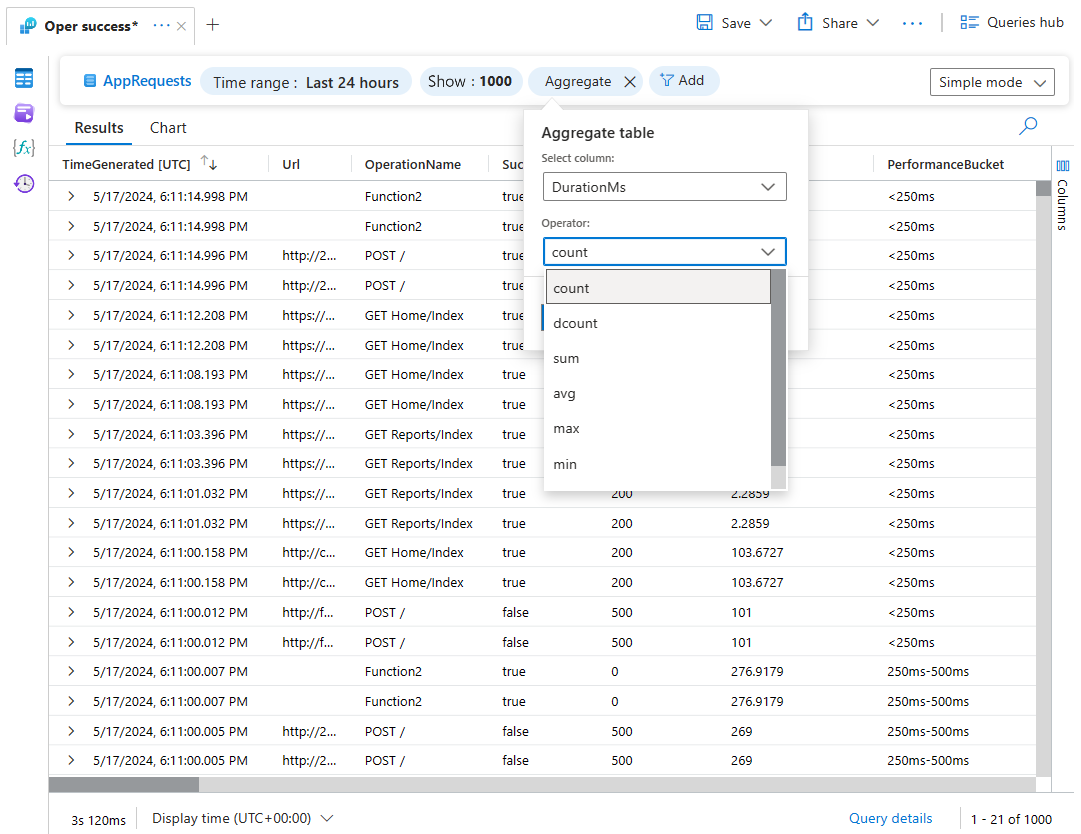
Aggregate data
Select Add > Aggregate.
Select a column to aggregate by and select an operator to aggregate by, as described in Use aggregation operators.

Show or hide columns
Select Add > Show columns.
Select or clear columns to show or hide them, then select Apply.


Sort by column
Select Add > Sort.
Select a column to sort by.
Select Ascending or Descending, then select Apply.
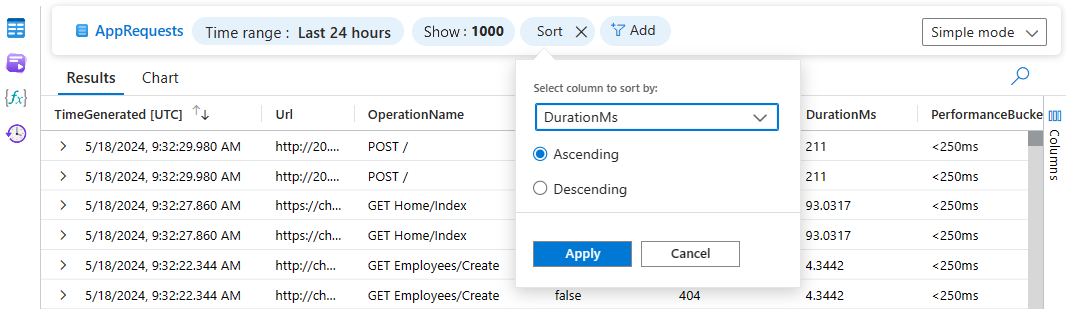
Select Sort again to sort by another column.

Use aggregation operators
Use aggregation operators to summarize data from multiple rows, as described in this table.
| Operator | Description |
|---|---|
| count | Counts the number of times each distinct value exists in the column. |
| dcount | For the dcount operator, you select two columns. The operator counts the total number of distinct values in the second column correlated to each value in the first column. For example, this shows the distinct number of result codes for successful and failed operations:
|
| sum avg max min |
For these operators, you select two columns. The operators calculate the sum, average, maximum, or minimum of all values in the second column for each value in the first column. For example, this shows the total duration of each operation in milliseconds for the past 24 hours:
|
| stdev | Calculates the standard deviation of a set of values. |
Important
Basic logs tables don't support aggregation using the avg and sum operators.
Switch modes
To switch modes, select Simple mode or KQL mode from the dropdown in the top right corner of the query editor.

When you begin to query logs in simple mode and then switch to KQL mode, the query editor is prepopulated with the KQL query related to your simple mode analysis. You can then edit and continue working with the query.

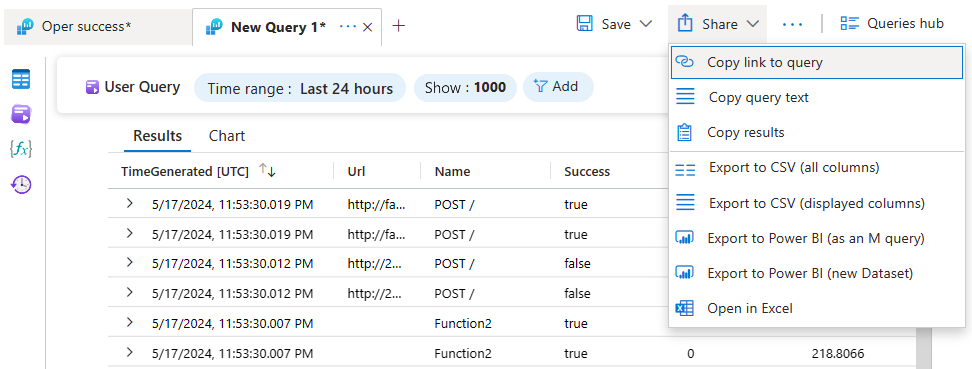
For straightforward queries on a single table, Log Analytics displays the table name at the right of the top query bar in simple mode. For more complex queries, Log Analytics displays User Query at the left of the top query bar. Select User Query to return to the query editor and modify your query at any time.

Configure query result limit
Select Show to open the Show results window.
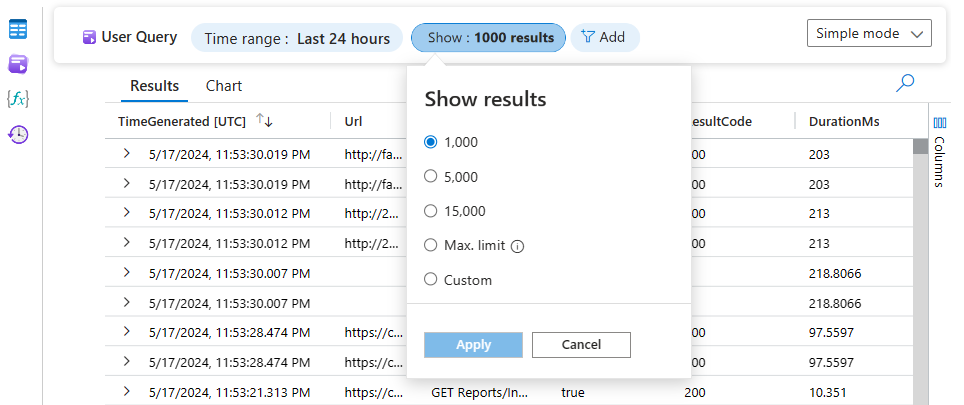
Select one of the preset limits, or enter a custom limit.
The maximum number of results that you can retrieve in the Log Analytics portal experience, in both simple mode and KQL mode, is 30,000. However, when you share a Log Analytics query with an integrated tool, or use the query in a search job, the query limit is set based on the tools you choose.
Select Max. limit to return the maximum number of results provided by any of the tools available on the Share window or using a search job.
This table lists the maximum result limits of Azure Monitor log queries using the various tools:


| Tool | Description | Max. limit |
|---|---|---|
| Log Analytics | Queries you run in the Azure portal. | 30,000 |
| Excel, Power BI, Log Analytics Query API | Queries you use in Excel and Power BI, which are integrated with Log Analytics, and queries you run using the API. | 500,000 |
| Search job | Azure Monitor reingests the results of a query your run in search job mode into a new table in your Log Analytics. | 1,000,000 |
Next steps
- Walk through a tutorial on using KQL mode in Log Analytics.
- Access the complete reference documentation for KQL.