SQL database in Fabric tutorial introduction
Applies to: ✅ SQL database in Microsoft Fabric
Microsoft Fabric provides a one-stop shop for all the analytical needs for every enterprise. The purpose of this tutorial is to provide a comprehensive guide to utilizing a SQL database in Fabric. This tutorial is tailored to help you navigate through the process of database creation, setting up database objects, exploring autonomous features, and combining and visualizing data. Additionally, you'll learn how to create a GraphQL endpoint, which serves as a modern approach to connecting and querying your data efficiently. You'll also learn how to use the SQL analytics endpoint to work with mirrored data for reporting and analysis, and developing data visualizations.
Important
This feature is in preview.
This tutorial is structured to offer hands-on experience, guiding you through each step of the process to ensure a solid understanding of the SQL database in Fabric within the Microsoft Fabric ecosystem. You'll gain insights into the seamless integration points and the diverse experiences tailored for both the professional and the citizen developer within Microsoft Fabric.
This tutorial isn't intended to serve as a reference architecture, nor does it cover an exhaustive list of features and functionalities. It's also not a prescriptive guide on best practices but rather a foundational walkthrough to familiarize you with the capabilities and user experience of SQL database in Fabric.
SQL database in Fabric end-to-end scenario
As prerequisites to this tutorial, complete the following steps:
- Sign into your Power BI online account, or if you don't have an account yet, sign up for a free trial.
- Enable Microsoft Fabric for your organization in your tenant.
In this tutorial, you take on the role of a database developer, working at the Contoso Group. Your organization wants to evaluate Supply Chain information for the AdventureWorks and Northwind Traders subsidiaries based on past sales and current on-hand components for various products used in manufacturing.
You'll use sample data along with data and views that you create to Your goal is to create a visualization of this data and to enable real-time analysis of the data available to an application. You have chosen GraphQL as the primary data API for the solution. Here are the steps in this tutorial:
- Create a Microsoft Fabric Workspace
- Create a SQL database in Microsoft Fabric
- Ingest Sample Data and Create Extra objects and Data
- Query the database and review autonomous features
- Use the SQL analytics endpoint to Query data
- Create and share visualizations
- Perform Data Analysis using Microsoft Fabric Notebooks
- Create an application using DevOps and the GraphQL API
- Clean up resources
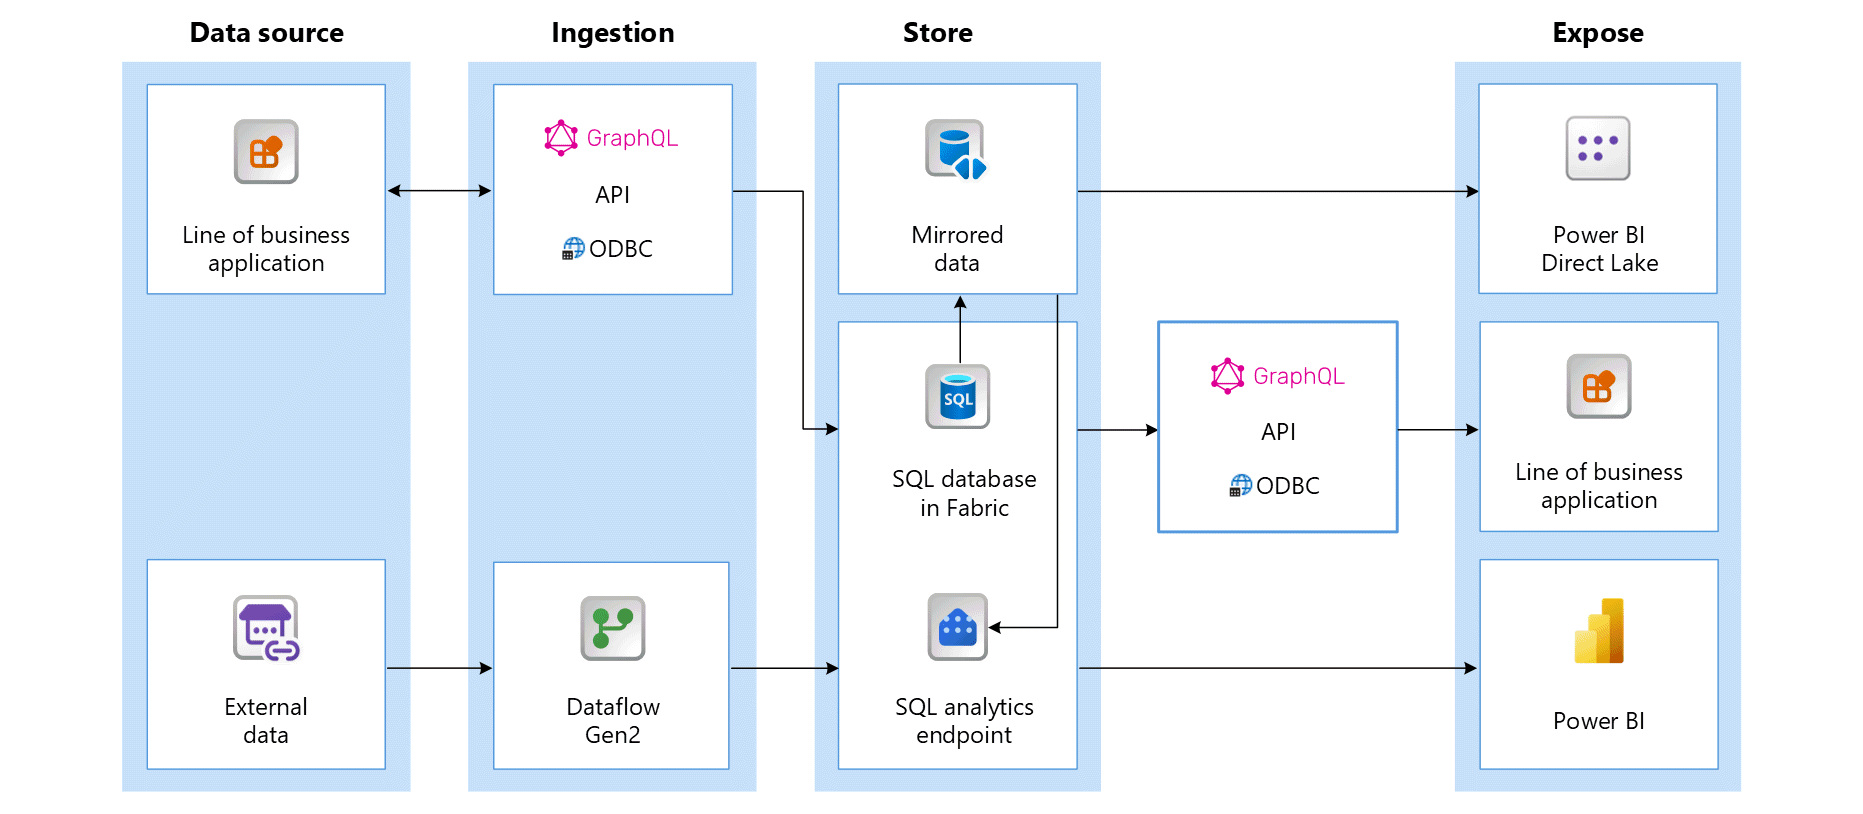
SQL database in Fabric end-to-end architecture
Here's a summary of the architecture this tutorial introduces.

Data sources - Microsoft Fabric makes it easy and quick to connect to Azure Data Services, other cloud platforms, and on-premises data sources to ingest data and build applications that generate and edit data.
Ingestion - With 200+ native connectors as part of the Microsoft Fabric pipeline and with drag and drop data transformation with dataflow, you can quickly build insights for your organization. Shortcut is a new feature in Microsoft Fabric that provides a way to connect to existing data without having to copy or move it. You can find more details about the Shortcut feature later in this tutorial. For development, you have the Tabular Data Stream (TDS) protocol that can access the database just like a SQL Server instance. You also have GraphQL API to query across not only SQL database in Fabric, but multiple data sources in Microsoft Fabric, in a consistent, safe, and integrated way.
Store, Query and Enrich – SQL database in Fabric works with industry standard Transact-SQL commands to create, read, update, and delete data and data objects, as well as the GraphQL API.
Expose - Data from SQL database in Fabric and the SQL analytics endpoint can be consumed by Power BI, the industry leading business intelligence tool, for reporting and visualization. Each SQL database in Fabric connection and SQL analytics endpoint comes with a built-in TDS endpoint for easily connecting to and querying data from other reporting tools, when needed. When a SQL database is created, a secondary item called a default semantic model is generated at the same time with the same name. You can use the default semantic model through the SQL analytics endpoint of the SQL database. With a semantic model, you can visualize data with just a couple of steps. The SQL database and the SQL analytics endpoint can be exposed through the GraphQL API.
Sample data
For sample data in this tutorial, you'll use a subset of the AdventureWorksLT and the Northwind sample databases. For this end-to-end scenario, you'll ingest and generate sufficient data objects and data for a sneak peek into the scale and performance capabilities of SQL database in the Microsoft Fabric platform. This sample can be extended to show many more capabilities of the platform.
Typically, you would create data from transactional systems (or line of business applications) in a database, and then copy or roll up the data into a data lake or data warehouse staging area. However, for this tutorial, you'll use the sample Sales and Products data as a starting point, add warehouse data, which you'll join to the other tables, and create Views for the data along the way.
Data model
The SalesLT sample data for SQL database in Microsoft Fabric is a subset of the larger AdventureWorks database and includes the following data elements and relationships. In this tutorial you'll create a Warehouse table, which is shown in this Data Model. For this example, only numeric keys for the data are created, and the data is generated from a setup script. To extend this example, you'll normalize the Warehouse table with a Northwind table import for names, descriptions, and other supplier information.