Feature usage and adoption report (preview)
The feature usage and adoption report is aimed at admins who want to understand how Fabric features are utilized across the organization. As an admin, the report insights can help you govern your Fabric tenant and take action when needed.
You can access the report from the Admin monitoring workspace. To access the workspace, you must be a Fabric administrator.
You can also have an admin share the report or semantic model directly with you. With build permissions to the semantic model, users can design a custom report that relies on the same underlying data.
Navigation
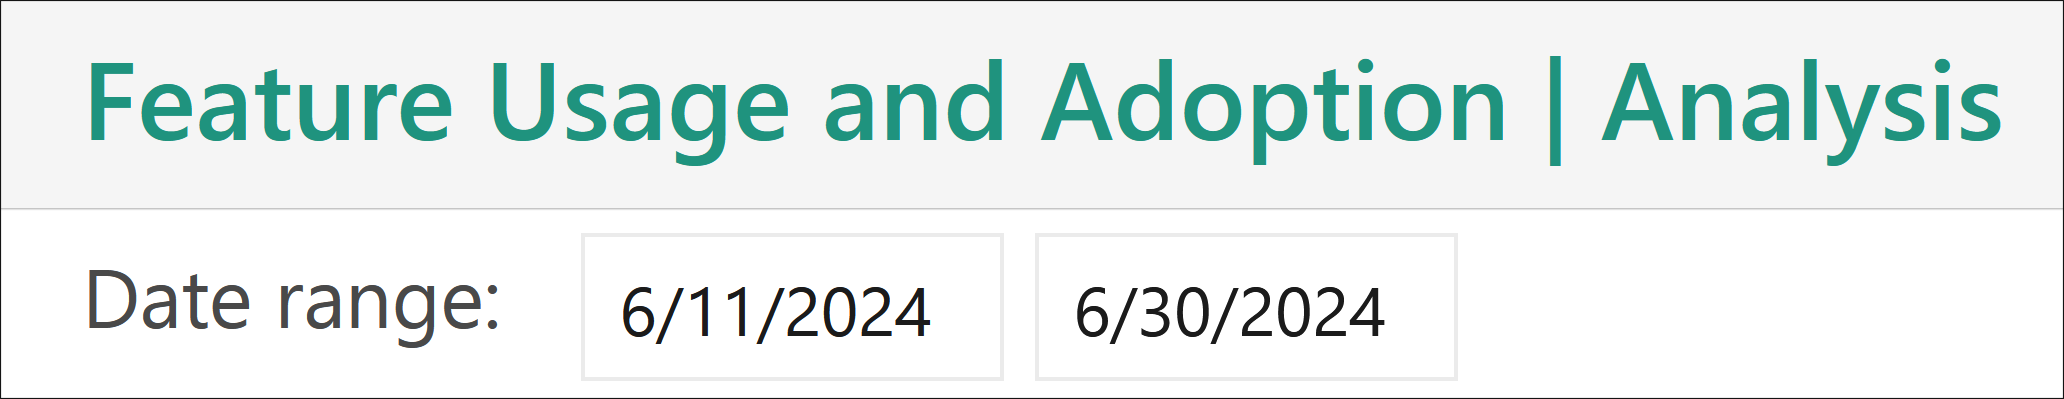
The report is designed for admins to analyze Fabric activity in various ways. Use the date range slicer to filter activity data across all pages for a specific range of time over the last 30 days.
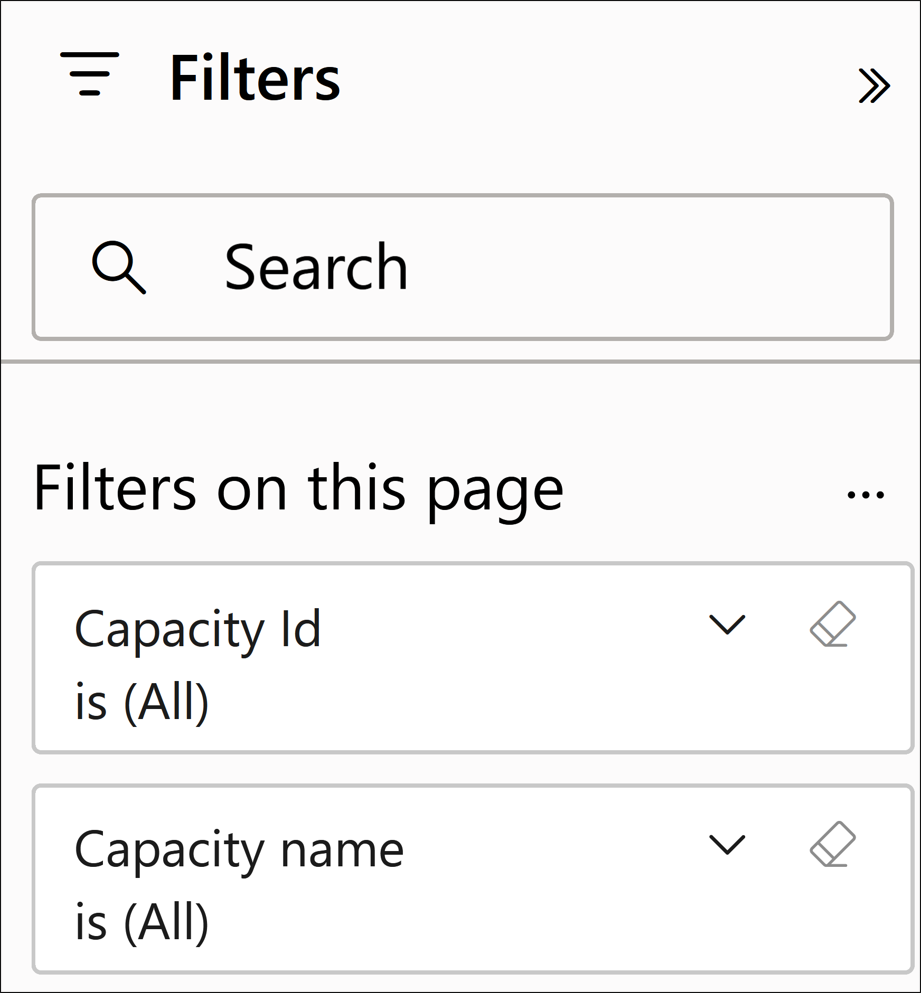
Additionally, use the filter pane to filter activity data based on the desired analysis. Filters are available across different characteristics of activity, including capacity, user, and item-related info.
Report pages
The report is composed of five pages:
Activity Overview - Provides a high-level overview of Fabric activity across the organization
Analysis - Visualizes activity across different activity dimensions
Activity Details - Shows detailed information on specific activity scenarios
Inventory - Lists all Fabric items in your tenant
Item Details page - Shows detailed information on specific inventory usage scenarios
Activity Overview page
The Activity Overview page helps you identify:
Daily activities and user trends
The most active capacities and workspaces
Activities in your organization by your most or least active users
Example
In a large retail organization, you might use the Activity Overview page to check which capacities were most utilized in a given month. Using the date range slicer to filter to the month of December, you notice the Sales and Marketing capacity had nearly 1,000 activities while other capacities had under 200. To understand why this is happening, you then go to the Analysis page.
Analysis page
On the Analysis page, you can view:
A daily count of activity and users by date
A decomposition tree to drill down into activity using dimensions such as operation, capacity, user, and more
Example
Continuing the example from the Activity Overview page, you use the Analysis page to investigate why the Sales and Marketing capacity had more activity in December than all other capacities. The decomposition tree reveals the most popular activity on the Sales and Marketing capacity was ViewReport, which signifies the viewing of a Power BI report. You then drill through to the Activity Details page to identify which reports were most frequently viewed that month on the Sales and Marketing capacity.
To drill through to the Activity Details page:
Right-click the visual element (such as Operation name) you want to drill through from.
Select Drill through.
Select Activity Details.
Activity Details page
The Activity Details page shows detailed information on specific activity scenarios. Users can access this page by drilling through from the Activity Overview or Analysis pages to display the following activity details:
Creation time - The time the activity was registered
Capacity name - The name of the capacity that the activity took place on
Capacity ID - The ID of the capacity that the activity took place on
Workspace name - The name of the workspace that the activity took place in
Workspace ID - The ID of the workspace that the activity took place in
User (UPN) - The user principal name of the user who conducted the activity
Operation - The formal name of the operation
Total of activities - The number of times the activity took place
Example
From the Analysis page, you drill through on frequently conducted ViewReport actions on the Sales and Marketing capacity in December. Using info from the Activity Details page, you discover that a new report titled "Unclosed Deals" was heavily viewed, prompting further investigation to understand the report's impact on your organization's sales strategy.
Inventory page
The Inventory page displays all items in your Fabric tenant and how they're utilized. You can filter the Inventory page by:
Item type - Including reports, dashboards, lakehouses, notebooks, and more
Workspace name - The name of the workspace where the items are located
Activity status - Indicates whether the item has been recently utilized
- Active - At least one audit log activity was generated related to the item over the last 30 days
- Inactive - No audit log activity was generated related to the item over the last 30 days
Example
The Inventory page also includes a decomposition tree visual to breakdown inventory by different factors such as capacity, user, workspace, and more. You can use the decomposition tree to decompose items by activity status; for example, displaying all inactive items by item name so that you can decide whether any of these items can be deleted.
Item Details page
The Item Details page shows information related to specific inventory usage scenarios.
Users can navigate to the Item Details page by drilling through from the Inventory page. To drill through, right-click a visual element (such as Item type) and then select the Item Details page from the Drill through menu.
After drilling through, you see the following information for the selected item types:
Capacity ID - The ID of the capacity that the item is hosted on
Workspace ID - The ID of the workspace that the item is located in
Workspace name - The name of the workspace that the item is located in
Item ID - The unique ID of the item
Item name - The display name of the item
Item type - The type of item such as report, dataset, app, and so on
Modified by - The ID of the user that last modified the item
Activity status - The status of an item whether it's active or inactive based on recent activity
Items - The total number of items
Measures
The following measures are used in visuals throughout the report and are also available in the semantic model.
Measure calculations consider filter context, so measure values change as you apply filters or interact with other visuals.
| Measure name | Description |
|---|---|
| Active capacities | The number of capacities with audit activity. |
| Active users | The number of users who have generated audit activity. |
| Active workspaces | The number of workspaces with audit activity. |
| Activities | The number of audit activities generated. |
| Items | The count of items displayed. |
| Total activities | The number of audit activities generated. Reflected as 0 when no audit data is returned; used exclusively in card visuals. |
| Total items | The count of items displayed. Reflected as 0 when no items are returned; used exclusively in card visuals. |
Considerations and limitations
This section lists the report's considerations and limitations.
Display
Condensing the zoom slider on a date trend visual to a single day displays a misleading time range, as activities are aggregated by day and not by time.
Using the next level in the hierarchy option on the Most active Capacities visual doesn't update the dynamic visual title.
Items with the same name, or items deleted and recreated with the same name, might reflect as one item in certain visuals. To count the total number of unique items, use item IDs or the Total items measure.
NA represents data that isn't available, which can happen when an audit event doesn't have complete information, or when that information isn't applicable for the event.
The report retains information for 30 days, including the activities and metadata of deleted capacities, workspaces, and other items.
Deleted workspaces with extended retention don't appear in the report after 30 days. They can be seen in the admin portal until they're permanently deleted.
Items created and deleted within a 24 hour period may have incomplete information.
Pro and Premium Per User (PPU)
Semantic models in Pro and Premium Per User (PPU) workspaces are hosted on internal logical capacities. The usage of these capacities can be seen in this report.
Pro - Appear as Reserved Capacity for Pro Workspaces with the capacity SKU value Pro.
PPU - Appear as Reserved Capacity for Premium Per User Workspaces with the capacity SKU value PPU.
Counting logic
- All My workspaces are counted as separate records as part of the Active workspaces measure.