How to investigate Microsoft Entra Health monitoring alerts (preview)
Microsoft Entra Health monitoring helps you monitor the health of your Microsoft Entra tenant through a set of health metrics and intelligent alerts. Health metrics are fed into our anomaly detection service, which uses machine learning to understand the patterns for your tenant. When the anomaly detection service identifies a significant change in one of the tenant-level patterns, it triggers an alert.
The signals and alerts provided by Microsoft Entra Health provide you with the starting point for investigating potential issues in your tenant. Because there's a wide range of scenarios and even more data points to consider, it's important to understand how to investigate these alerts effectively. This article provides guidance on how to investigate alerts, in general. For scenario-specific guidance, see the related content at the end of this article.
Important
Microsoft Entra Health scenario monitoring and alerts are currently in PREVIEW. This information relates to a prerelease product that might be substantially modified before release. Microsoft makes no warranties, expressed or implied, with respect to the information provided here. The Microsoft Entra admin center experience is being released to customers in phases, so you might not see all the features described in this article.
Prerequisites
There are different roles, permissions, and license requirements to view health monitoring signals and configure and receive alerts. We recommend using a role with least privilege access to align with the Zero Trust guidance.
- A tenant with a Microsoft Entra P1 or P2 license is required to view the Microsoft Entra health scenario monitoring signals.
- A tenant with both a non-trial Microsoft Entra P1 or P2 license and at least 100 monthly active users is required to view alerts and receive alert notifications.
- The Reports Reader role is the least privileged role required to view scenario monitoring signals, alerts, and alert configurations.
- The Helpdesk Administrator is the least privileged role required to update alerts and update alert notification configurations.
- The
HealthMonitoringAlert.Read.Allpermission is required to view the alerts using the Microsoft Graph API. - The
HealthMonitoringAlert.ReadWrite.Allpermission is required to view and modify the alerts using the Microsoft Graph API. - For a full list of roles, see Least privileged role by task.
Note
Newly onboarded tenants might not have enough data to generate alerts for about 30 days.
Investigate the signals and alerts
You can view the Microsoft Entra Health monitoring signals from the Microsoft Entra admin center. You can also view the properties of the signals and the public preview of health monitoring alerts, using Microsoft Graph APIs.
When you receive an alert, you typically need to investigate the following data sets:
- Metrics: The data stream, or health signal, that caused the alert.
- Affected entities: Total number of affected entities. Could include users and applications.
- Activity logs: Sign-in logs provide details around affected users. Audit logs provide insights into application configuration changes.
- Scenario-specific resources: Depending on the scenario, you might need to investigate other sources of information from different services. For example, for device-related scenarios, you might need to review Intune device compliance policies.
The signals and alerts are available in the Microsoft Entra Health area of the Microsoft Entra admin center. Whether you're investigating an alert or just monitoring the health of your tenant, you can view the signals and alerts from the Microsoft Entra admin center.
View the signals
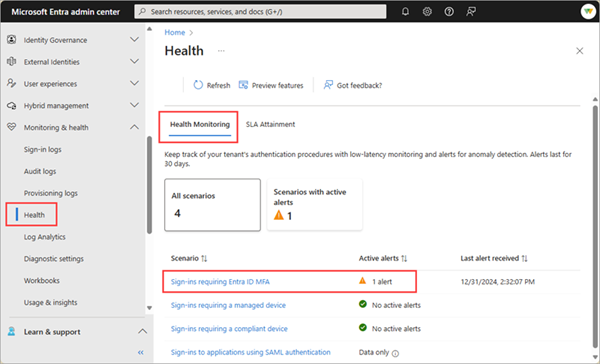
Sign into the Microsoft Entra admin center as at least a Reports Reader.
Browse to Identity > Monitoring and health > Health. The page opens to the Service Level Agreement (SLA) Attainment page.
Select the Health Monitoring tab.
Select a scenario from the list. The page opens to the scenarios with active alerts, but if you want to view the signals for a different scenario, select the All scenarios filter button.
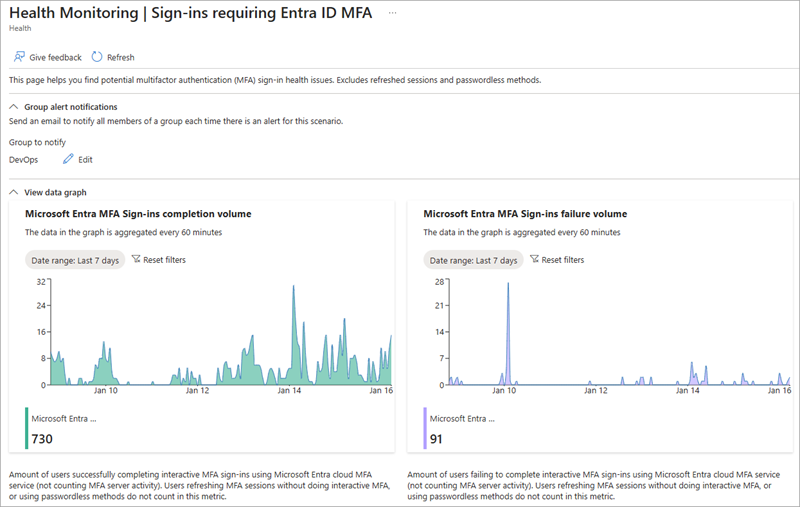
View the signal in the View data graph section. You might need to expand this section if you're viewing a scenario with an active alert.
- The date range can be changed to view the last 24 hours, seven days, or previous month.
- Hover your mouse over the graph to see the data points for a particular point in time.
- The value at the bottom of the graph is the total count for that scenario for the selected time frame.
Investigate the alerts
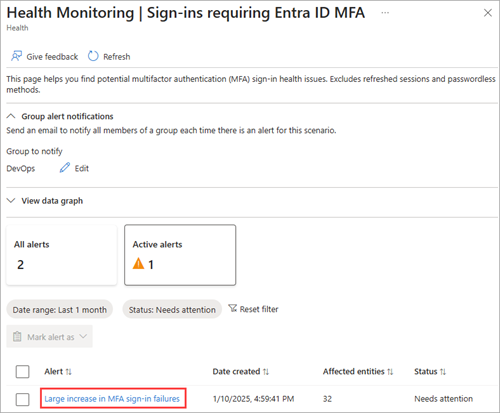
To view these details from the Health monitoring landing page:
Select the active alert you want to investigate.
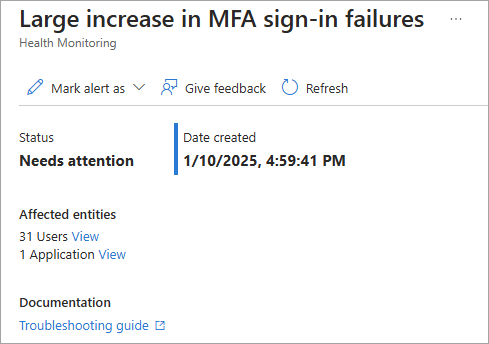
From the Affected entities section of the selected scenario, select View for the type of affected entity you want to investigate.
- Possible entities include users and applications.
- A link is provided to a scenario-specific article for more information on how to investigate the issue.
From the details that appear in the panel that opens, select an entity to explore further.
- The top 10 most affected entities appear.
- Selecting an item from the list navigates you to the user or application's profile page for further investigation.
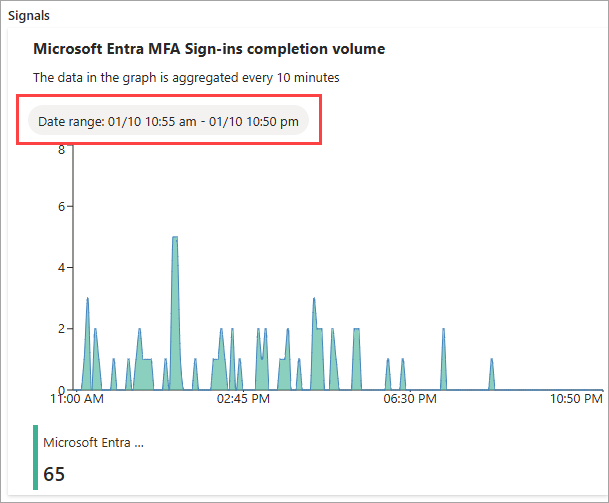
The signal for the alert appears under the Signals section. Review the signal to understand the pattern and identify anomalies.
- The time frame shows the time during which the anomaly occurred.
After investigating and potentially resolving the root cause of the issue, you can dismiss the alert. From the active alert page, select the checkbox for that alert then select the Mark alert as menu and select Dismissed.
- The equivalent action using the Microsoft Graph API is to update the alert status to
resolved.
- The equivalent action using the Microsoft Graph API is to update the alert status to
