(Preview) Configure Azure Site Recovery reports
Azure Site Recovery provides a reporting solution for Backup and Disaster Recovery admins to gain insights on long-term data. This includes:
- Allocating and forecasting of cloud storage consumed.
- Auditing backups and restores.
- Identifying key trends at different levels of detail.
Like Azure Backup, Azure Site Recovery offers a reporting solution that uses Azure Monitor logs and Azure workbooks. These resources help you gain insights on your estate that are protected with Site Recovery.
This article shows how to set up and view Azure Site Recovery reports.
Supported scenarios
Azure Site Recovery reports are supported for the following scenarios:
- Site Recovery jobs and Site Recovery replicated items.
- Azure virtual machine replication to Azure, Hyper-V replication to Azure, VMware replication to Azure – Classic & Modernized.
Configure reports
To start using Azure Site Recovery reports, follow these steps:
Create a Log Analytics workspace or use an existing workspace
Set up one or more Log Analytics workspaces to store your Backup reporting data. The location and subscription of this Log Analytics workspace can be different from where your vaults are located or subscribed.
To set up a Log Analytics workspace, follow these steps. The data in a Log Analytics workspace is kept for 30 days by default. If you want to see data for a longer time span, change the retention period of the Log Analytics workspace. To change the retention period, see Configure data retention and archive policies in Azure Monitor Logs.
Configure diagnostics settings for your vaults
Azure Resource Manager resources, like Recovery Services vaults, record information about site recovery jobs and replicated items as diagnostics data.
To learn how to configure diagnostics settings, see Diagnostic settings in Azure Monitor.
You can also configure diagnostics settings for your vaults using the following steps in the Azure portal.
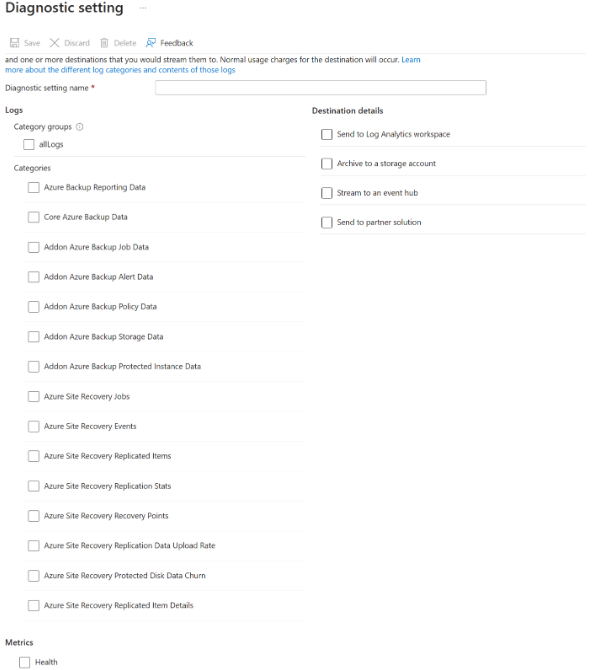
Navigate to the chosen the Recovery Services vault, then select Monitoring > Diagnostic settings.
Specify the target for the Recovery Services Vault's diagnostic data. Learn more about using diagnostic events for Recovery Services vaults.
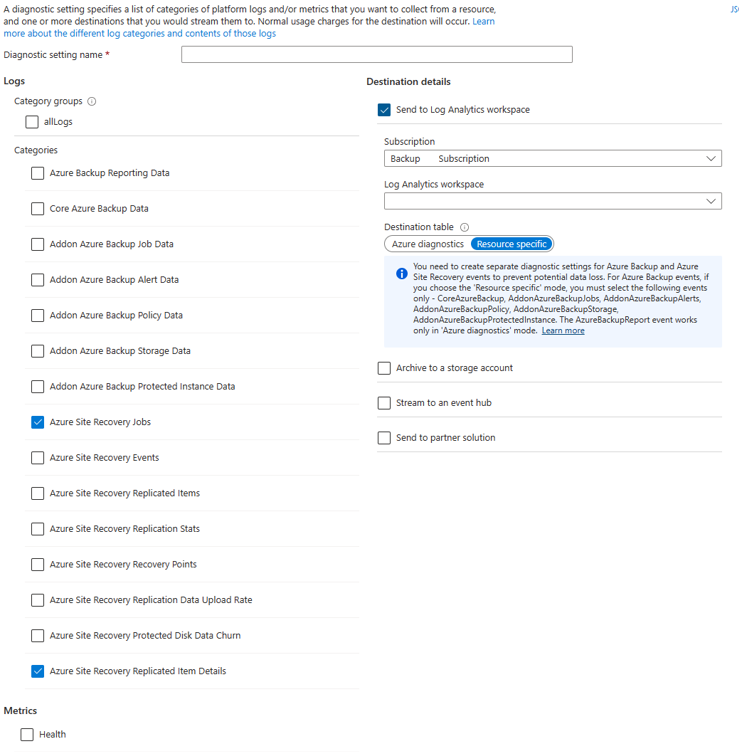
Select Azure Site Recovery Jobs and Azure Site Recovery Replicated Item Details, and on the Destination table Resource Specific options to populate the reports.

Note
After diagnostics configuration, it takes up to 24 hours for the initial data push to complete. After the data starts flowing into the Log Analytics workspace, you might not see the data in the reports immediately since the data for the current partial day isn't shown in the reports.
For more information, see the conventions. We recommend that you start viewing the reports two days after you configure your vaults to send data to Log Analytics.
Currently, Azure Site Recovery doesn't provide a built-in Azure policy definition that automates the configuration of diagnostics settings for all Recovery Services vaults in a given scope.
View reports in Business Continuity Center
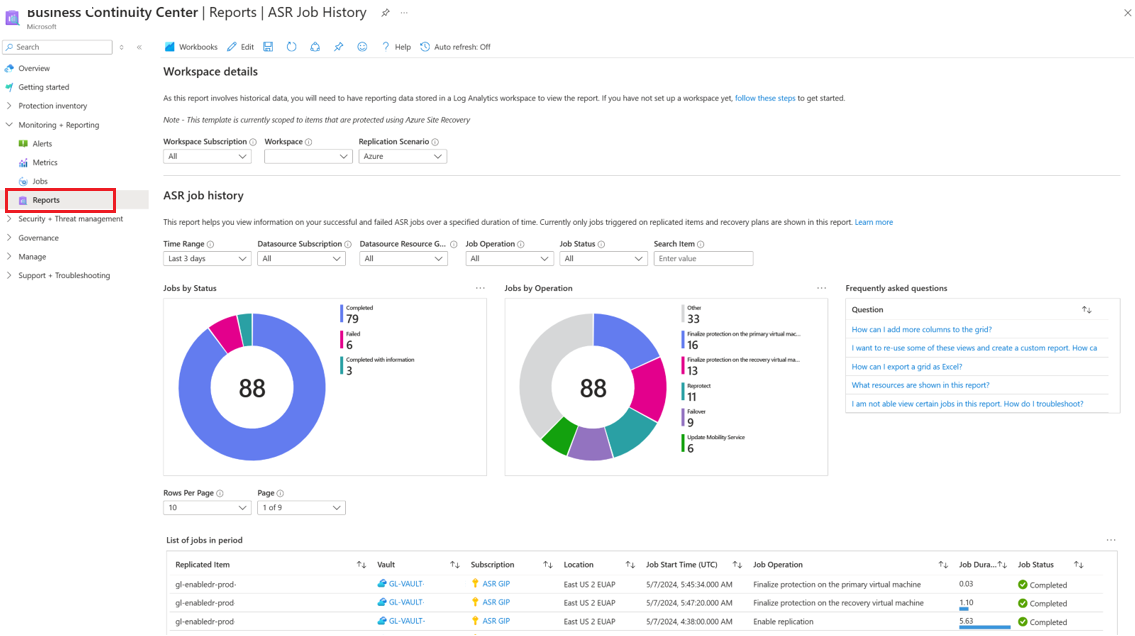
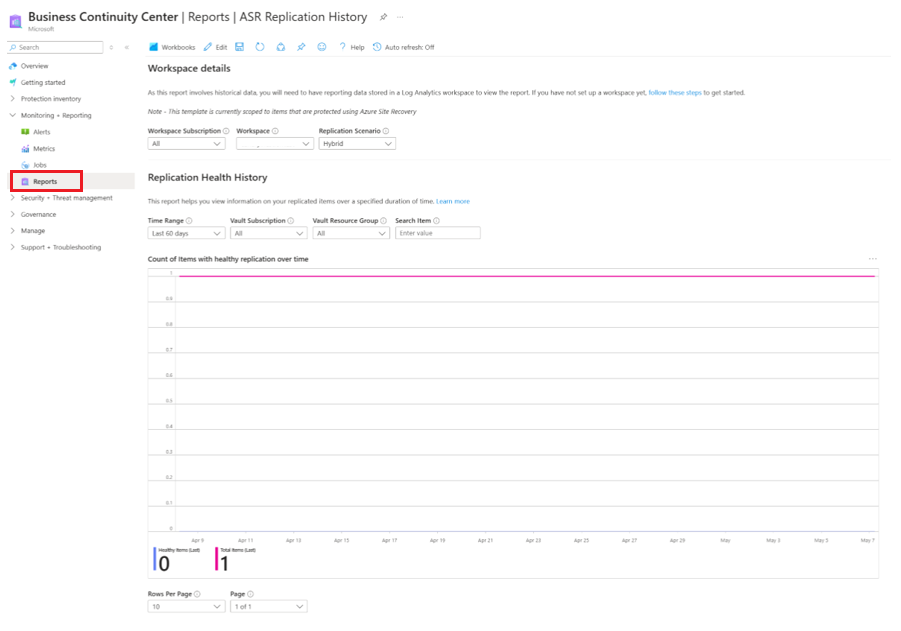
To view your reports after setting up your vault to transfer data to Log Analytics workspace, go to the Business Continuity Center > Monitoring+Reporting > Reports.
You must select one or more workspace subscriptions, one or more log analytics workspaces, and the replication scenario of your choice, before you can see the report with information.
Following are some of the reports available in the Business Continuity Center:
Azure Site Recovery Job History
This report provides information about the Site Recovery jobs by operation type and completion status. This report includes information on job status, start time, duration, vault, subscription, etc.
It also offers multiple filters for time range, operation, resource group, status, and search item, enabling you to generate focused reports and visualizations.
Azure Site Recovery Replication History
This report provides information about the Site Recovery replicated items and their status over a specified time period. This report also includes failover date and detailed replication health error list for troubleshooting. It offers filters for time range, vault subscription, resource group, and search item and enables focused report generation and visualization.
Export to Excel
Select the down arrow button at the top of any widget, for example, a table or chart, to export the contents of that widget as an Excel sheet with existing filters applied. To export more rows of a table to Excel, you can increase the number of rows displayed on the page by adjusting Rows Per Page option at the top of each widget.
Pin to dashboard
To pin the widget to your Azure portal dashboard, select the pin button at the top of each widget. This feature helps you create customized dashboards tailored to display the most important information that you need.
Cross-tenant reports
If you use Azure Lighthouse with delegated access to subscriptions across multiple tenant environments, you can access the default subscription filter by selecting the filter button in the top corner of the Azure portal to choose all the subscriptions you wish to view data for. This enables the selection of Log Analytics workspaces across your tenants for viewing multi-tenanted reports.
Conventions used in Site Recovery reports
The reports do not display data for the current partial day. If you set the Time range to Last 7 days, the report shows records for the last seven completed days, excluding the current day. The report provides information on jobs that were triggered within the selected time range.
Troubleshoot
If you don't see data in the reports or see any discrepancy, check the following:
- Ensure that all vaults are sending the required configurations to the Log Analytics workspace.
- Ensure that you've selected correct filters in the reports.
- Note that, since it takes up to 24 hours for the initial data push to complete while configuring diagnostics settings, you might not see the data in the reports immediately.
- The reports only take full days (UTC) into consideration and don't include partial days. Consider these examples:
- If you select a time range from 4:30 PM on March 23 to 10:00 AM on March 24th, the query runs internally for the period between 12:00 AM UTC on March 23 and 11:59 PM UTC on March 24th. This means that the query overrides the time component of the datetime.
- If today's date is March 29, the data shown in the reports will only go up to the end of March 28 (11:59 PM UTC). Jobs created on March 29 won't be visible in the reports until the next day, March 30.
If none of the above explains the data seen in the report, contact Microsoft Support.
Power BI reports
The Power BI template app for reporting, which sources data from an Azure storage account, is being deprecated. We recommend, that you begin sending vault diagnostic data to Log Analytics to view reports instead.
Additionally, the V1 schema for sending diagnostics data to a storage account or an LA Workspace is also being deprecated. If you have created any custom queries or automations using the V1 schema, it is recommended that you update them to use the currently supported V2 schema.
Send Azure Site Recovery events to Log Analytics
Azure Backup and Azure Site Recovery events are sent from the same Recovery Services vault. Azure Site Recovery offers two resource-specific tables - Azure Site Recovery Jobs and Azure Site Recovery Replicated Items Details. Users must choose resource specific for the two tables mentioned. Choosing the resource-specific mode for Azure Site Recovery events for any other table for site recovery prevents the required data from being sent to the Log Analytics workspace. Azure Site Recovery Jobs is available as both resource specific and legacy table.

Note
When you create a Log Analytics workspace, it does not matter if the Recovery Services vault is located in a different region.
To summarize:
- If you already have Log Analytics diagnostics set up with Azure Diagnostics and have written custom queries on top of it, keep that setting intact until you migrate your queries to use data from the new events.
- If you also want to onboard onto new tables, as we recommend, create a new diagnostics setting, select Resource specific, and select the six new events.
- If you're currently sending Azure Site Recovery events to Log Analytics, do not choose the resource-specific mode for these events. Otherwise, data for these events won't flow into your Log Analytics workspace. Instead, create an additional diagnostic setting, select Azure diagnostics, and select the relevant Azure Site Recovery events.
The following image shows an example of a user who has three diagnostics settings for a vault. The first setting, named Setting1, sends data from an Azure Backup Reporting Data event to a Log Analytics workspace in Azure diagnostics mode. The second setting, named Setting2, sends data from the six new Azure Backup events to a Log Analytics workspace in the resource-specific mode. The third setting, named Setting3, sends data from the Azure Site Recovery events to a Log Analytics workspace in Azure diagnostics mode.


