Voice and video Insights
This document introduces the Voice and Video section of your Insights dashboard and how to use Copilot in Azure to monitor and improve your call quality.
Overview
In each Communications Resource, we provide an Insights feature that acts as a dashboard for all your calls in that resource. The Voice and Video section of the dashboard gives high level summaries of your call usage, reliability, and quality for that calling resource.
This dashboard is integrated with Copilot in Azure, allowing you to chat with Copilot to quickly understand the data you’re looking at and learn actions to improve your users' calling experiences.
There are two main tools you can use to monitor your calls and improve call quality.
- Voice and Video Insights dashboards
- Call Diagnostics
We recommend using Copilot in the Voice and Video Insights dashboards to start any quality investigations, and using Copilot in Call Diagnostics as needed to explore individual calls when you need granular detail.
Voice and Video Insights consists of four main sections.
- Volume: Provides general usage numbers.
- Reliability: Aggregates key calling API scenarios and error codes.
- User Facing Diagnostics (UFD): Summarizes events that can affect user call experiences.
- Quality: Provides key media stream measurements.
Enable Voice and Video Insights
You need to start storing call logs and enable Copilot in Azure to start using the Voice and Video Insights dashboards.
Important
You must collect logs to use the dashboard. To enable Voice and Video Insights see: How do I set up Voice and Video Insights?
Azure doesn't store your call log data unless you enable these specific Diagnostic Settings. Your call data is not retroactively available. You accumulate data once you set up the Diagnostic Settings.
Accessing Voice and Video Insights
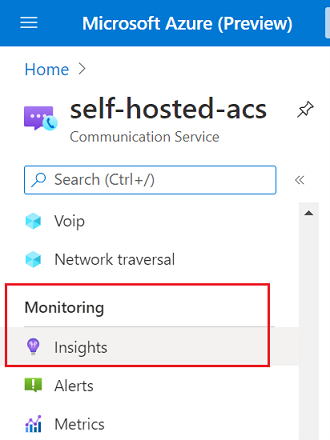
Inside your Azure Communication Services resource, scroll down on the left navigation bar to the Monitor category and select the Insights tab:
Volume
The Volume tab plots key usage metrics, such as call and participant volume, you can use the filters to focus your reviews and time frames. You can use Copilot to get detailed explanations of key concepts at the bottom of this section.
This tab focuses on the composition and volume of your calls over time. You can see average call duration in a period or focus on top users by average call duration. We provide more information with breakdowns by SDK version, Teams interoperability, participant types, call type, endpoint type, and OS version.
Reliability
The Reliability tab summarizes the performance of key calling SDK APIs to help you focus on the lowest performing areas. The default view shows a trend of all the APIs to give you an overview of your reliability. You can get more details by selecting a single API scenario to focus on. When you choose a single API scenario the dashboard visuals update to show a detailed breakdown of that API.
User Facing Diagnostics (UFD)
The User Facing Diagnostic (UFD) tab opens with a summary of the top UFD events and highlights the recovery rate of each UFD for you to focus on. Like the Reliability tab, you see an overview of all the UFDs first, once you select an individual UFD you see further drill-down insights.
We recommend prioritizing improvements on a UFD that has a low recovery rate and a high volume, which can indicate the best opportunity to improve your user's call experiences. For example, the calling SDK might recover from some in call events and the user might not perceive an issue. By focusing on the poorest performing areas you can help identify root causes.
How do you interpret UFDs?
During calls, the calling SDK might trigger events called User Facing Diagnostics (UFDs), these UFD events indicate a user may have perceived a poor call experience for various reasons. For example, their video freezes and their network quality drops in the middle of a call. Since UFDs are symptomatic by nature and are triggered based on broad quantitative criteria, there can be various root causes that trigger a UFD event. Additionally, a UFD can be triggered but the user might not perceive an issue during a call because the calling SDK was able to mitigate any potential issue. In contrast, the reliability tab attempts to provide more concrete error code and subcode information for your analysis.
Quality
The Quality tab under Voice and video allows users to inspect the quality distribution of calls, where quality is defined at three levels for this dashboard:
The proportion of poor-quality media streams (Stream quality plot), where a stream’s quality is classified as Poor when it has at least one unhealthy value, unhealthy ranges are defined as:
- Jitter > 30 milliseconds
- Packet loss rate > 10%
- Round trip time > 500 milliseconds
The proportion of Impacted calls, where an impacted call is defined as a call that has at least one poor quality stream
Participant end reasons, which keep track of the reason why a participant left a call. End reasons are documented in our Call Codes documentation, which are numeric codes that describe the specific status of an operation. Call Codes can be grouped into six categories: Success, Client Failure, Server Failure, Global Failure, Redirection, and Provisional. The distribution of Call Codes is shown in the pie chart on the left hand side, while a list of the specific codes for participant end reasons is provided on the right hand side.
Quality can also be filtered by the types of media streams (Media Type parameter) used in the call, for example, to only get the impacted calls in terms of video stream quality:
And can also be filtered by endpoint types (Endpoint Type parameter), for example, getting the participant end reasons for PSTN participants. These filters allow for multiple selections:
More information about workbooks
For an in-depth description of workbooks, refer to the Azure Monitor Workbooks documentation.
Editing dashboards
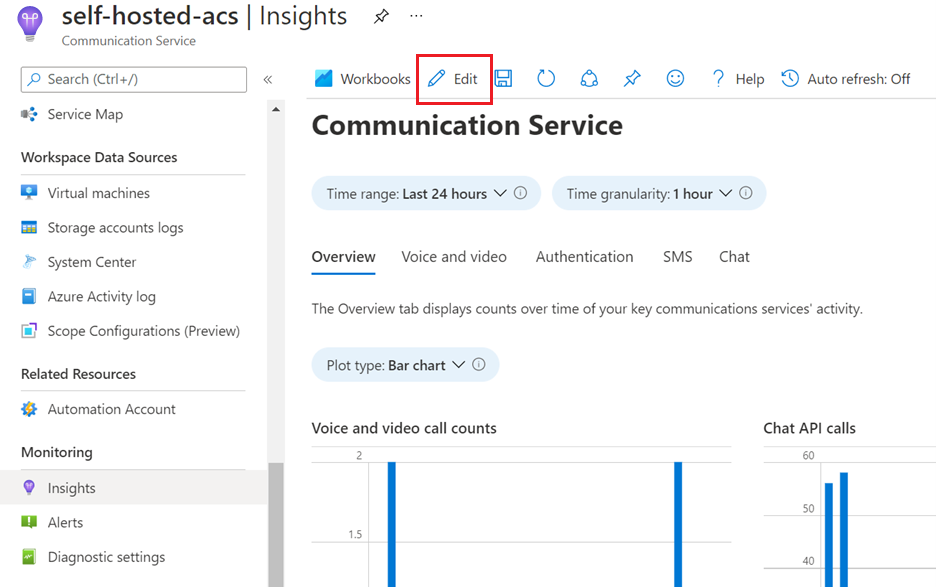
The Insights dashboards we provide can be customized to better suit your needs by clicking on the Edit button on the top navigation bar:
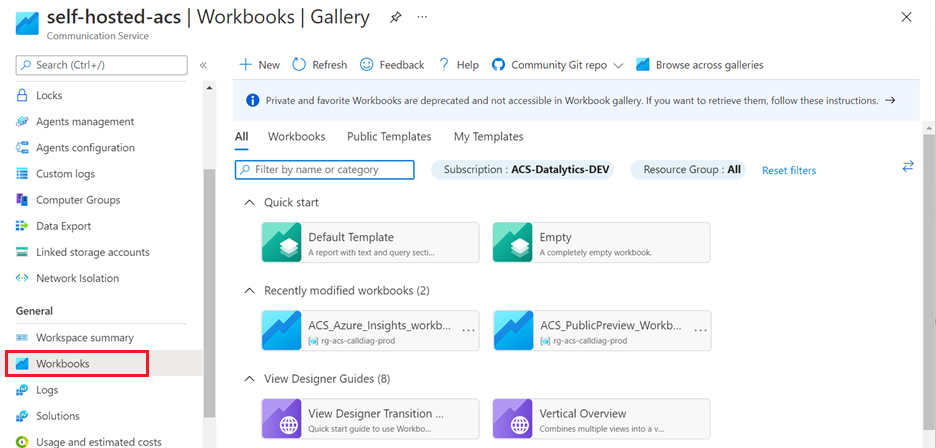
Editing these dashboards creates a separate workbook that can be accessed from your resource’s Workbooks tab:
For an in-depth description of workbooks, refer to the Azure Monitor Workbooks documentation.
Frequently asked questions
How do I set up Voice and Video Insights?
Since the Voice and Video insights dashboard is integrated with Copilot in Azure and powered by Azure Monitor Workbooks, you need to store call logs for it to visualize anything. Also you must enable Copilot in Azure. The following sections explain these two requirements.
Collect Call Logs
The Insights Dashboards uses Azure Monitor Workbooks which displays call log data from Azure Communication Services. These call logs aren't stored in your Azure account by default so you need to begin storing them for the dashboard to work. To collect these call logs, you need to enable a diagnostic setting that directs the call data to a Log Analytics workspace.
Data isn’t stored retroactively, so you begin capturing call logs only after configuring the diagnostic setting.
Follow instructions to add diagnostic settings for your resource in Enable logs via Diagnostic Settings in Azure Monitor. We recommend that you initially collect all logs. When you add your diagnostic setting, you're prompted to select logs. To collect all logs, select allLogs.
Your data volume, retention, and usage in Log Analytics within Azure Monitor is billed through existing Azure data meters. We recommend that you monitor your data usage and retention policies for cost considerations as needed. For more information, see Controlling costs.
If you have multiple Azure Communications Services resource IDs, you must enable these settings for each resource ID. When you view Voice and Video Insights, it shows you details for the resourceID you're viewing.
Enable Copilot in Azure
Your organization manages access to Copilot in Azure. After your organization has access to Copilot in Azure, the Voice and Video Insights sections will display multiple Copilot icons you can interact with.
Interact with Copilot in Azure for quality improvement guidance and explanations of common terms. Giving Copilot in Azure detailed information helps it identify fixes. If you want, you can use the visuals without Copilot in a limited capacity.
Can I use the legacy version of Voice and Video Insights?
You can find the legacy version of Voice and Video Insights inside your Azure Communication Services resource tab:
Next steps
- Learn about Call Diagnostics: Call Diagnostics
- Learn how to manage call quality: Improve and manage call quality.
- Explore troubleshooting guidance: Overview of audio issues.
- Learn about other quality best practices: Best practices: Azure Communication Services calling SDKs.
- Learn how to use the Log Analytics workspace: Log Analytics tutorial.
- Create your own queries in Log Analytics: Get started with log queries in Azure Monitor.
- Explore known call issues: Known issues in the SDKs and APIs.