How to benchmark models in Azure AI Foundry portal
Important
Items marked (preview) in this article are currently in public preview. This preview is provided without a service-level agreement, and we don't recommend it for production workloads. Certain features might not be supported or might have constrained capabilities. For more information, see Supplemental Terms of Use for Microsoft Azure Previews.
In this article, you learn to compare benchmarks across models and datasets, using the model benchmarks tool in Azure AI Foundry portal. You also learn to analyze benchmarking results and to perform benchmarking with your data. Benchmarking can help you make informed decisions about which models meet the requirements for your particular use case or application.
Prerequisites
An Azure subscription with a valid payment method. Free or trial Azure subscriptions won't work. If you don't have an Azure subscription, create a paid Azure account to begin.
Access model benchmarks through the model catalog
Azure AI supports model benchmarking for select models that are popular and most frequently used. Follow these steps to use detailed benchmarking results to compare and select models directly from the Azure AI Foundry model catalog:
- Sign in to Azure AI Foundry.
- If you’re not already in your project, select it.
- Select Model catalog from the left navigation pane.
Select the model you're interested in. For example, select gpt-4o. This action opens the model's overview page.
Tip
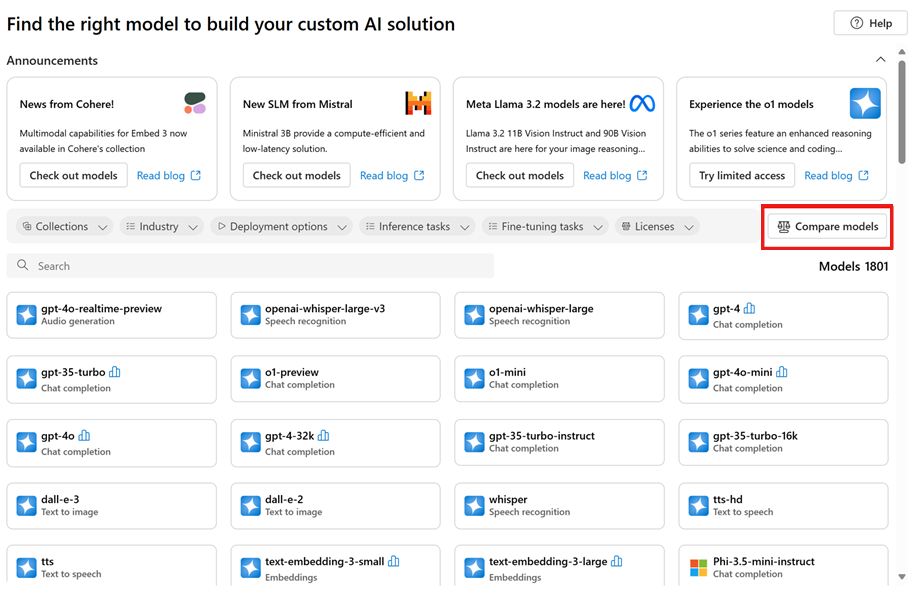
From the model catalog, you can show the models that have benchmarking available by using the Collections filter and selecting Benchmark results. These models have a benchmarks icon that looks like a histogram.
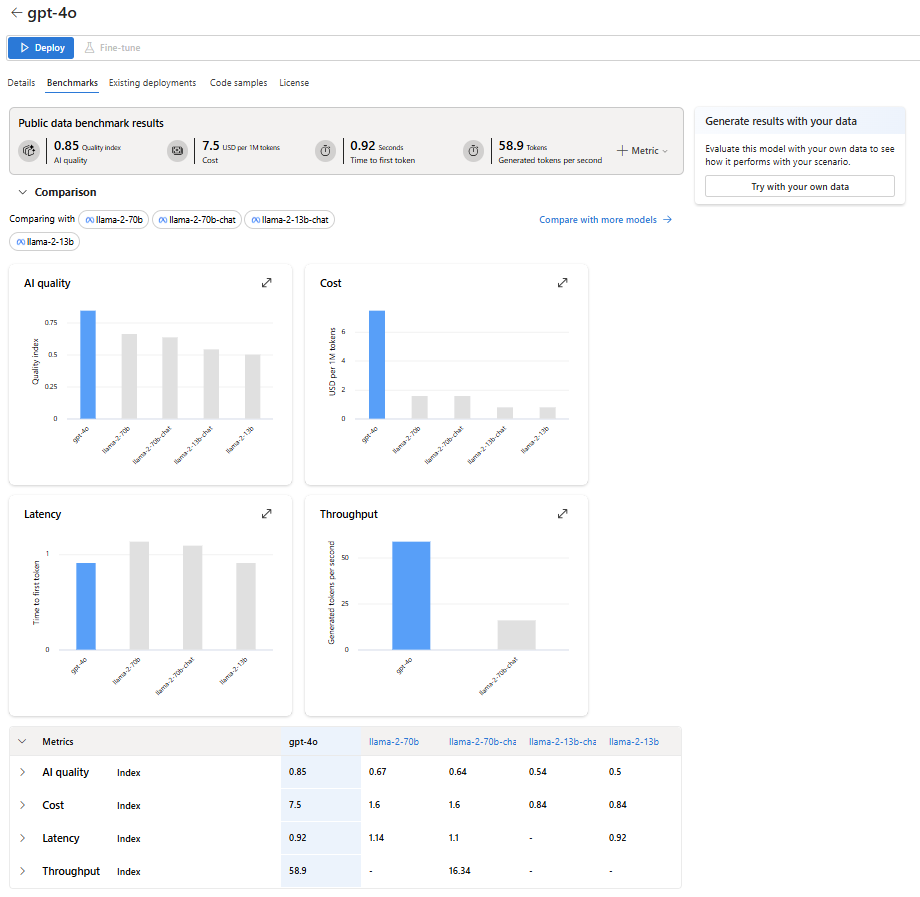
Go to the Benchmarks tab to check the benchmark results for the model.
Return to the homepage of the model catalog.
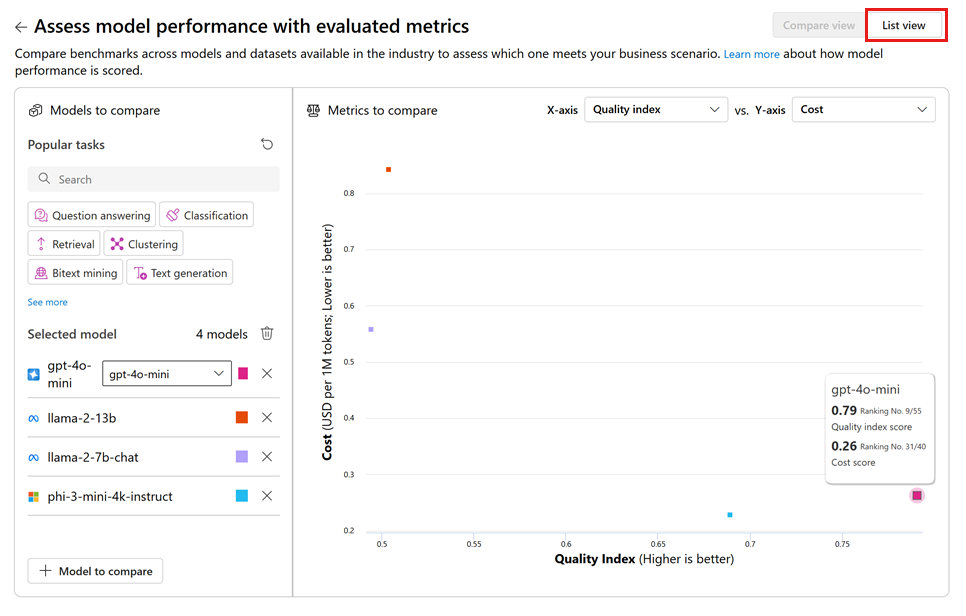
Select Compare models on the model catalog's homepage to explore models with benchmark support, view their metrics, and analyze the trade-offs among different models. This analysis can inform your selection of the model that best fits your requirements.
Select your desired tasks and specify the dimensions of interest, such as AI Quality versus Cost, to evaluate the trade-offs among different models.
You can switch to the List view to access more detailed results for each model.
Analyze benchmark results
When you're in the "Benchmarks" tab for a specific model, you can gather extensive information to better understand and interpret the benchmark results, including:
High-level aggregate scores: These scores for AI quality, cost, latency, and throughput provide a quick overview of the model's performance.
Comparative charts: These charts display the model's relative position compared to related models.
Metric comparison table: This table presents detailed results for each metric.
By default, Azure AI Foundry displays an average index across various metrics and datasets to provide a high-level overview of model performance.
To access benchmark results for a specific metric and dataset:
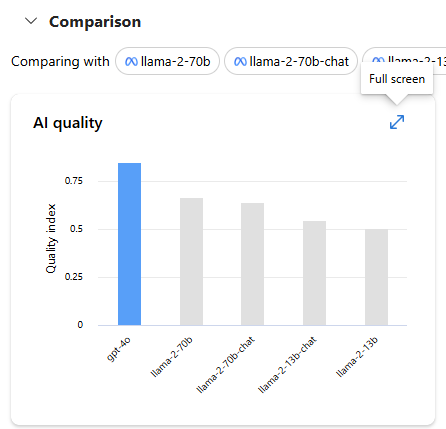
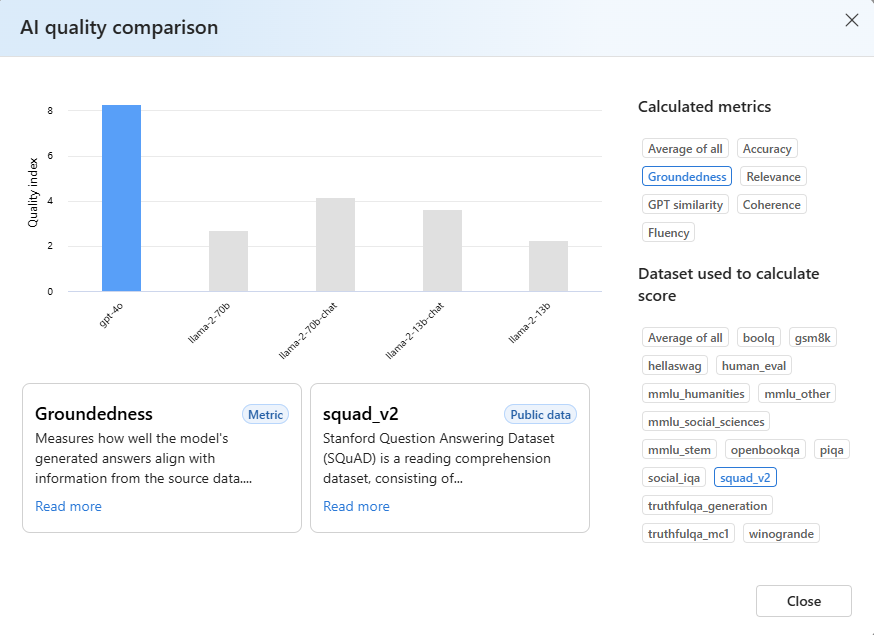
Select the expand button on the chart. The pop-up comparison chart reveals detailed information and offers greater flexibility for comparison.
Select the metric of interest and choose different datasets, based on your specific scenario. For more detailed definitions of the metrics and descriptions of the public datasets used to calculate results, select Read more.
Evaluate benchmark results with your data
The previous sections showed the benchmark results calculated by Microsoft, using public datasets. However, you can try to regenerate the same set of metrics with your data.
Return to the Benchmarks tab in the model card.
Select Try with your own data to evaluate the model with your data. Evaluation on your data helps you see how the model performs in your particular scenarios.

