Customize KPIs for intraday insights
Note
Intraday insights reports for Omnichannel for Customer Service are deprecated as of May 1, 2023. We recommend that you use real-time analytics reports, our latest analytics capability, which provide real-time information about the health and key performance indicators of your organization. For more information on the deprecation, go to Intraday insights for Omnichannel for customer service are deprecated.
To cater to your organizational needs, intraday insights allows you to customize KPIs. This allows supervisors to adapt to your organizational parameters that are designed for your organization. Through the Power BI desktop application, you can customize these KPIs.
Note
Do not customize out-of-the-box reports because they will be overwritten when new versions are made available by Microsoft. However, if you do customize them, save them with another name.
The customization of KPIs includes:
Review prerequisites
Verify the following prerequisites before you add the custom KPIs:
Power BI desktop app is installed on your computer.
Administrator or equivalent role is assigned to you.
Intraday insights dashboard is configured for your organization. To Learn more, see Configure to view intraday insights dashboard
Add custom KPIs
You can add the custom KPIs that are specific to your organization to intraday insights. This allows intraday insights to be more specific and helps supervisors adhere your organizational requirements. To add custom KPIs, follow these steps:
Open the Power BI desktop application and sign in with your administrator credentials.
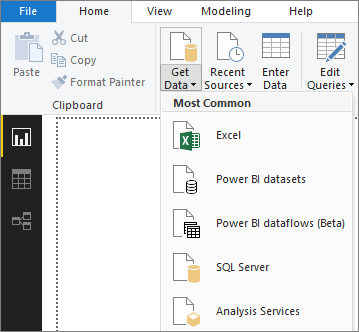
From the Home menu, select Get Data > Power BI datasets.

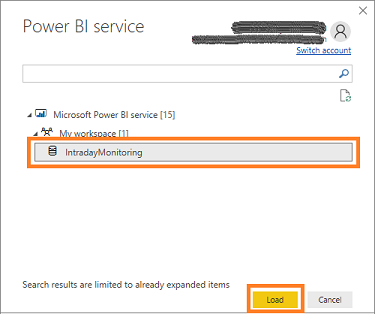
The dataset selection dialog box opens.
Select IntradayMonitoring from the workspace that you've created through configuration, and then select Load.

The fields related to intraday insights are loaded.
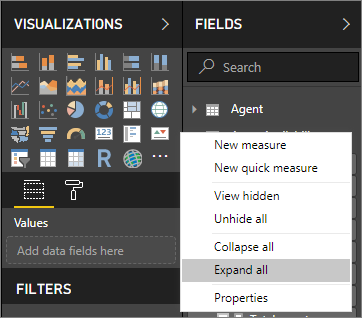
From the field category list, select a category to create a measure and then select More options (...) > New measure.
In this example, we're creating a measure for the field category AgentAvailability.

A new measure is created for the field.
The formula bar appears along the top of the Report canvas, where you can rename your measure and enter a DAX formula.
In this example, we're adding a measure for calculating the total number hours that an agent is working on a work item.
Total agent work hours = Agent[Average Session Handling Time] + Agent[Average Conversations Per Online Agents]The measure is added.
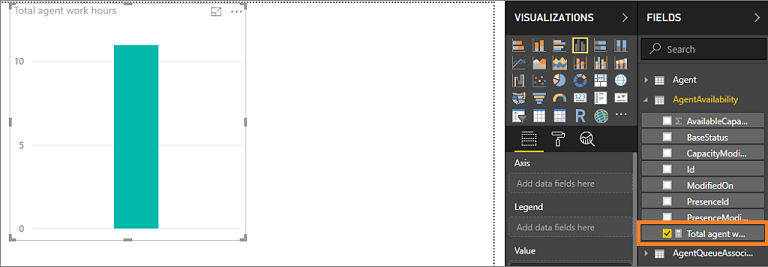
Select the measure and verify that the measure is working as defined.

To learn more about creating measure, see Create a measures.
Add the measure to your report. To learn more, see Use your measure in the report.
Publish the report.
The custom KPI measure is added to the intraday insights dashboard.
To learn more about how to create custom measures, see Tutorial: Create your own measures in Power BI Desktop.
Edit measures and visuals of existing KPIs
You can edit the measures and visuals of existing custom and out-of-the-box KPIs to match your organizational requirements. This helps in reducing the effort of adding a new KPI to the intraday insights. To edit measures of existing KPIs, follow these steps:
Open the Power BI desktop application and sign in with your administrator credentials.
From the Home menu, select Get Data > Power BI datasets.

The dataset selection dialog box opens.
Select IntradayMonitoring from the workspace that you've created through configuration, and then select Load.

The fields related to intraday insights are loaded.
To edit a measure:
From the field category list, select a category and then select the field for which you want to change the measure.
Note
Fields with measures are preceded with a calculator icon.
In this example we're selecting Total agent work hours field from AgentAvailability category. The details of for the field is displayed including its formula bar.

From the formula bar, edit the formula as required.
To learn more about change visualizations, see Create and use your own measures.
To edit a visual:
From the field category list, select a category and then select the field for which you want to change the visual.
In this example we're selecting Agent Handling Time field from Session category. The visual for the field is displayed.

From the VISUALIZATIONS tab, edit the visualizations of the field as required. In this example, we're changing the chart to a pie chart.

To learn more about change visualizations, see Add visualizations to a Power BI report.
Publish the report.
Reference
The tables in the intraday insights dataset consists of entity attributes along with measures and calculated columns. The following are the list of entity that is supported in Intraday insights:
Agent. To learn more about entity attributes for agent, see SystemUser entity.
AgentAvailability. To learn more about entity attributes for agent availability, see SystemUser entity and msdyn_presence.
AgentQueueAssociation. To learn more about entity attributes for agent queue association, see SystemUser entity and Queue Entity.
AgentRoleAssociation. To learn more about entity attributes for agent role association, see SystemUser entity and role EntityType.
Presence. To learn more about entity attributes for presence, see msdyn_presence Entity Reference - Writable attributes.
Queue. To learn more about entity attributes for queue, see Queue Entity.
RoleBase. To learn more about entity attributes for role base, see role EntityType.
Session. To learn more about entity attributes for session, see msdyn_ocsession Entity Reference.
SessionParticipant. To learn more about entity attributes for session participant, see msdyn_sessionparticipant Entity Reference.
WorkItem. To learn more about entity attributes for work item, see msdyn_ocliveworkitem Entity Reference.
WorkStream. To learn more about entity attributes for work stream, see msdyn_liveworkstream Entity Reference.