Use Allocation instrumentation on timeline ("Allocations on timeline" profiling type)
In the Memory tool, use the Allocations on timeline profiling type to find objects that aren't being properly garbage-collected, and continue to retain memory.
How Allocation instrumentation on timeline works
The Memory tool's Allocations on timeline profiling type combines the detailed snapshot information of the heap profiler with the incremental updating and tracking of the Performance tool. Similarly, tracking heap allocation for objects involves starting a recording, performing a sequence of actions, and stopping the recording for analysis.
Allocations on timeline takes heap snapshots periodically throughout the recording (as frequently as every 50 ms) and one final snapshot at the end of the recording.
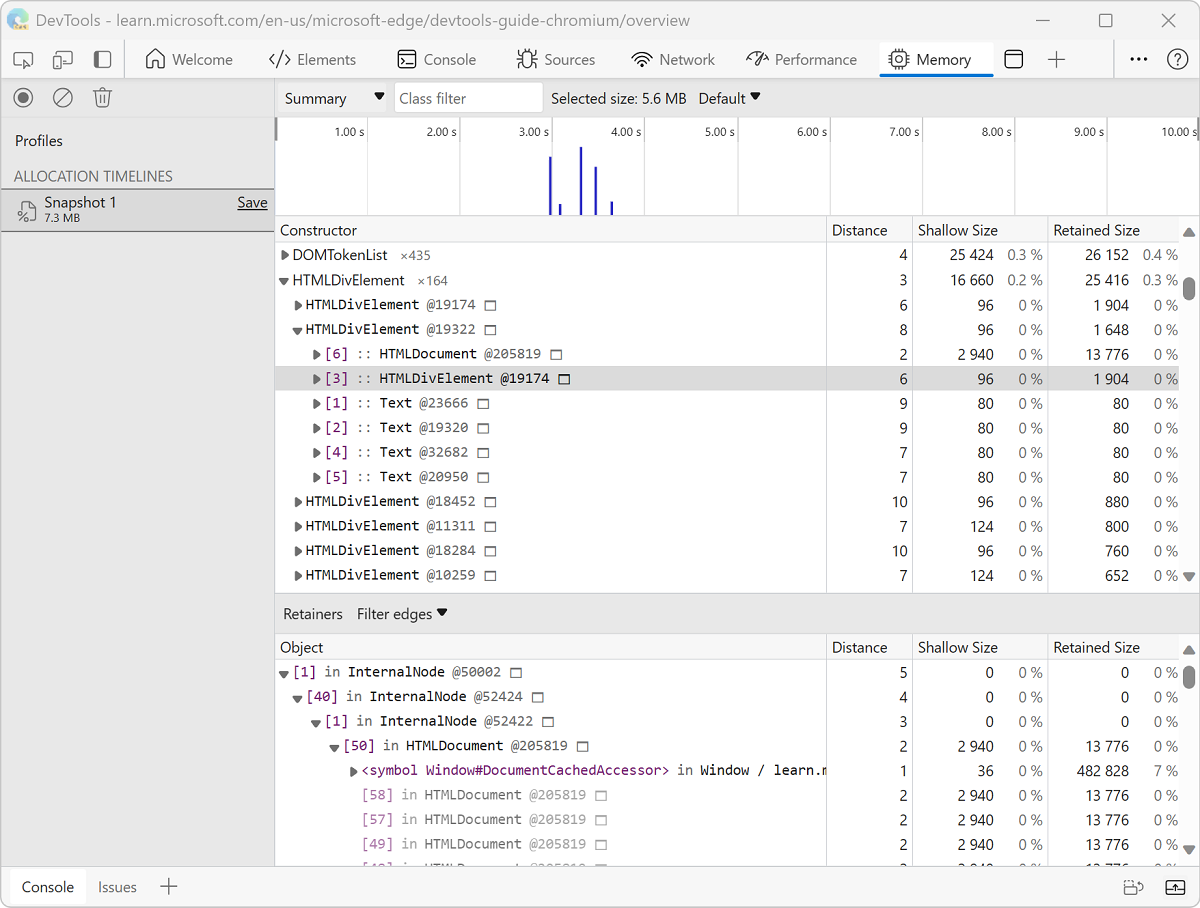
The number after the @ is an object ID that persists across the multiple snapshots taken during the recording session. The persistent object ID enables precise comparison between heap states. Objects are moved during garbage collections, so displaying the address of an object makes no sense.
Enable Allocation Instrumentation on Timeline
To begin using Allocations on timeline:
Open a webpage, such as the Detached Elements demo webpage, in a new window or tab.
Right-click the webpage, and then select Inspect. Or, press Ctrl+Shift+I (Windows, Linux) or Command+Option+I (macOS).
DevTools opens.
In DevTools, in the Activity Bar, select the Memory (
 ) tool.
If that tab isn't visible, click the More Tools (
 ) button, and then select Memory. The Memory tool opens:
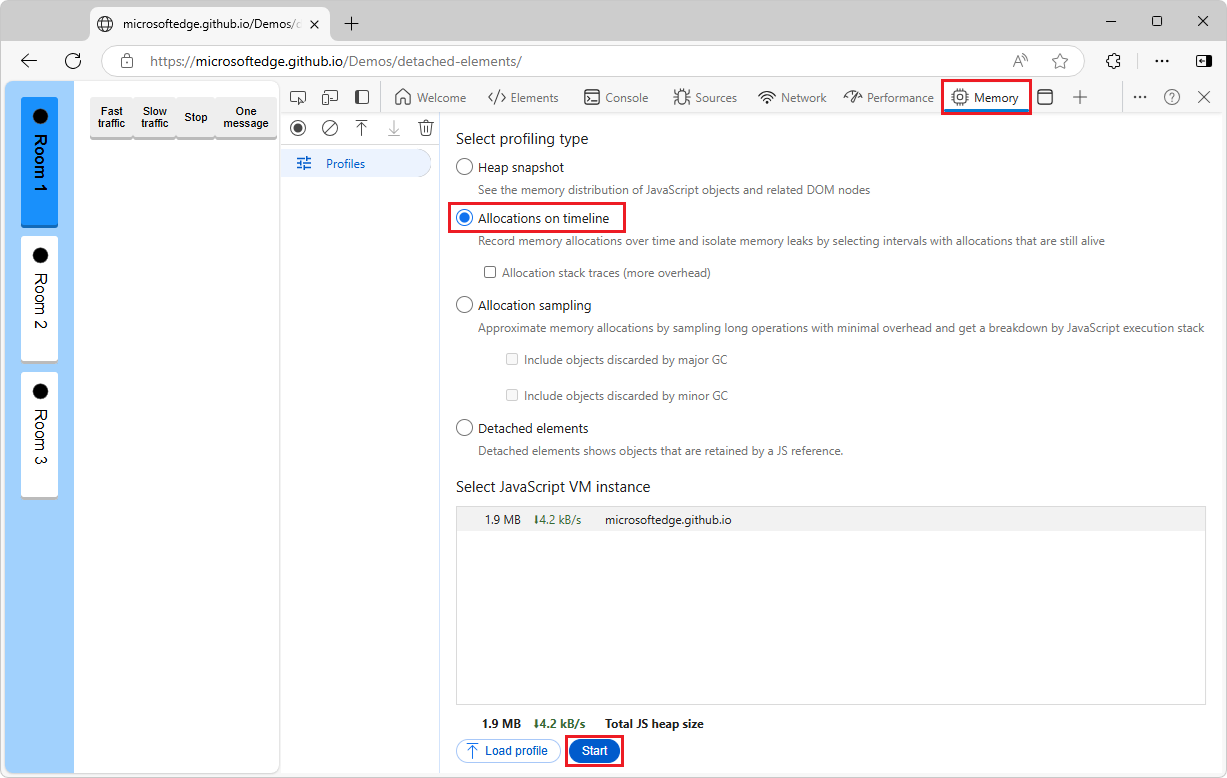
Select the Allocations on timeline option button.
If the Allocations on timeline option button isn't shown, because a profile is already displayed, in the upper left, click Profiles (
 ).
).At the bottom of the Memory tool, click the Start button.
Interact with the webpage; for example, click the Fast traffic button and then the Stop button in the demo webpage. Depending on what you are trying to analyze, you can either refresh the page, interact with the page, or just let the page run.
In the upper left of the Memory tool, click the Stop recording heap profile (
 ) button.
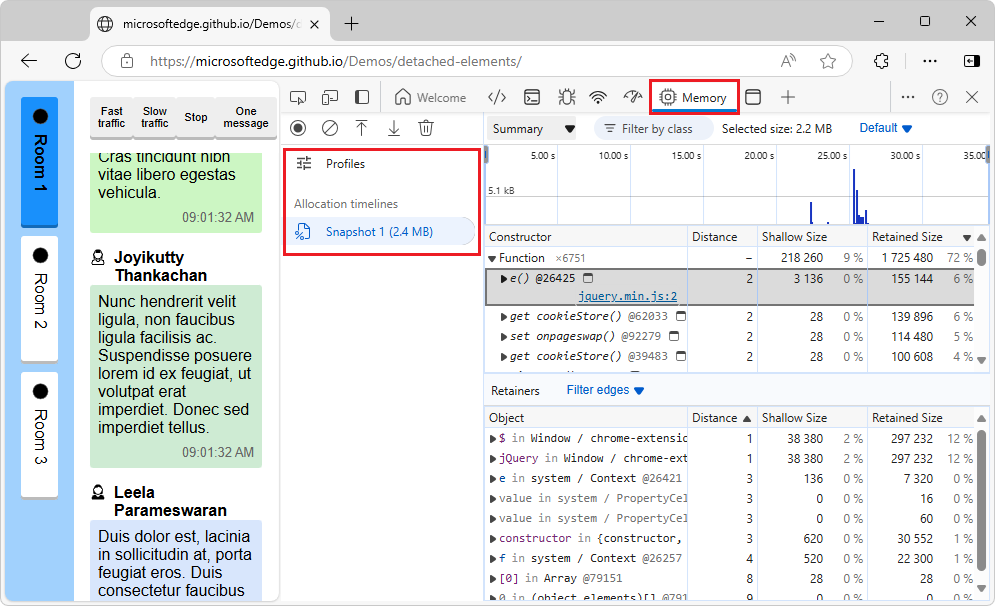
A new Snapshot is created in the Allocation timelines section of the Profiles list:
Record allocations on the timeline
In the Memory tool, use the Allocations on timeline profiling type. This is one of the DevTools features to track down memory leaks in your JS heap.
Given the following code:
var x = [];
function grow() {
    x.push(new Array(1000000).join('x'));
}
document.getElementById('grow').addEventListener('click', grow);
Every time that the button that's referenced in the code is clicked, a string of one million characters is added to the x array.
To record allocations on the timeline:
Open a webpage, such as a demo webpage.
Open DevTools, and select the Memory tool.
Click the Allocations on timeline option button, then click the Start button.
Perform the action that you suspect is causing the memory leak.
When you are done, click the Stop recording heap profile
 button.
As you are recording, notice whether any blue bars show up on the Allocation instrumentation on the timeline:
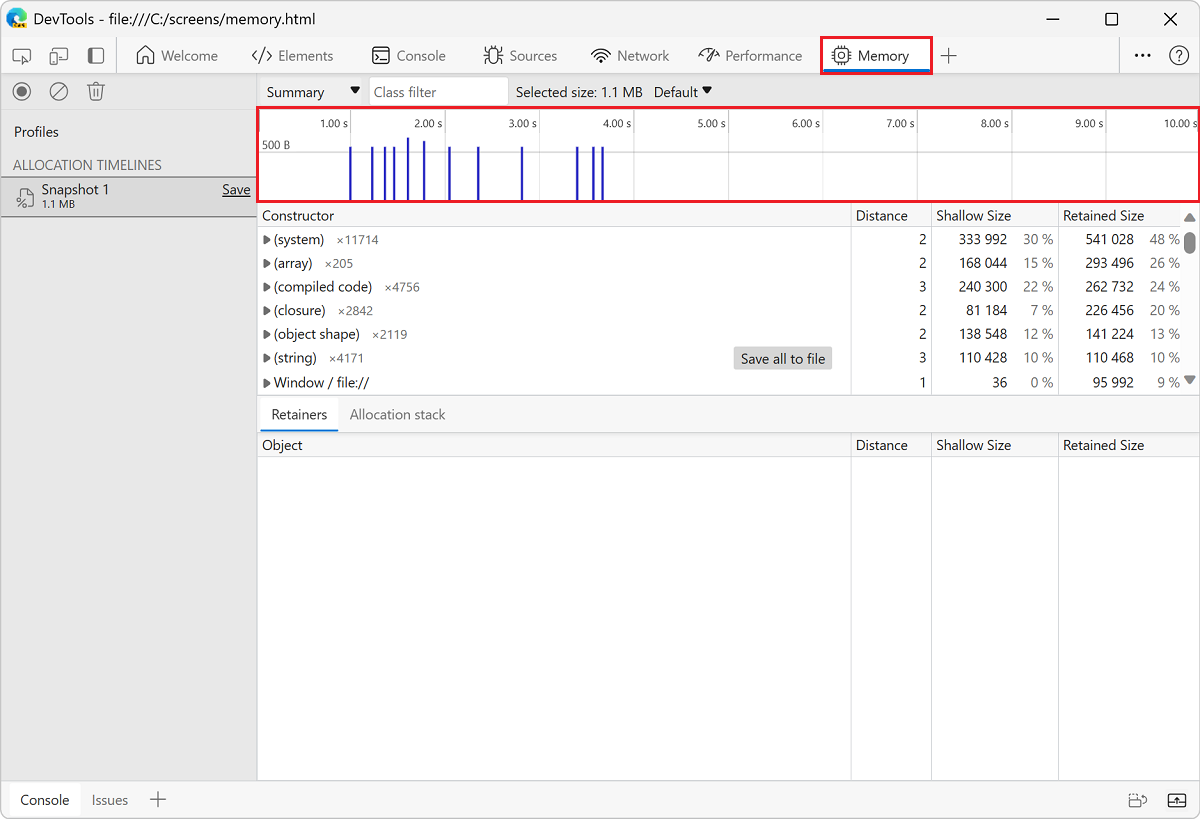
Those blue bars represent new memory allocations. Those new memory allocations are your candidates for memory leaks.
Zoom on a bar to filter the Constructor pane to only show objects that were allocated during the specified timeframe.
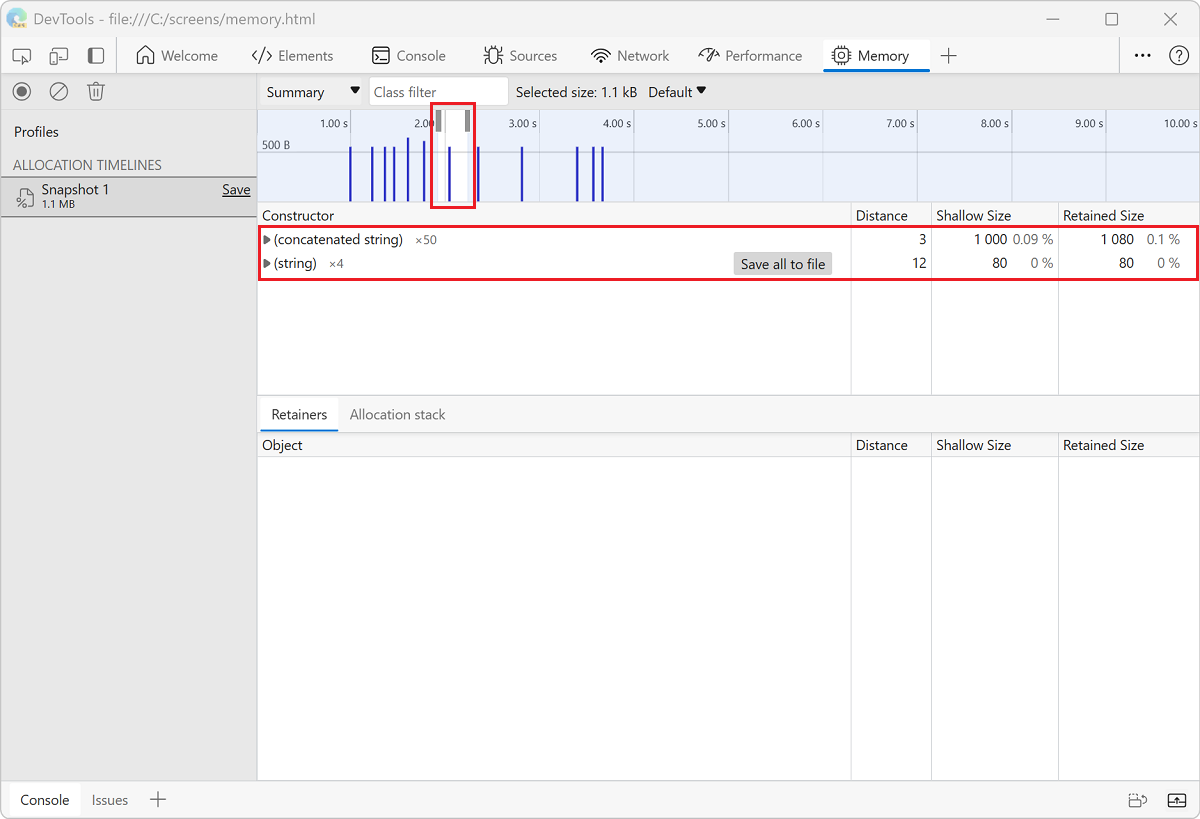
Expand the object and select the value to view more details in the Object pane.
For example, in the details of the newly allocated object indicates that it was allocated to the
xvariable in theWindowscope: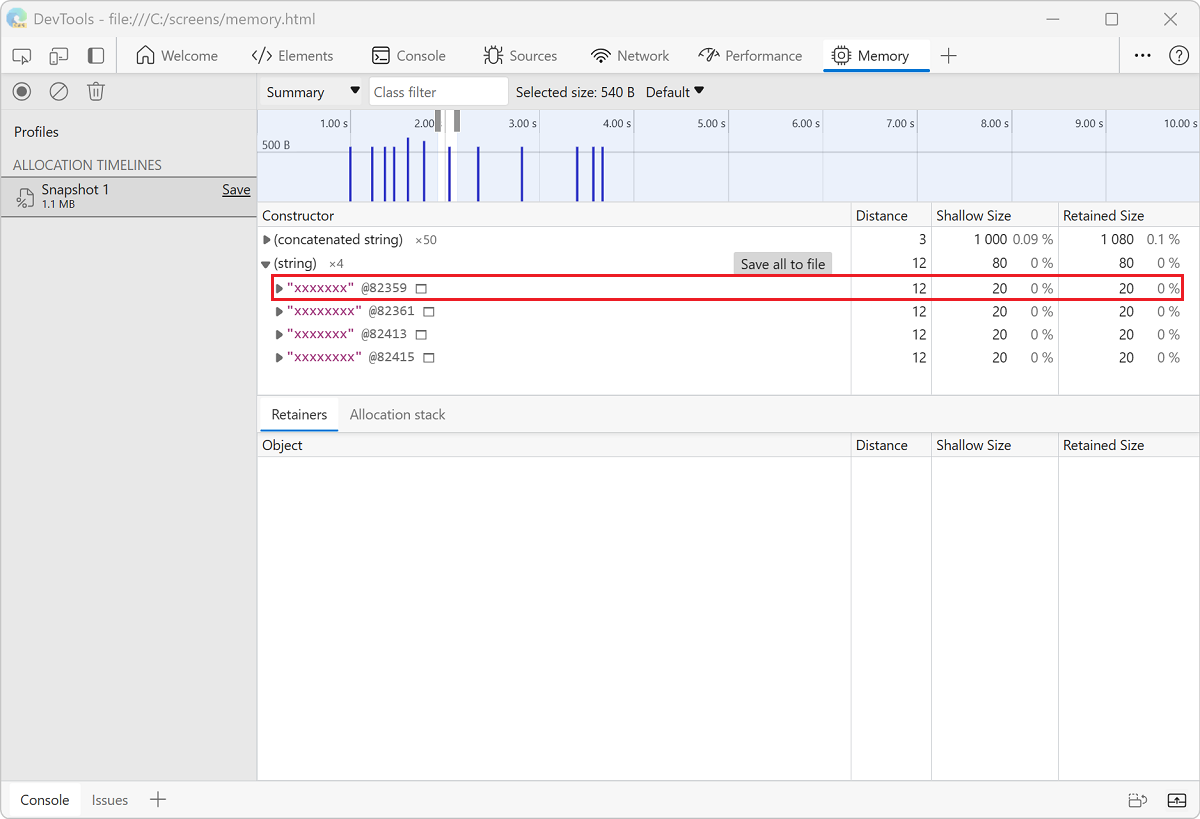
Read a heap allocation timeline
The heap allocation timeline shows where objects are being created and identifies the retaining path. In the following figure, the bars at the top indicate when new objects are found in the heap.
The height of each bar corresponds to the size of the recently allocated objects, and the color of the bars indicate whether or not those objects are still live in the final heap snapshot. Blue bars indicate objects that are still live at the end of the timeline, Gray bars indicate objects that were allocated during the timeline, but have since been garbage collected.
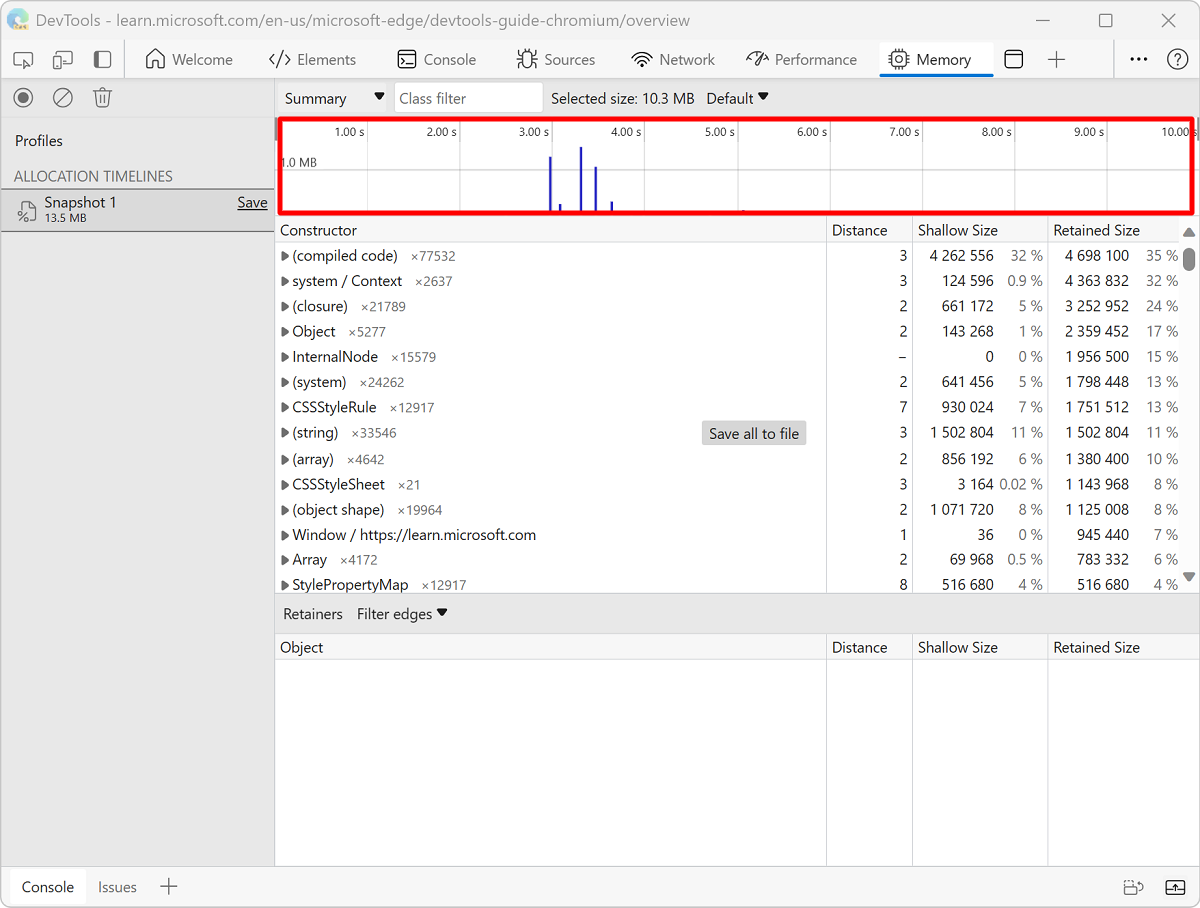
You can use the sliders in the timeline above to zoom into that particular snapshot and review the objects that were recently allocated at that point:
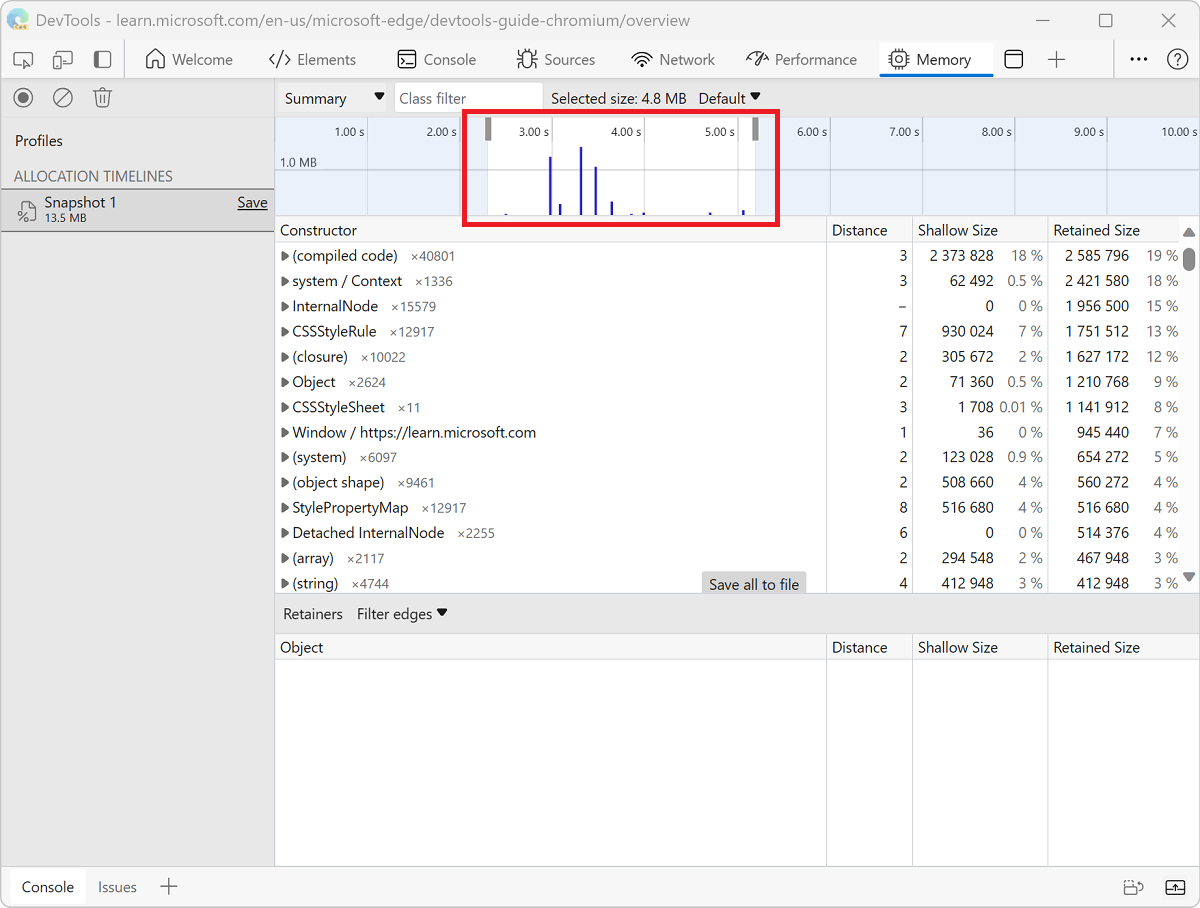
Clicking on a specific object in the heap shows the retaining tree in the bottom portion of the heap snapshot. Examining the retaining path to the object should give you enough information to understand why the object was not collected, and you should make the necessary code changes to remove the unnecessary reference.
View memory allocation by function
You can view memory allocation by JavaScript function. See Speed up JavaScript runtime ("Allocation sampling" profiling type).
Note
Portions of this page are modifications based on work created and shared by Google and used according to terms described in the Creative Commons Attribution 4.0 International License. The original page is found here and is authored by Meggin Kearney.
 This work is licensed under a Creative Commons Attribution 4.0 International License.