Endpoint analytics scores, baselines, and insights
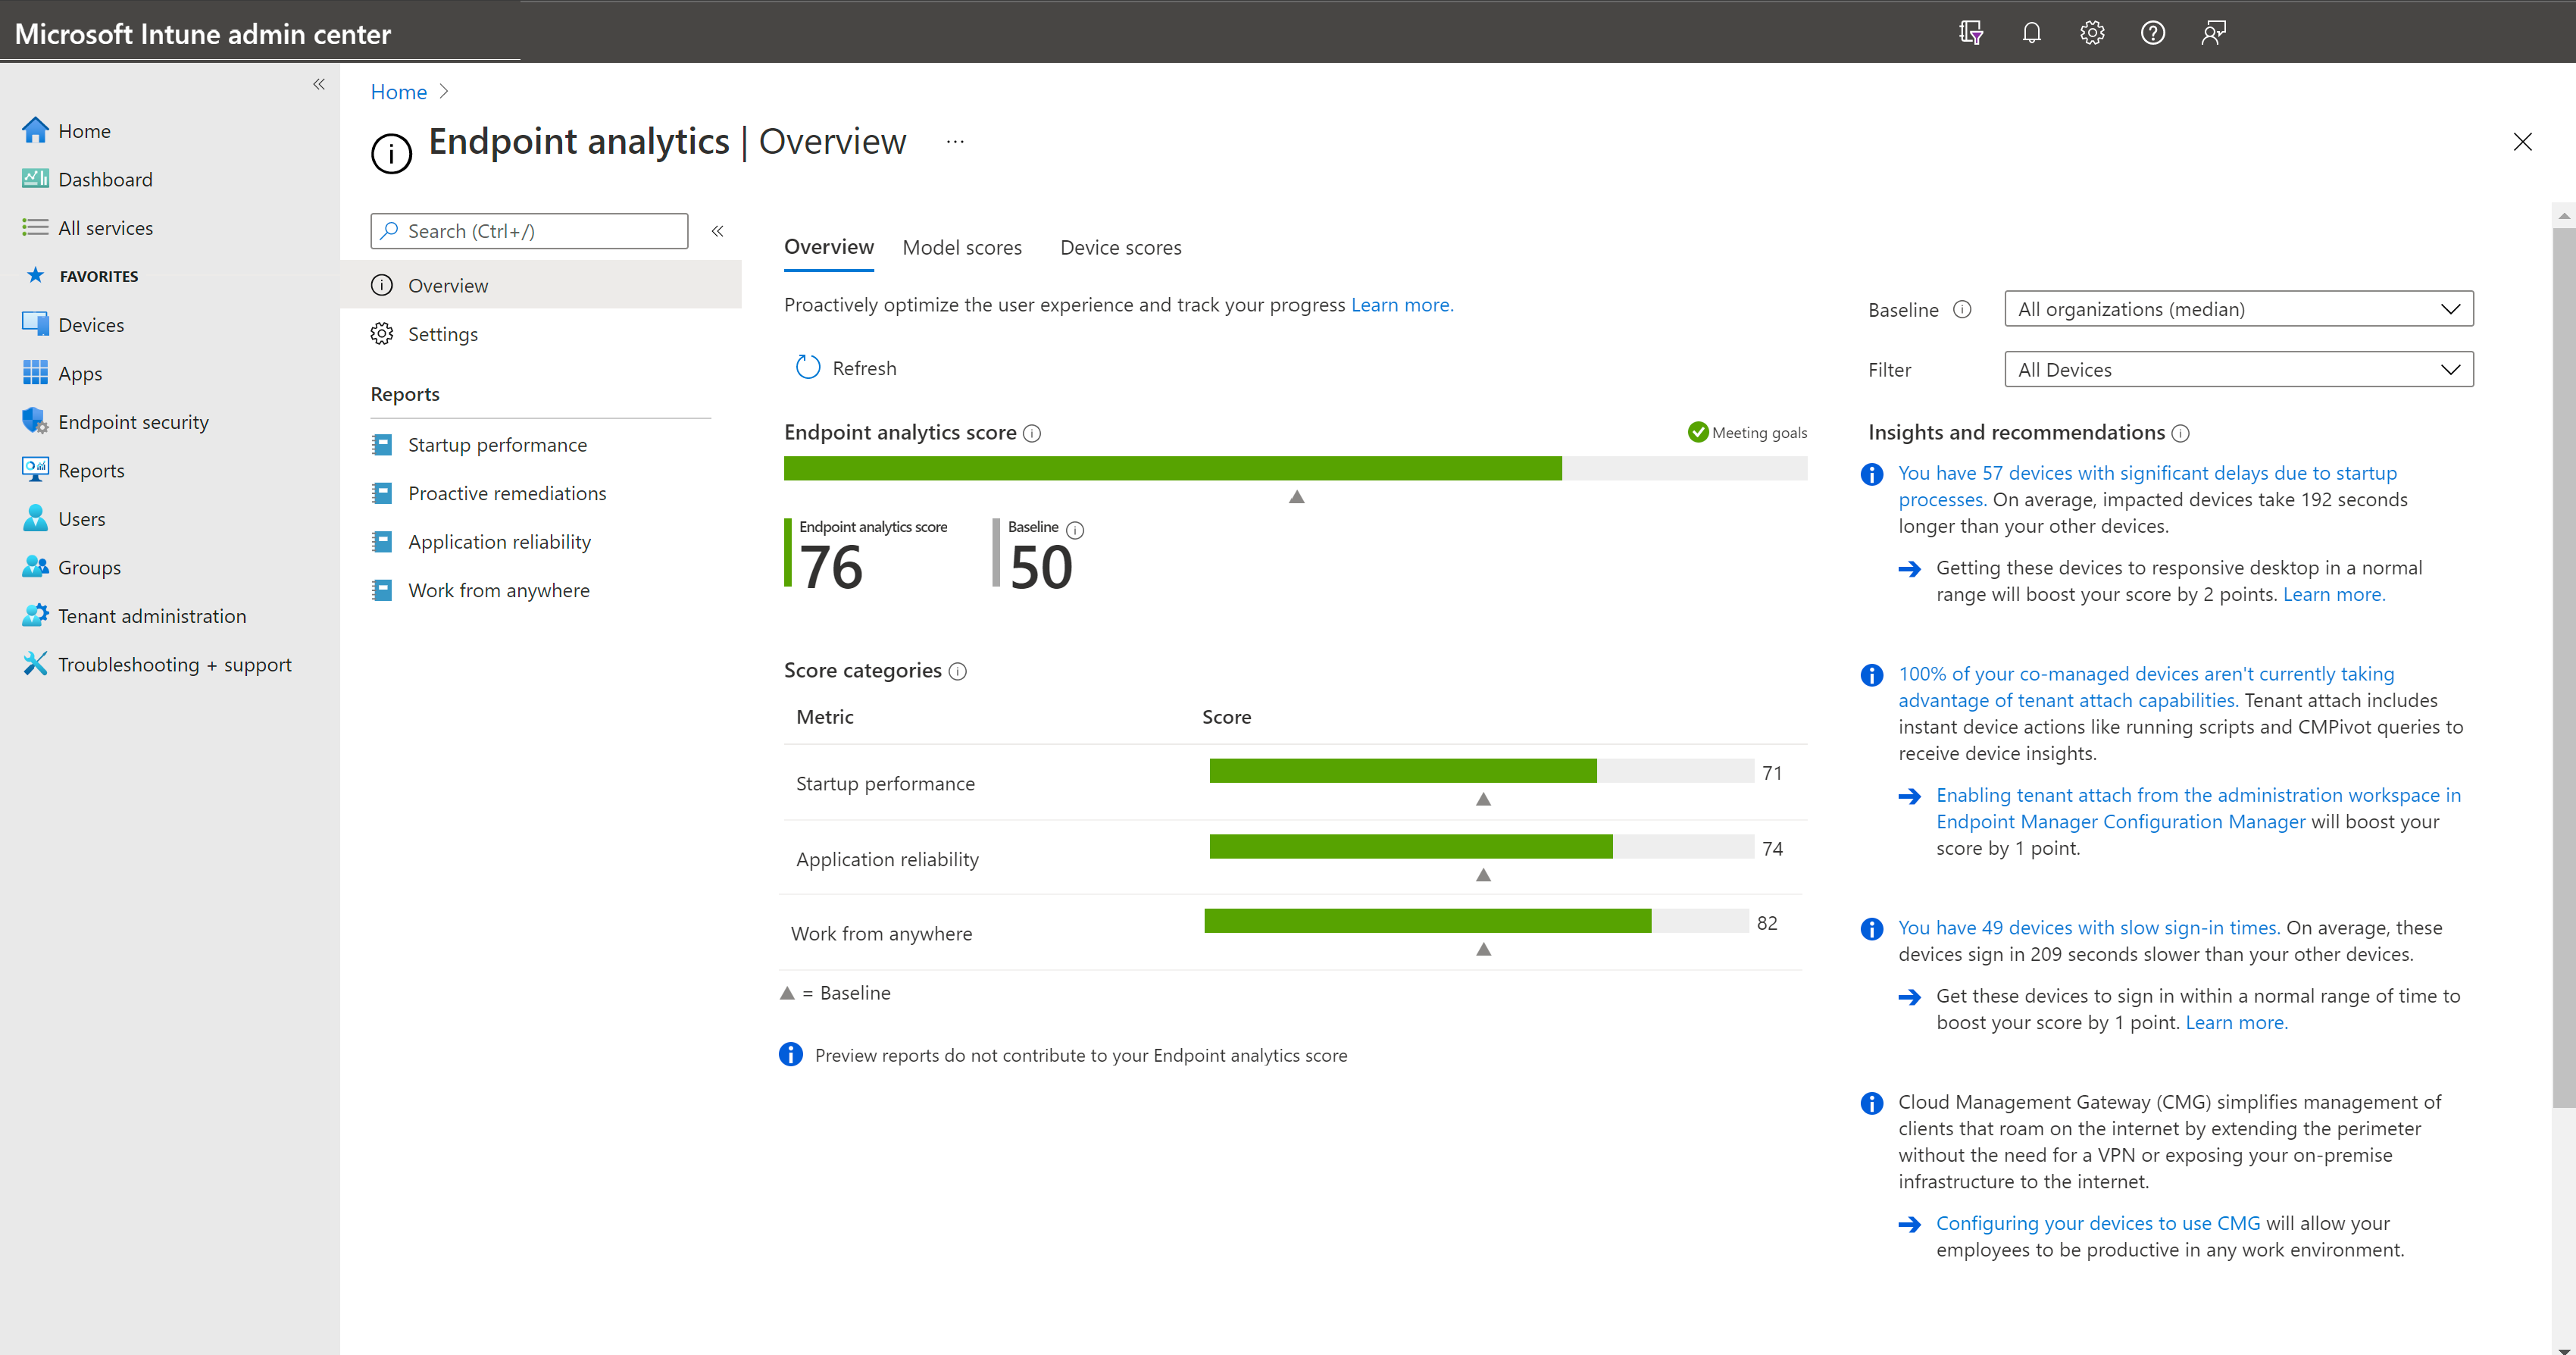
When you first open the Overview page in Endpoint analytics, you're presented with a few score charts. The page includes information about what affects the scores and how to improve them, if needed. Understanding the following three items are central to understanding each of the reports:
- Scores
- Baselines
- Insights and recommendations
Understanding scores
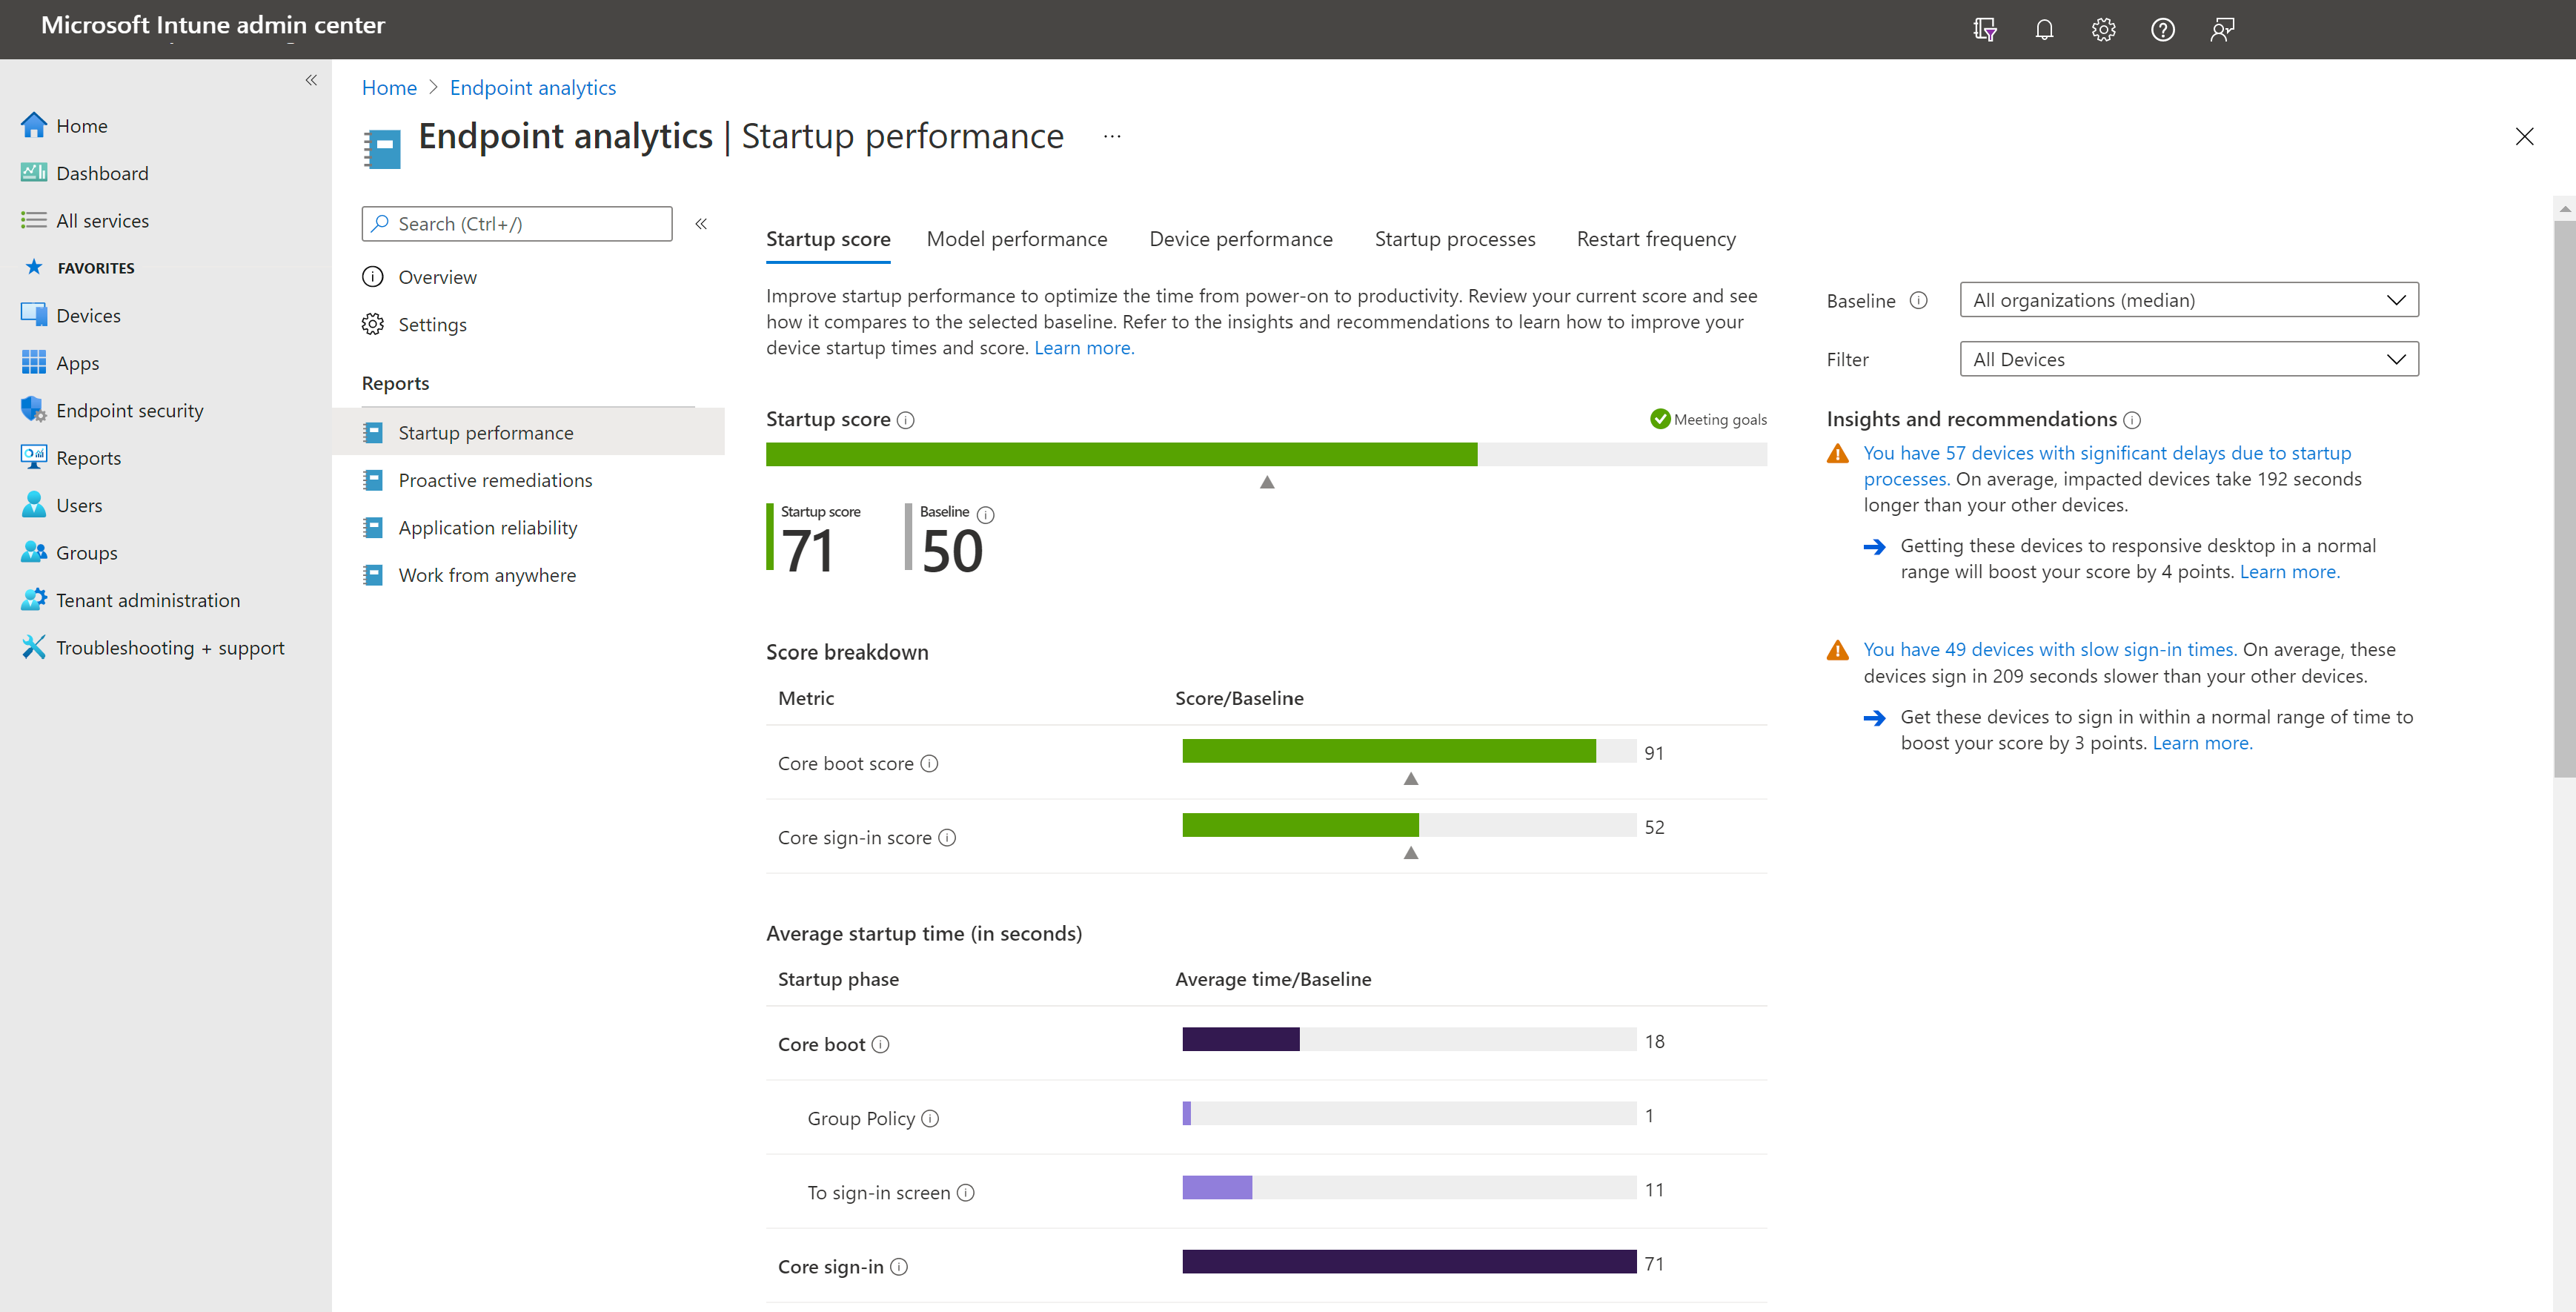
Endpoint analytics scores range from 0 to 100. Lower scores indicate there's room for improvement. Scores help you understand how each metric affects your environment. For instance, when reviewing your startup score, you find that overall your score of 61 is higher than the baseline of 50 for all organizations. When examining the startup score breakdown, you find that your environment excels during the core boot phase with a score of 77. However, based on the average time it takes to get to a responsive desktop, you suspect long running startup processes are lowering the core sign-in score to 46. Reviewing the top insights and recommendations entry for the startup score confirms that long running processes are responsible for the effect on the score.
A status of insufficient data means you don't have enough devices reporting to provide a meaningful score. Currently, at least five devices are required.
Baselines
Baseline scores are shown on charts as triangle markers. There's a built-in baseline for All organizations (median), which allows you to compare your scores to a typical enterprise. You can create new baselines based on your current metrics so you can track progress or view regressions over time. For more information about creating baselines, see baseline settings.
Important
We anonymize and aggregate the scores from all enrolled organizations to keep the All organizations (median) baseline up-to-date. You can stop gathering data at any time.
Insights and recommendations
Insights and recommendations is a prioritized list to improve your score. The whole list is displayed on the Overview page either beside or below the charts depending on the width of your browser window. Insights and recommendations are filtered to the subnode's context when you navigate through reports. The recommendation listed with each insight tells you how to increase the score and how many points the score gains when the recommendation is complete.
- Selecting the insight link from Insights and recommendations provides you with more information on devices and attributes related to the insight.
- The
Learn morelink takes you to information about how the metric is scored and the recommended course of action is for the insight.
Per device scores
To help you identify devices that could be impacting user experience, Endpoint analytics shows some scores per device. Reviewing scores per device might help you find and resolve end-user impacting issues before a call is made to the help desk. From the Endpoint analytics main page, select the Device scores tab to display individual device scores. Sorting by scores can assist you in finding devices that might need attention.
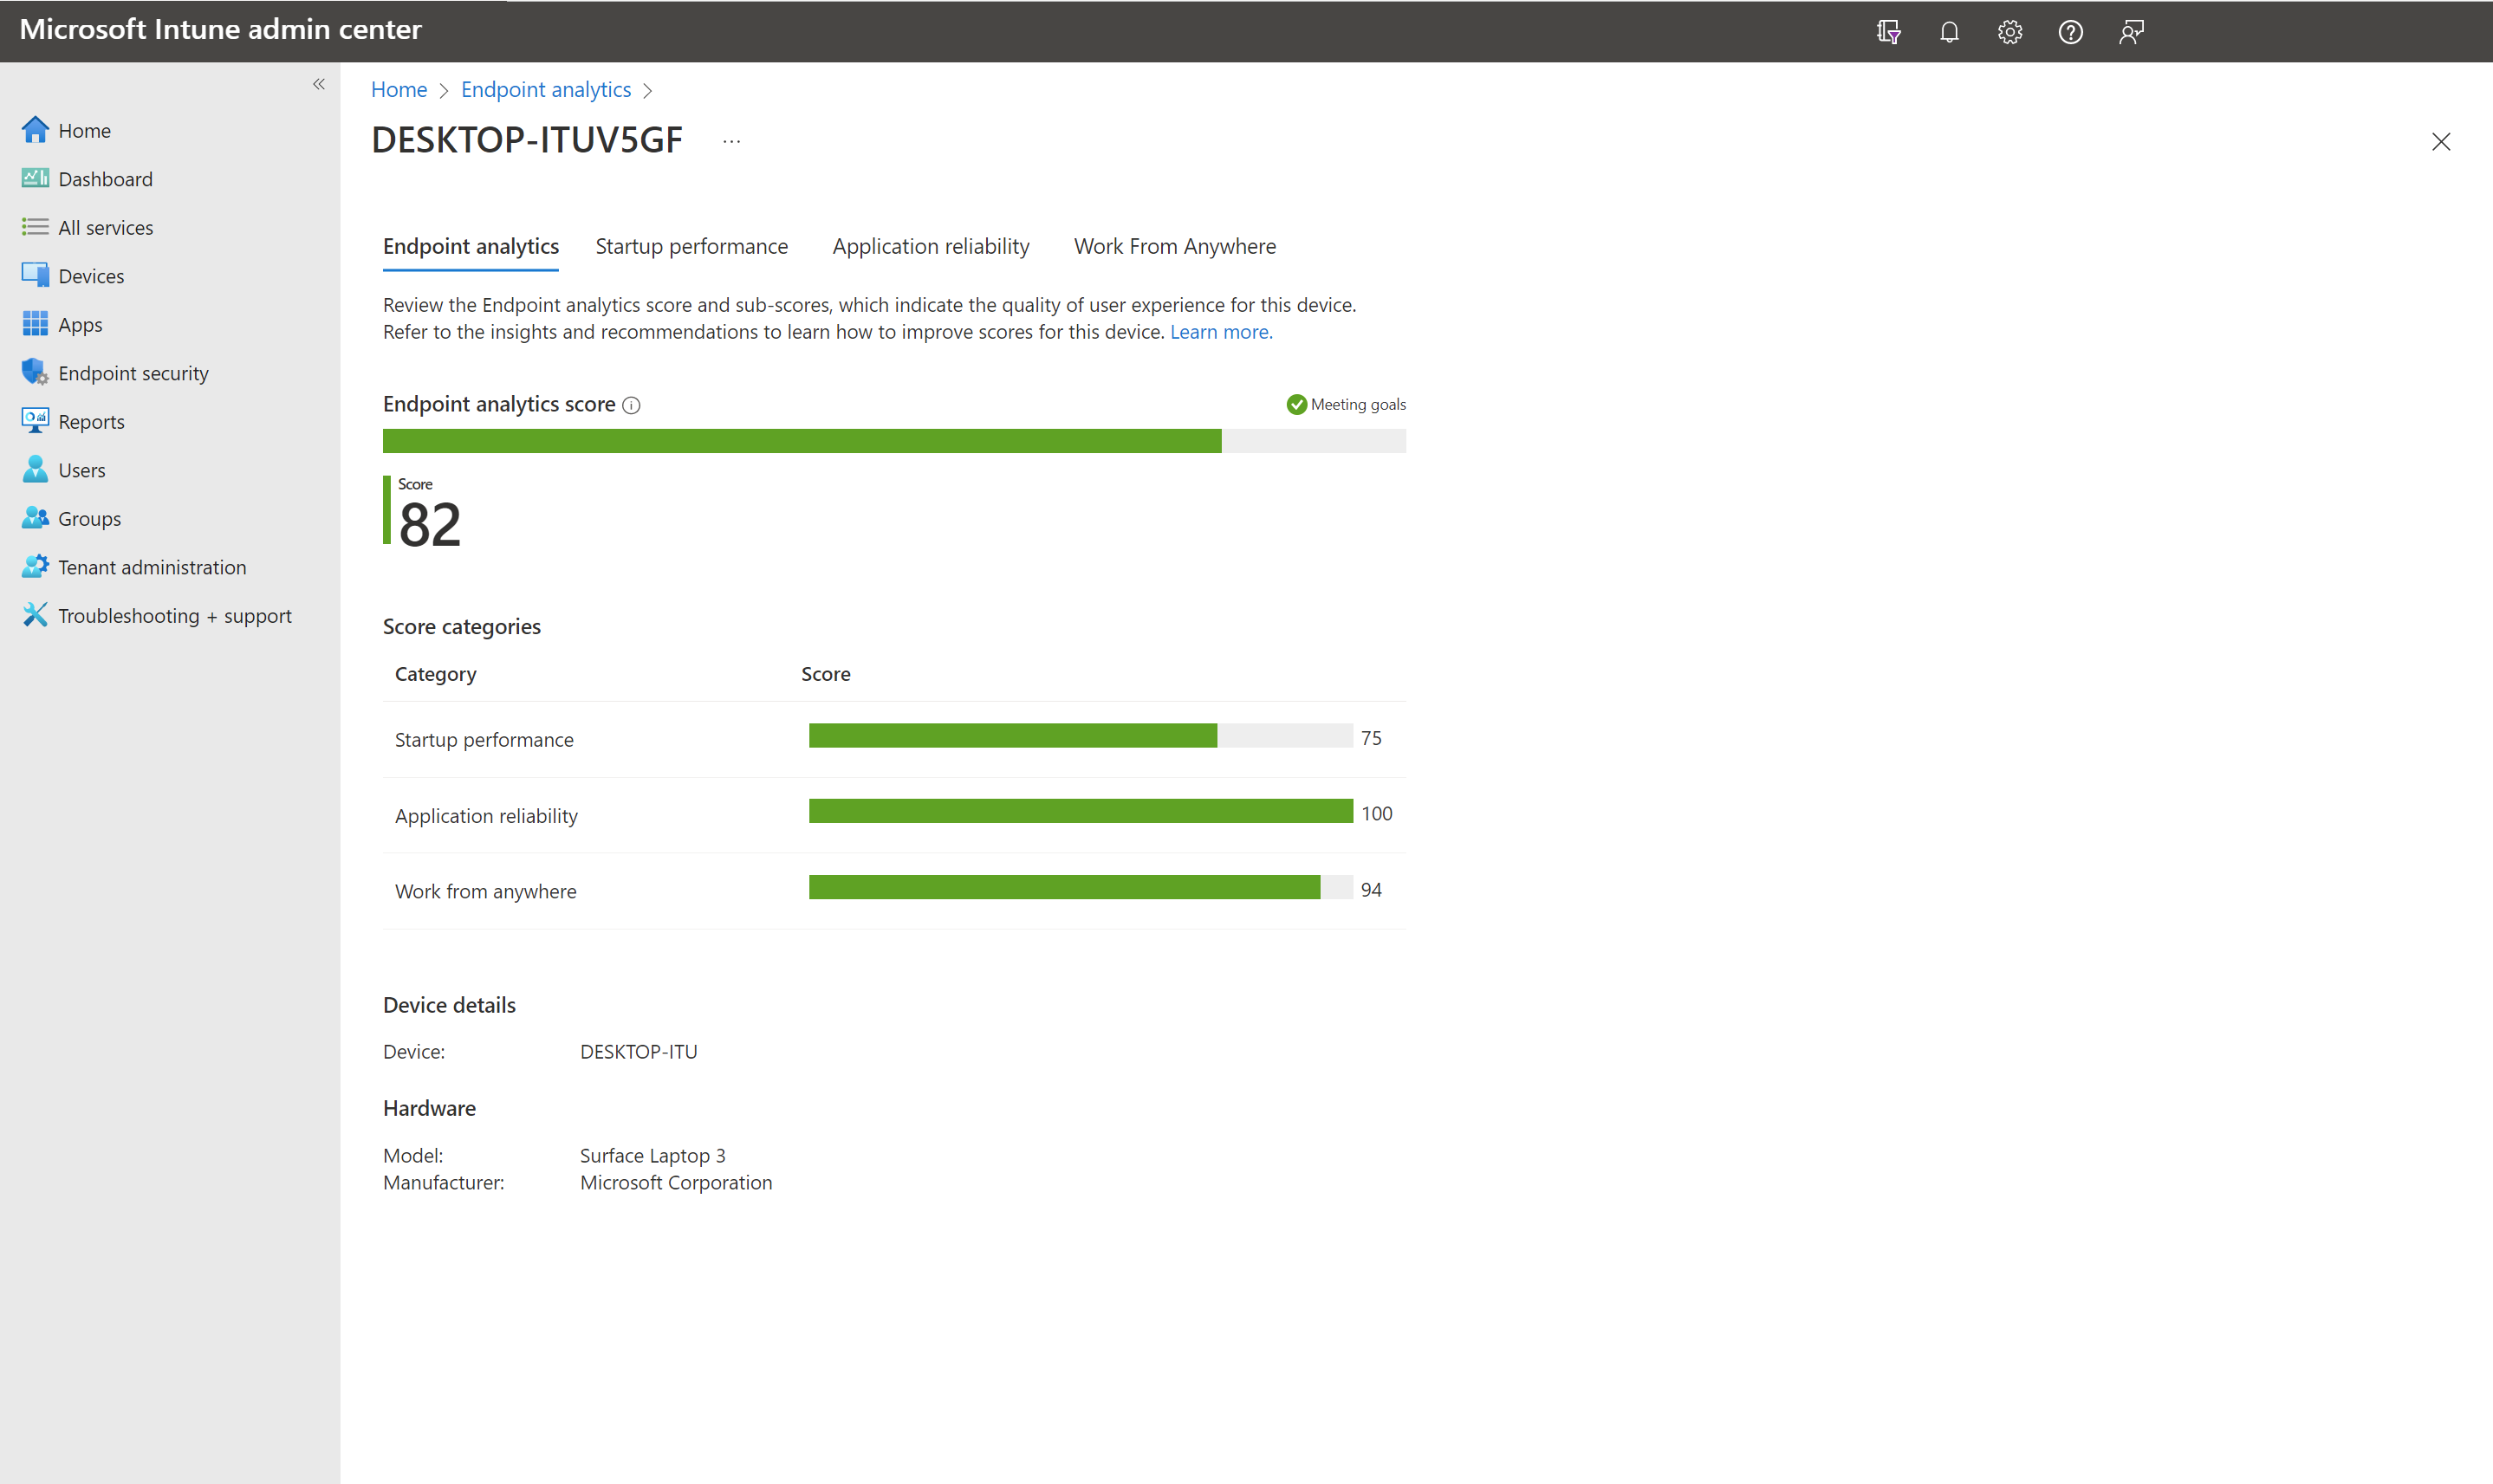
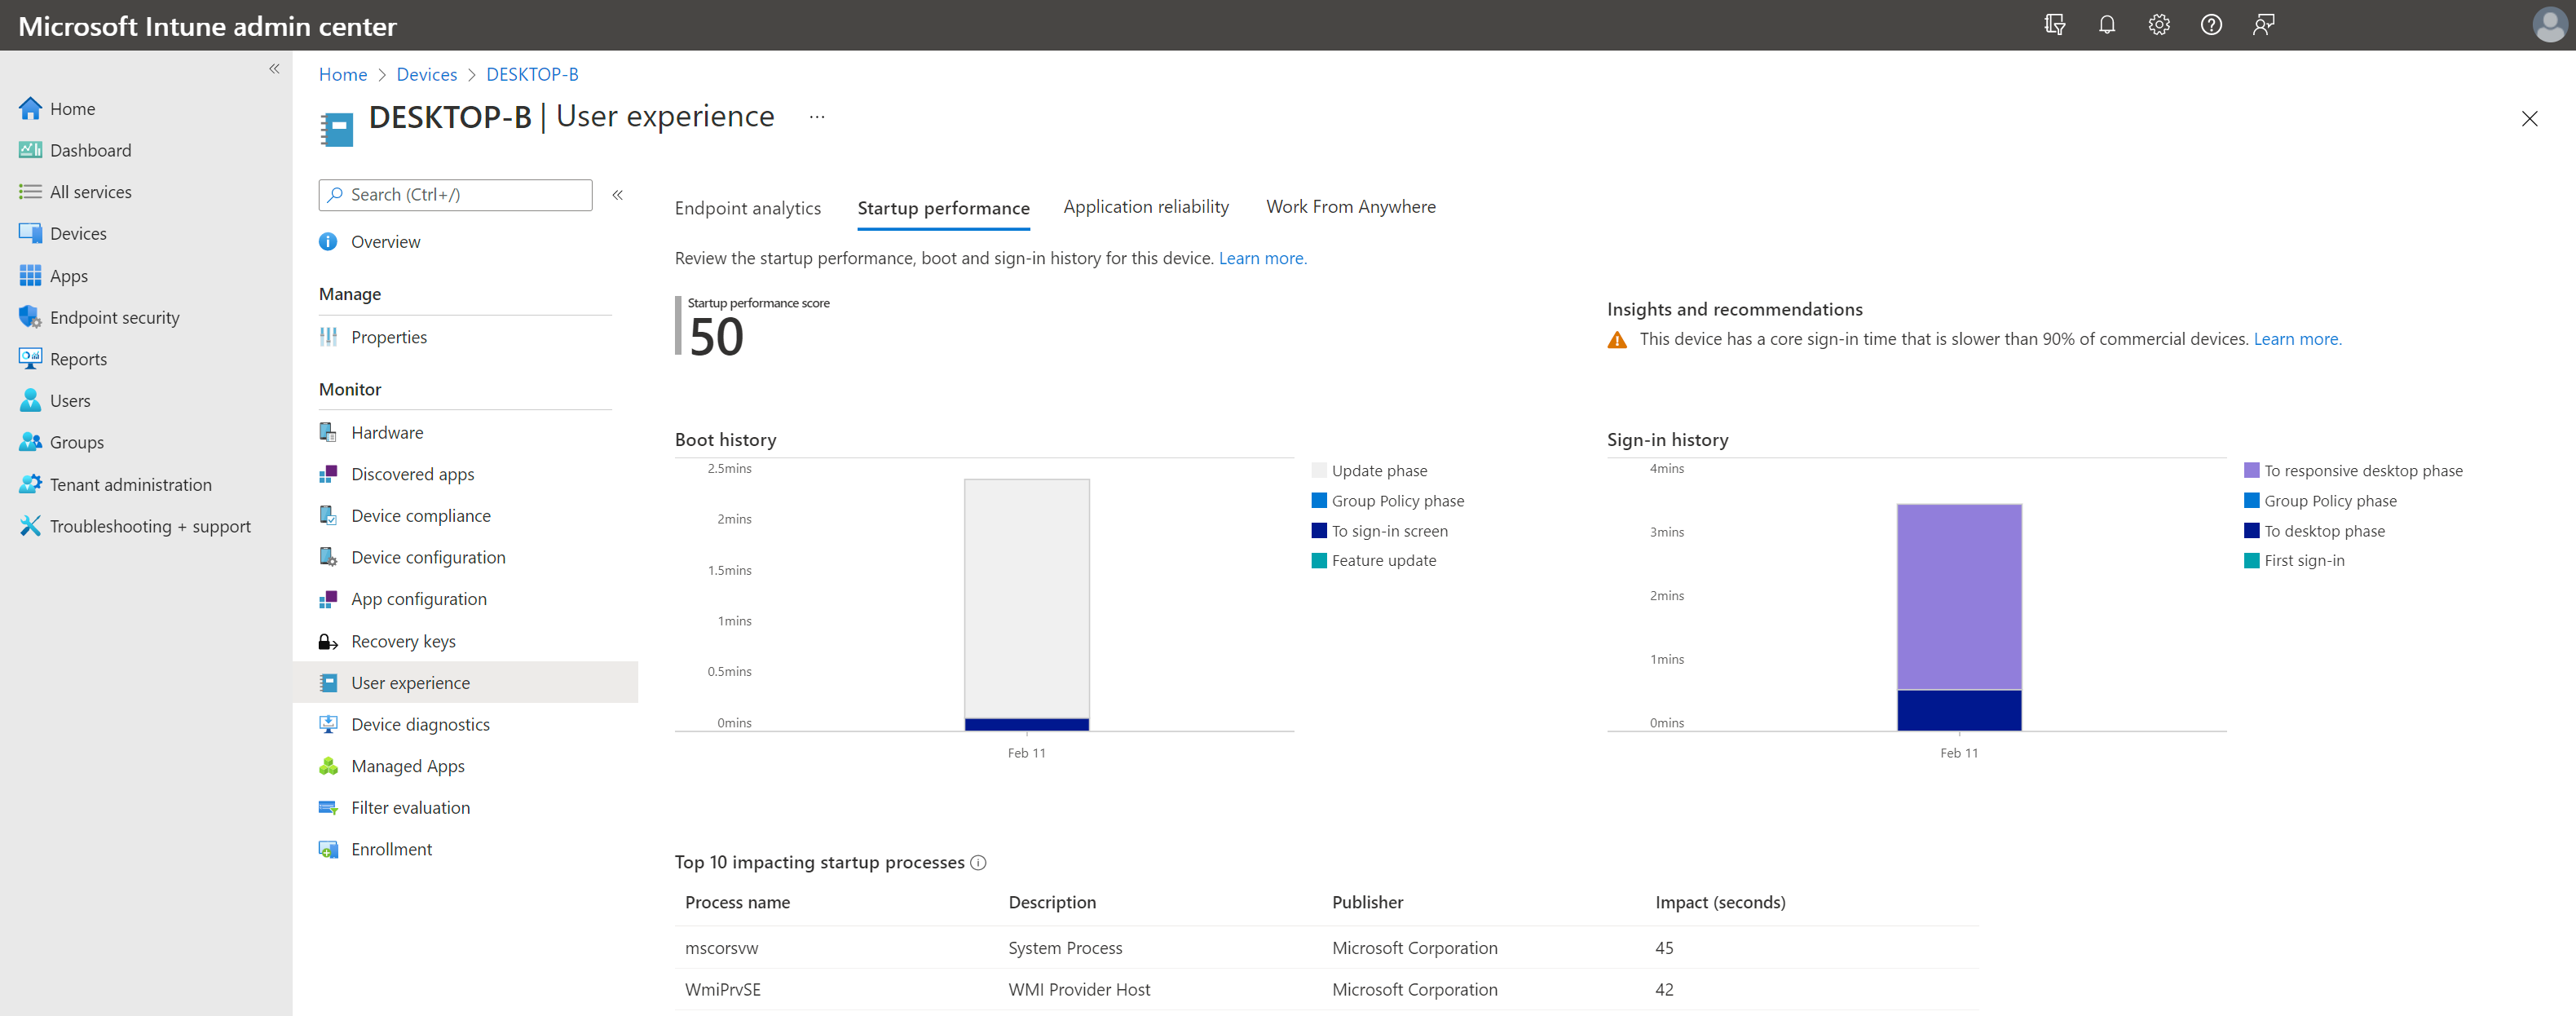
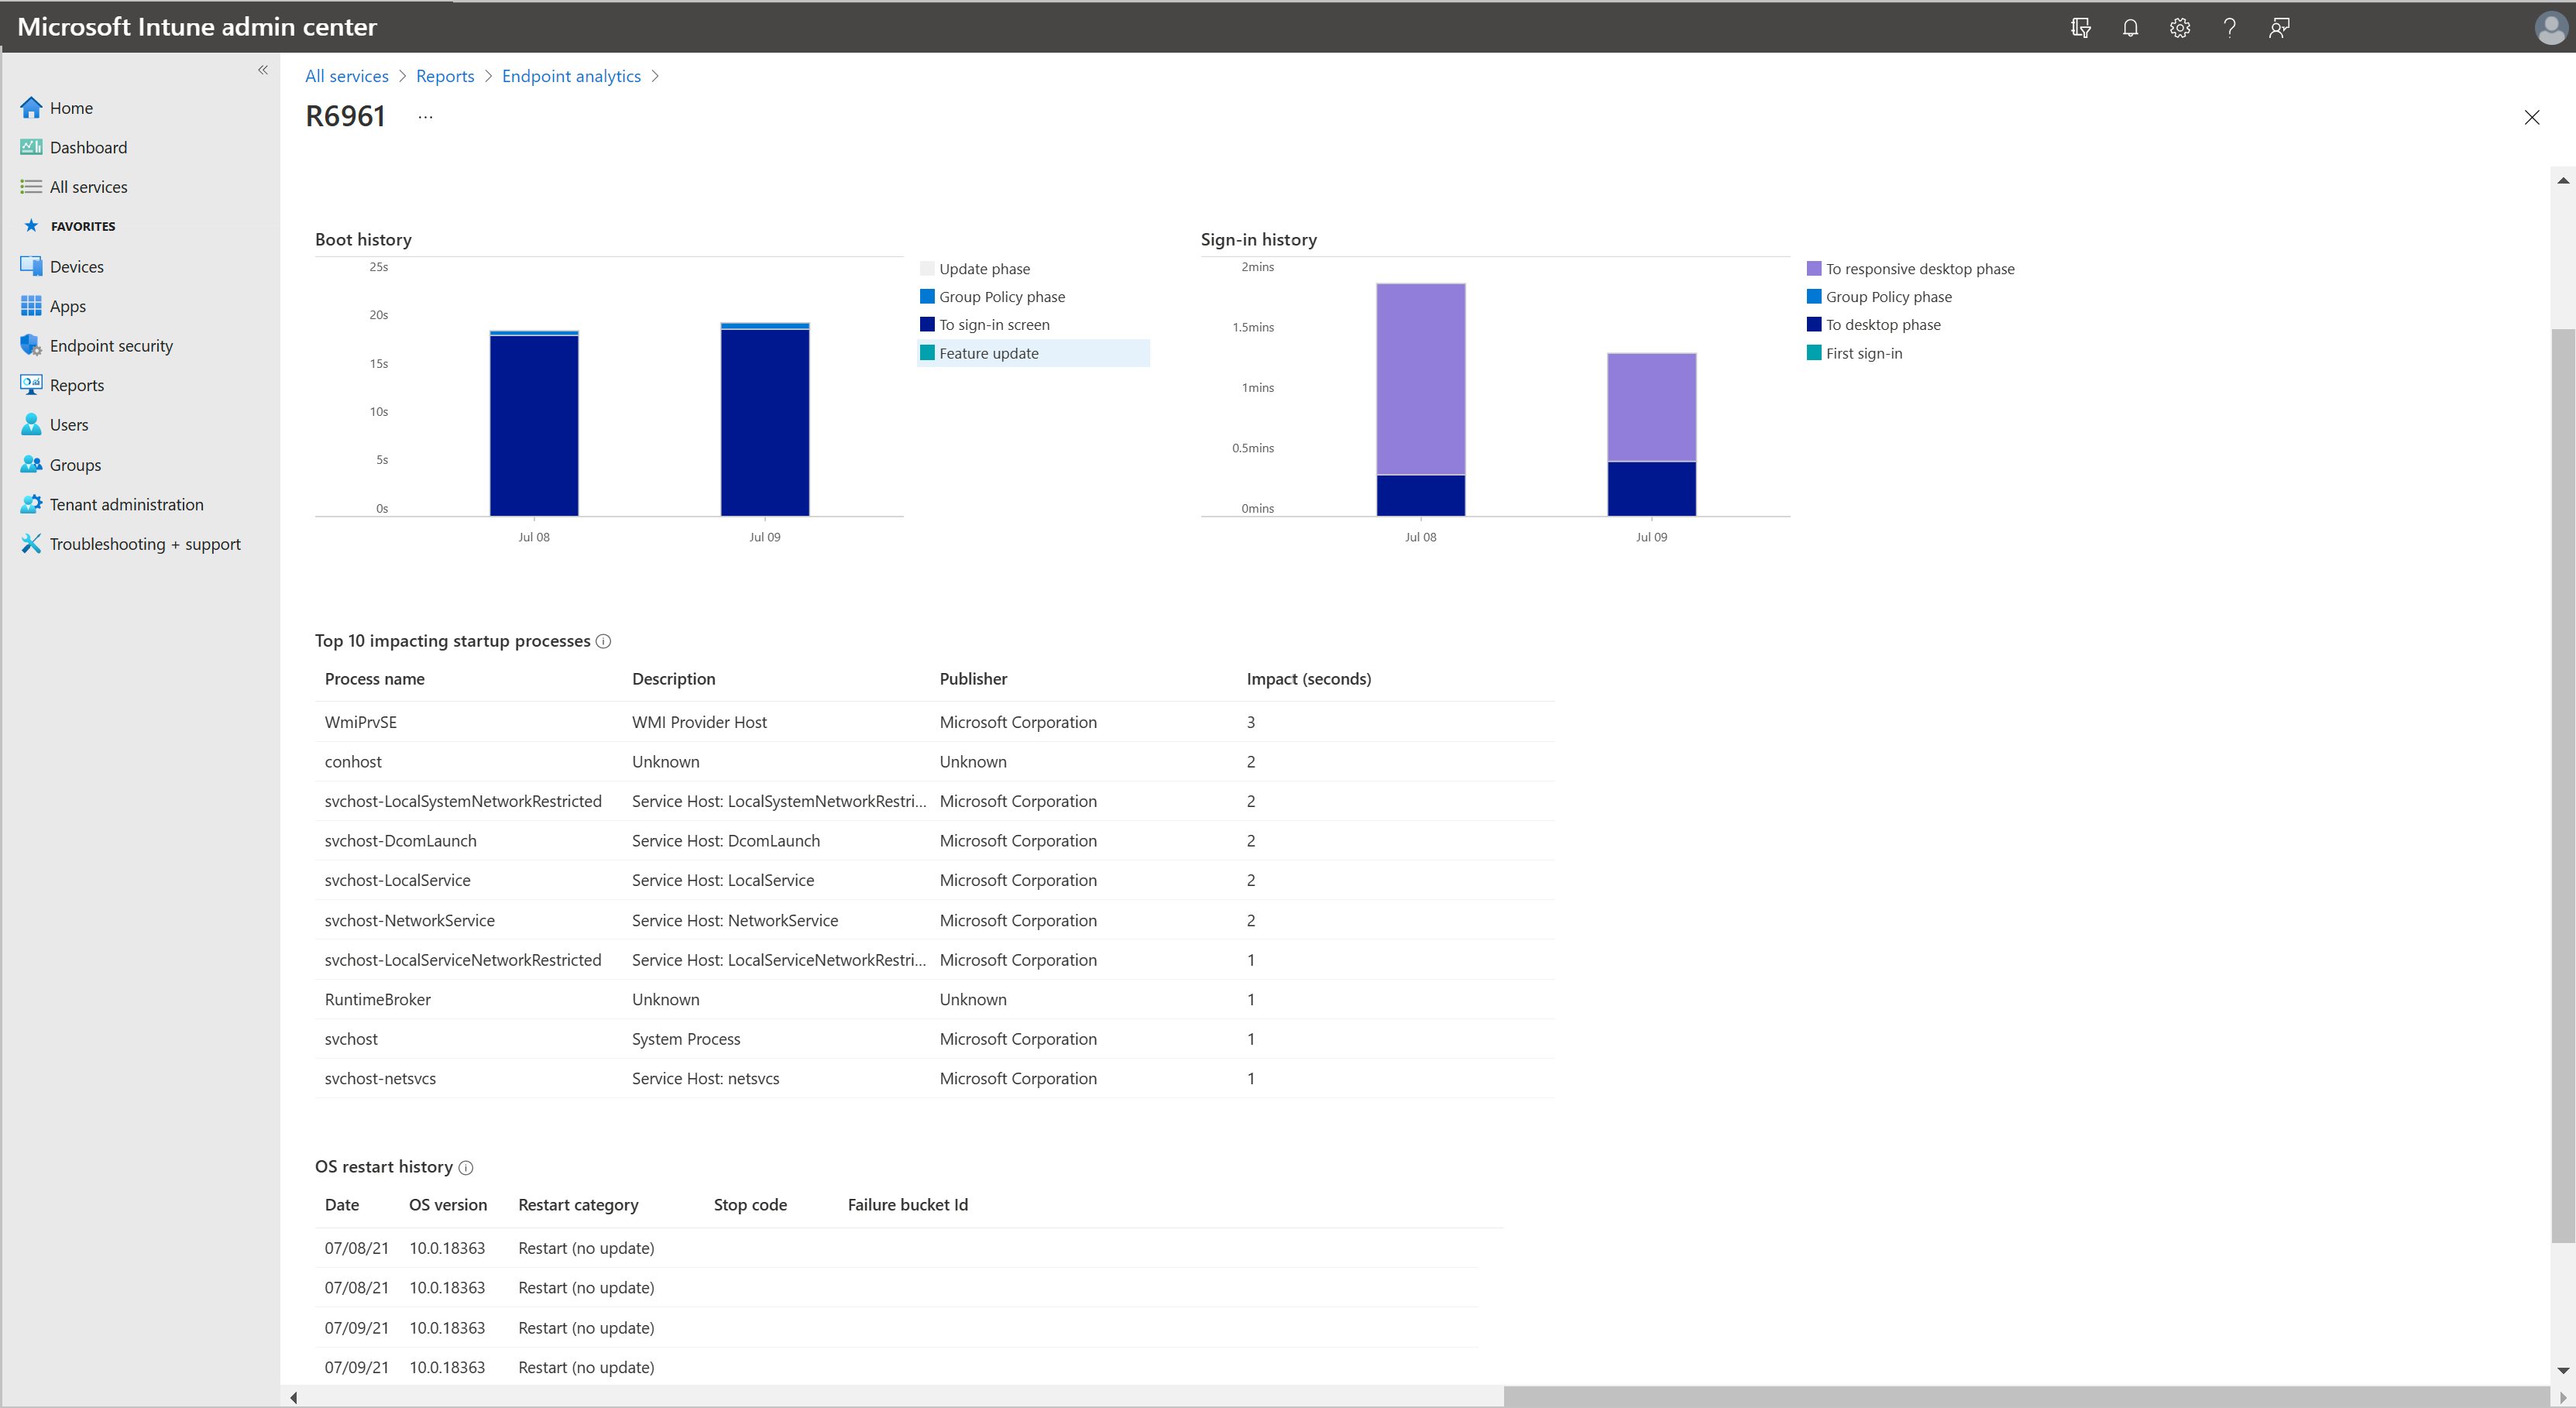
Selecting a device from the Devices scores tab loads a device page that gives you more information. From the device's Startup performance tab, review Boot history and Sign-in history for experience impacting trends. The Application reliability tab provides insight into potential issues for desktop applications on the managed device.
You can also access per device scores on a device's User experience page. From the User experience page you can review the Endpoint analytics, Startup performance, and Application reliability information for the specific device.
Device level drill-in from reports
When reviewing your organization's reports, you can view individual device scores. To drill-in for information on a specific device, select the Device performance tab, then choose a device.
Note
You may notice small differences in values when reviewing detailed reporting when compared to overall less granular scores for devices and models.
Per model scores
Endpoint analytics shows scores per device model. These scores help admins contextualize the user experience across device models in the environment. Reviewing model scores might help you project and prioritize your next hardware refresh cycle. It can also help you discover devices that no longer meet your organization's current hardware specifications. From the Endpoint analytics main page, select the Model scores tab to display scores per device model. Scores per device model are available in all Endpoint analytics reports.
Filter reports
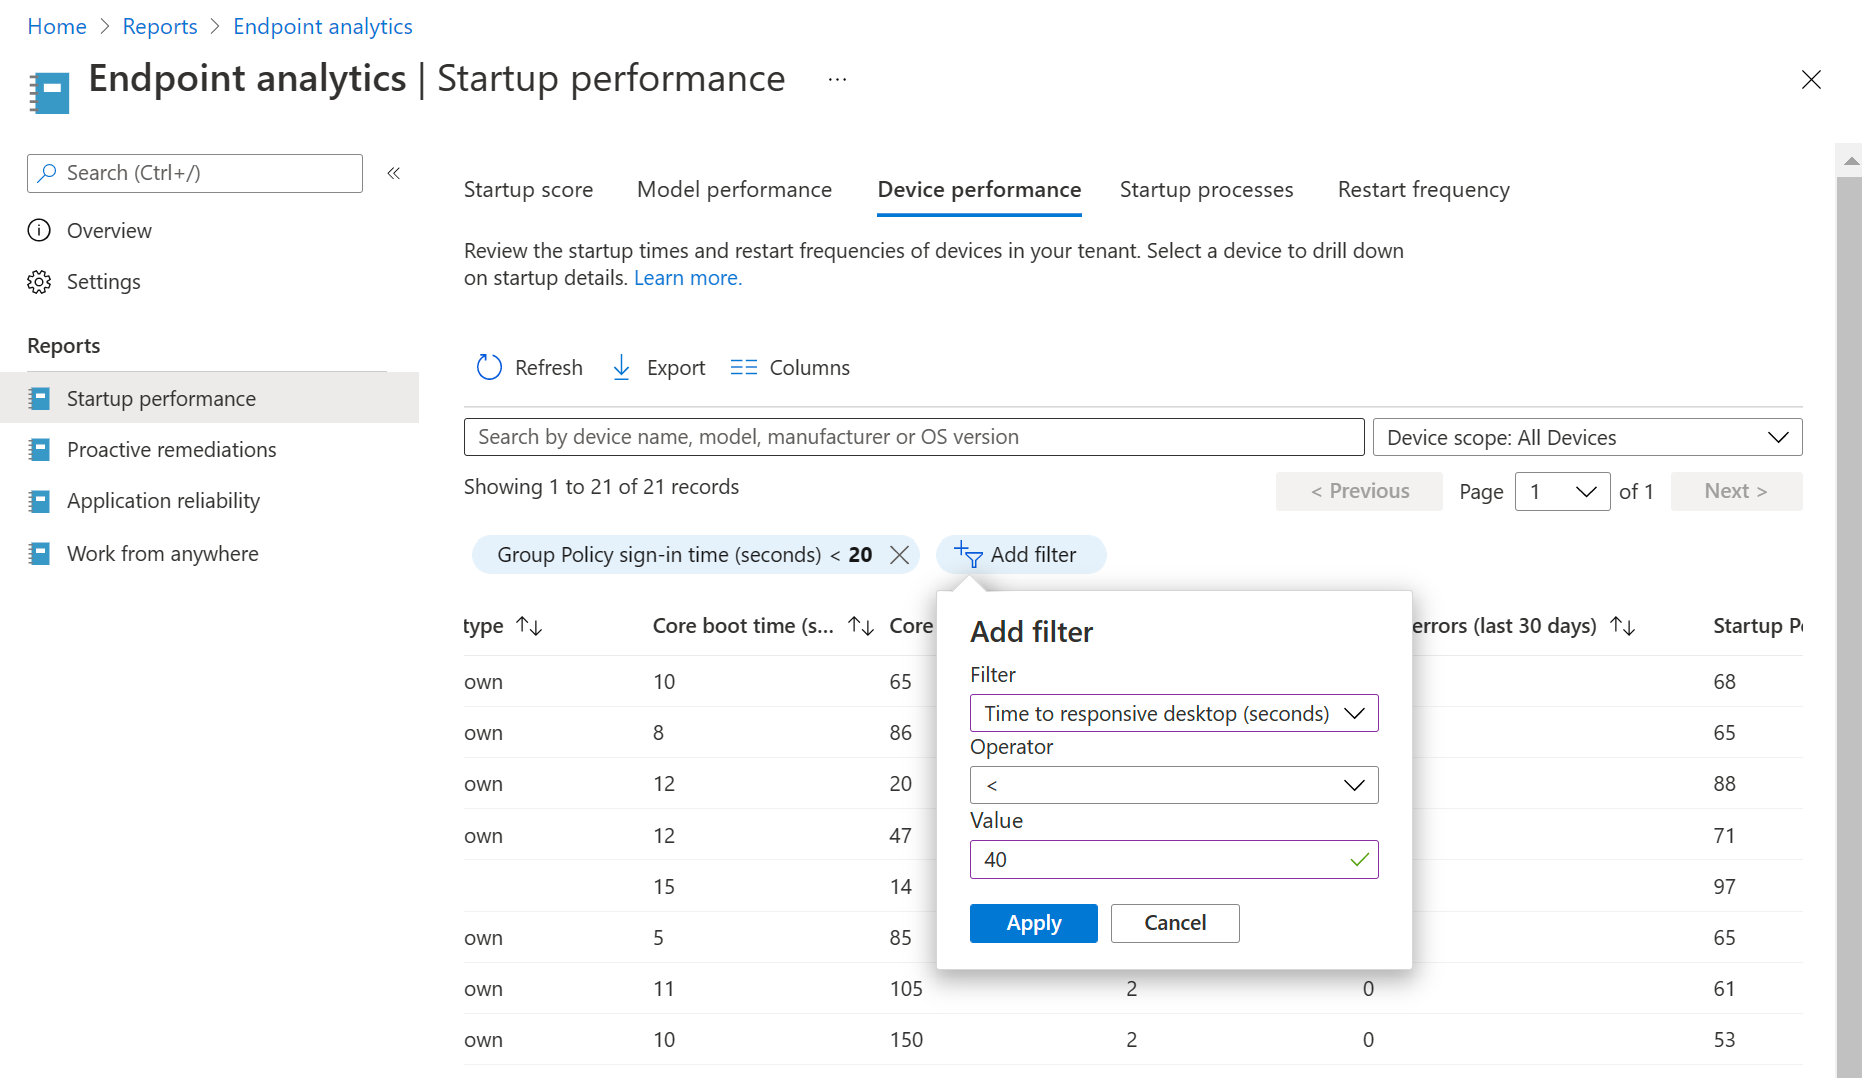
Use the Add filter option on tables to display items that match your criteria. You can add more filters to drill further into your data. Using filters enables you to discover trends in your environment or spot potential issues. For instance, in the Device performance tab of the Startup performance report, you might use a filter to identify devices with a high Time to responsive desktop. After reviewing your filtered data, you add another filter to include devices with a high Group Policy sign-in time. With the extra filter, you can gauge the effect of Group Policy on user experience for devices that take a long time to get to a responsive desktop.
Note
There are currently limitations in the following filters:
- The Disk type filter doesn't support the value Unknown.
- Filtering on Startup performance score from Overview > Device Scores returns devices with a score of "--".
Known issues
Exported csv files display numerical values
When reporting data is exported to a .csv file, the exported data doesn't use the friendly names you're used to seeing in the online reports. Use the information below to map the data in the exported file into the meaning of the value:
Application reliability report
- The
TotalAppUsageDurationandMeanTimeToFailurecolumns in the.csvfile are integer values with a unit of minutes - A
MeanTimeToFailurevalue of 2147483647 meansNo crash events
Per device score report
A value of
-1or-2in theEndpointAnalyticsScore,StartupPerformanceScore, andAppReliabilityScorecolumns means the associated score is unavailableHealth status:
HealthStatus .csvvalueReport value 0 Unknown 1 Insufficient data 2 Needs attention 3 Meeting goals
Startup performance report
The CoreBootTime, GPBootTime, CoreLogonTime, GPLogonTime, DesktopUsableTime, Median, and TimePerProcess columns are integer values with a unit of seconds.
Work from anywhere report
Column name in
.csvfile: UpgradeEligibility
Report column name: Windows 11 readiness status.csvvalueReport value 0 Upgraded 1 Unknown 2 Not capable 3 Capable Column name in
.csvfile: GraphDeviceIsManaged
Report column name: Microsoft Entra registered
Next steps
- Use Remediations to gather more data and take action on devices
