series_metric_fl()
Applies to: ✅ Microsoft Fabric ✅ Azure Data Explorer ✅ Azure Monitor ✅ Microsoft Sentinel
The series_metric_fl() function is a user-defined function (UDF) that selects and retrieves time series of metrics ingested to your database using the Prometheus monitoring system. This function assumes the data stored in your database is structured following the Prometheus data model. Specifically, each record contains:
- timestamp
- metric name
- metric value
- a variable set of labels (
"key":"value"pairs)
Prometheus defines a time series by its metric name and a distinct set of labels. You can retrieve sets of time series using Prometheus Query Language (PromQL) by specifying the metric name and time series selector (a set of labels).
Syntax
T | invoke series_metric_fl(timestamp_col, name_col, labels_col, value_col, metric_name, labels_selector, lookback, offset)
Learn more about syntax conventions.
Parameters
| Name | Type | Required | Description |
|---|---|---|---|
| timestamp_col | string |
✔️ | The name of the column containing the timestamp. |
| name_col | string |
✔️ | The name of the column containing the metric name. |
| labels_col | string |
✔️ | The name of the column containing the labels dictionary. |
| value_col | string |
✔️ | The name of the column containing the metric value. |
| metric_name | string |
✔️ | The metric time series to retrieve. |
| labels_selector | string |
Time series selector string, similar to PromQL. It's a string containing a list of "key":"value" pairs, for example '"key1":"val1","key2":"val2"'. The default is an empty string, which means no filtering. Note that regular expressions are not supported. |
|
| lookback | timespan |
The range vector to retrieve, similar to PromQL. The default is 10 minutes. | |
| offset | datetime |
Offset back from current time to retrieve, similar to PromQL. Data is retrieved from ago(offset)-lookback to ago(offset). The default is 0, which means that data is retrieved up to now(). |
Function definition
You can define the function by either embedding its code as a query-defined function, or creating it as a stored function in your database, as follows:
Define the function using the following let statement. No permissions are required.
Important
A let statement can't run on its own. It must be followed by a tabular expression statement. To run a working example of series_metric_fl(), see Examples.
let series_metric_fl=(metrics_tbl:(*), timestamp_col:string, name_col:string, labels_col:string, value_col:string, metric_name:string, labels_selector:string='', lookback:timespan=timespan(10m), offset:timespan=timespan(0))
{
    let selector_d=iff(labels_selector == '', dynamic(['']), split(labels_selector, ','));
    let etime = ago(offset);
    let stime = etime - lookback;
    metrics_tbl
    | extend timestamp = column_ifexists(timestamp_col, datetime(null)), name = column_ifexists(name_col, ''), labels = column_ifexists(labels_col, dynamic(null)), value = column_ifexists(value_col, 0)
    | extend labels = dynamic_to_json(labels)       //  convert to string and sort by key
    | where name == metric_name and timestamp between(stime..etime)
    | order by timestamp asc
    | summarize timestamp = make_list(timestamp), value=make_list(value) by name, labels
    | where labels has_all (selector_d)
};
// Write your query to use the function here.
Examples
The following examples use the invoke operator to run the function.
With specifying selector
To use a query-defined function, invoke it after the embedded function definition.
let series_metric_fl=(metrics_tbl:(*), timestamp_col:string, name_col:string, labels_col:string, value_col:string, metric_name:string, labels_selector:string='', lookback:timespan=timespan(10m), offset:timespan=timespan(0))
{
    let selector_d=iff(labels_selector == '', dynamic(['']), split(labels_selector, ','));
    let etime = ago(offset);
    let stime = etime - lookback;
    metrics_tbl
    | extend timestamp = column_ifexists(timestamp_col, datetime(null)), name = column_ifexists(name_col, ''), labels = column_ifexists(labels_col, dynamic(null)), value = column_ifexists(value_col, 0)
    | extend labels = dynamic_to_json(labels)       //  convert to string and sort by key
    | where name == metric_name and timestamp between(stime..etime)
    | order by timestamp asc
    | summarize timestamp = make_list(timestamp), value=make_list(value) by name, labels
    | where labels has_all (selector_d)
};
demo_prometheus
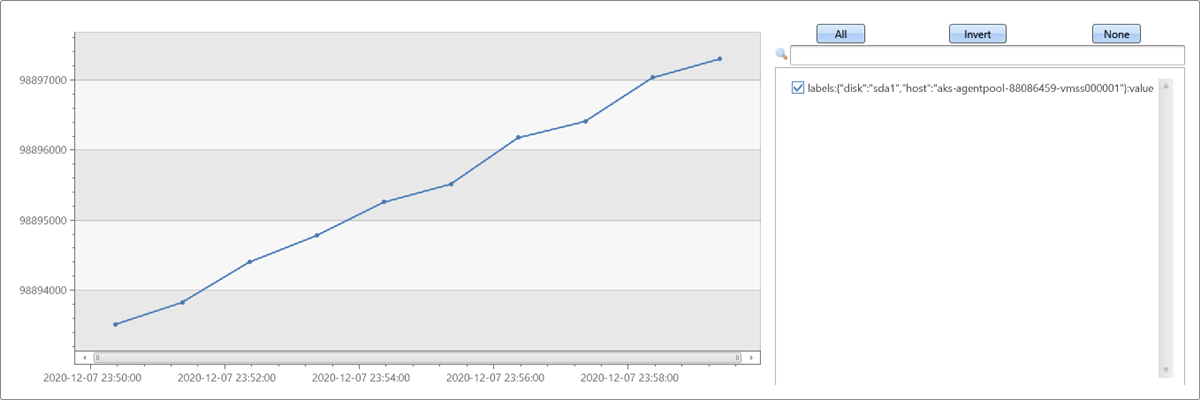
| invoke series_metric_fl('TimeStamp', 'Name', 'Labels', 'Val', 'writes', '"disk":"sda1","host":"aks-agentpool-88086459-vmss000001"', offset=now()-datetime(2020-12-08 00:00))
| render timechart with(series=labels)
Output

Without specifying selector
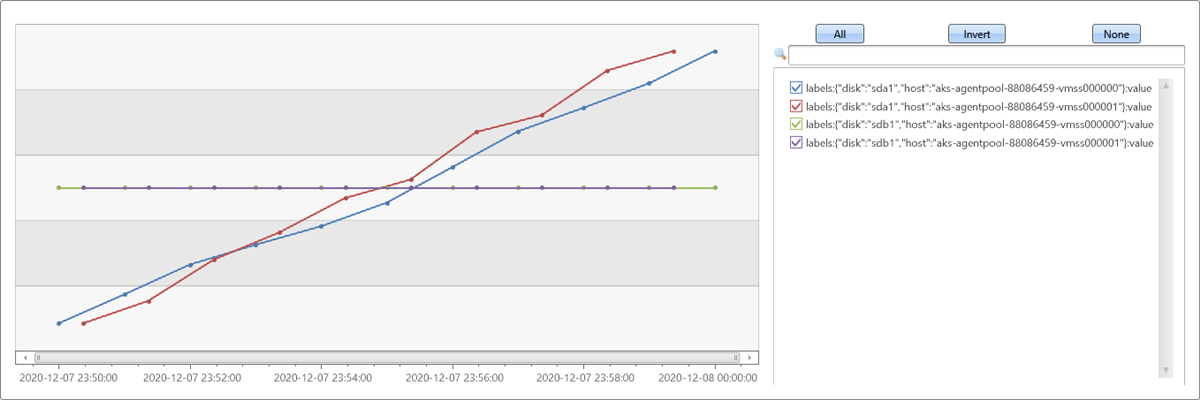
The following example doesn't specify selector, so all 'writes' metrics are selected. This example assumes that the function is already installed, and uses alternative direct calling syntax, specifying the input table as the first parameter:
To use a query-defined function, invoke it after the embedded function definition.
let series_metric_fl=(metrics_tbl:(*), timestamp_col:string, name_col:string, labels_col:string, value_col:string, metric_name:string, labels_selector:string='', lookback:timespan=timespan(10m), offset:timespan=timespan(0))
{
    let selector_d=iff(labels_selector == '', dynamic(['']), split(labels_selector, ','));
    let etime = ago(offset);
    let stime = etime - lookback;
    metrics_tbl
    | extend timestamp = column_ifexists(timestamp_col, datetime(null)), name = column_ifexists(name_col, ''), labels = column_ifexists(labels_col, dynamic(null)), value = column_ifexists(value_col, 0)
    | extend labels = dynamic_to_json(labels)       //  convert to string and sort by key
    | where name == metric_name and timestamp between(stime..etime)
    | order by timestamp asc
    | summarize timestamp = make_list(timestamp), value=make_list(value) by name, labels
    | where labels has_all (selector_d)
};
series_metric_fl(demo_prometheus, 'TimeStamp', 'Name', 'Labels', 'Val', 'writes', offset=now()-datetime(2020-12-08 00:00))
| render timechart with(series=labels, ysplit=axes)
Output
