Walkthrough: Create custom financial reports
The examples in this article describe how to create the following reports:
- Example 1 creates a Trial Balance report
- Example 2 creates a Balance Sheet report
- Example 3 creates an Income Statement report
Note
The examples are based on the demonstration data that Business Central provides for its CRONUS demonstration company.
Tip
Formulas are expressed as a row number reference, such as "R" or "CA" (current assets), which adds all accounts with row number "R" or "CA."
Example 1: Trial Balance
In this example, we have a new financial report called Trial Balance and a new row definition called TB.

Open the new Trial Balance report.
Open the TB row definition, and choose Insert.
Choose the Insert G/L Accounts action to open the G/L Accounts page.
Filter the Account Type column to Posting.
Tip
To quickly apply the filter, choose any row that has Posting in the Account Type column, and then right-click the Account Type column header and choose Filter to this value.
On the first line, choose Show more options
 , and then choose Select more.
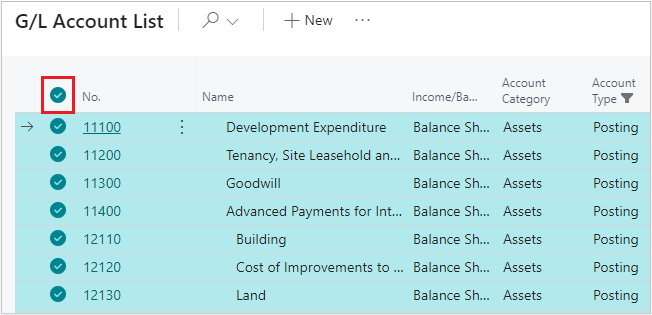
Select all lines by choosing the radio button next to the first column header.

Choose OK to assign all general ledger accounts with a totaling type of Posting to your row definition.
Tip
To sum the results of all lines, add a formula on the last line of the row definition. Because this is a trial balance report, the expected result is zero.
Your trial balance report is complete. To view the report, choose the report on the Financial Reporting page, and then choose View Financial Report. Choose the column definition you prefer for the report. Often used column definitions for a trial balance report are Balance Only, M-Balance, and Default.
Tip
If you add a new general ledger account to the chart of accounts, you must update your row definition to include it. Otherwise, your trial balance report won't balance to zero.
Example 2: Balance Sheet
In this example, we have a new financial report called Balance Sheet and a new row definition called BS.

- Open the Balance Sheet report.
- Open the BS row definition.
- Map the accounts as shown in the following table. This example maps the balance sheet to the chart of accounts in the CRONUS demonstration company.
| Row No. | Description | Totaling Type | Totaling | Row Type | Bold |
|---|---|---|---|---|---|
| Current Assets | Formula | Balance at Date | Yes | ||
| CA | Cash | Posting Accounts | 18000..18999 | Balance at Date | |
| CA | Accounts Receivable | Posting Accounts | 15000..15999 | Balance at Date | |
| CA | Other Receivables | Posting Accounts | 13000..13999 | Balance at Date | |
| CA | Inventory | Posting Accounts | 14000..14999 | Balance at Date | |
| CA | Prepaid Expenses | Posting Accounts | 16000..16999 | Balance at Date | |
| CA | Other Current Assets | Posting Accounts | 100000..11999 | Balance at Date | |
| F1 | Total Current Assets | Formula | Balance at Date | ||
| Formula | Balance at Date | ||||
| Long Term Assets | Balance at Date | Yes | |||
| LTA | Fixed Assets | Posting Accounts | 10000..12899 | Balance at Date | |
| LTA | Accumulated Depreciation | Posting Accounts | 12900..12999 | Balance at Date | |
| LTA | Other Long Term Assets | Posting Accounts | 17000..17999 | 19000..19999 | Balance at Date |
| F2 | Total Long Term Assets | Formula | LTA | Balance at Date | Yes |
| Formula | Balance at Date | ||||
| F3 | Total Assets | F1+F2 | Balance at Date |
The following table describes the fields on the Row Definition page.
| Field | Description |
|---|---|
| Row No. | Alphanumeric codes are used for each section. The codes let you group by row number when you use formulas. Groupings help make formulas shorter and more simple. Each formula line is labeled with an alphanumeric code for easy identification. |
| Description | Used to hold the words to label each row of the report. |
| Totaling type | Formula is used in three ways: * To add the results of rows together. * When combined with a section header or total. * When inserting a blank row into the report. Posting accounts are used to indicate that the row pulls the result of posted transactions based on the accounts listed in the Totaling column. |
| Totaling | Contains either a range of accounts shown as 10000..11999, or multiple nonconsecutive ranges of accounts shown as 17000..17999|19000..19999. Formulas are expressed as a row number reference, such as CA, which adds all accounts with Row No. of CA. Following the general accounting convention of displaying financial report lines in the order of liquidity, general ledger accounts initially appear out of order. Notice that accounts show in the ranges created for each line. Totaling ranges let the report update dynamically when you add a new general ledger account to your chart of accounts. |
| Row type | Balance at Date is used for Balance Sheet reports. |
| Bold | Section headers and totals are set to Bold so they stand out. |
Tip
This example shows a summarized balance sheet, where each line is a group of related balance sheet accounts. Your report’s level of summarization is up to you. Good financial report design tries to provide enough detail to tell the story of financial performance without detailing every account. Avoid creating a balance sheet that is a categorized trial balance. It can be hard for people to digest such a large amount of information.
Continue to add balance sheet sections as shown in the following table. You can incorporate your own account groupings to create or replicate your company’s method of displaying accounts.
The last line of this report is a check figure that the report complies with the accounting equation where Assets=Liabilities+Equity. The result of this check figure should be zero. If it isn't zero, it's a good indication that there's a problem:
- Some accounts aren't included in the report.
- Accounts might be included more than once.
- A formula in the report isn't calculating correctly.
| Row No. | Description | Totaling Type | Totaling | Row Type | Bold |
|---|---|---|---|---|---|
| Current Liabilities | Formula | Balance at Date | Yes | ||
| CL | Accounts Payable | Posting Accounts | 22100..22399 | Balance at Date | |
| CL | Accrued Payroll | Posting Accounts | 23500..25399 | 26100..26399 | Balance at Date |
| CL | Accrued Tax | Posting Accounts | 23100..23499 | Balance at Date | |
| CL | Accrued Other | Posting Accounts | 26400..29999 | Balance at Date | |
| CL | Other Current Liabilities | Posting Accounts | 22400..23099 | 25400..26099 | Balance at Date |
| F4 | Total Current Liabilities | Formula | CL | Balance at Date | Yes |
| Formula | Balance at Date | ||||
| Long Term Liabilities | Posting Accounts | Balance at Date | Yes | ||
| LTL | Notes Payable | Posting Accounts | 20000..21299 | Balance at Date | |
| LTL | Other Long Term Liabilities | Posting Accounts | 21300..22099 | Balance at Date | |
| F5 | Total Long Term Liabilities | Formula | LTL | Balance at Date | Yes |
| Formula | Balance at Date | ||||
| F6 | Total Liabilities | Formula | F4+F5 | Balance at Date | Yes |
| Formula | Balance at date | ||||
| Equity | Formula | Balance at Date | |||
| E | Common Stock | Posting Accounts | 30000..30299 | Balance at Date | |
| E | Retained Earnings | Posting Accounts | 30300..39999 | Balance at Date | |
| E | Current Year Earnings | Posting Accounts | 40000..99999 | Balance at Date | |
| F7 | Total Equity | Formula | E | Balance at Date | |
| Formula | Balance at Date | ||||
| F8 | Total Liabilities and Equity | Formula | F6+F7 | Balance at Date | Yes |
| Formula | Balance at Date | ||||
| F9 | Check Figure | Formula | F3+F8 | Balance at Date |
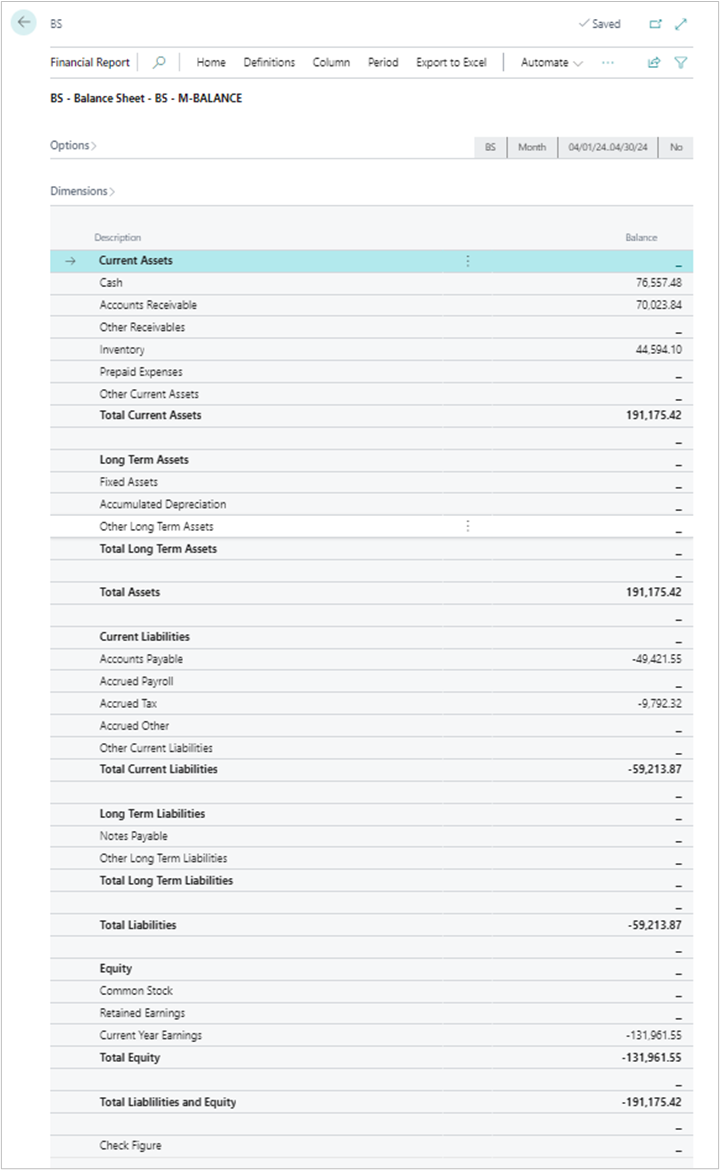
Your balance sheet financial report is complete. To view the report, choose the report on the Financial Reporting page and select View Financial Report. Select any column definition to use with this report. The column definitions that are typically used for a balance sheet are Balance Only, M-Balance, and Default. You can also create a new column definition if you want.
The following image shows the structure of the report in this example.

Example 3: Income Statement
In this example, we have a new financial report called Income Statement and a new row definition called IS.

- Open the Income Statement report.
- Open the IS row definition.
- Map the accounts as shown in the following table. This example maps the balance sheet to the chart of accounts in the CRONUS demonstration company.
| Row No. | Description | Totaling Type | Totaling | Row Type | Bold |
|---|---|---|---|---|---|
| Revenue | Formula | Net Change | Yes | ||
| R | Product Revenue | Posting Accounts | 40000..40209 | Net Change | |
| R | Job Revenue | Posting Accounts | 40410..40429 | Net Change | |
| R | Services Revenue | Posting Accounts | 40210..40309 | 40430..40909 | Net Change |
| R | Other Revenue | Posting Accounts | 40310..40409 | 40920..40939 | Net Change |
| R | Discounts and Returns | Posting Accounts | 40910..40919 | 40940..49999 | Net Change |
| F1 | Total Revenue | Formula | R | Net Change | Yes |
| Formula | Net Change | ||||
| Cost of Goods | Formula | Net Change | |||
| C | Materials | Posting Accounts | 50000..50209 | Net Change | |
| C | Labor | Posting Accounts | 50210..59999 | Net Change | |
| C | Manufacturing Overhead | Posting Accounts | 60000..69999 | Net Change | |
| F2 | Total Cost of Goods | Formula | C | Net Change | Yes |
| Formula | Net Change | ||||
| F3 | Gross Margin USD | Formula | F1+F2 | Net Change | Yes |
| F4 | Gross Margin % | Formula | F3/F1*100 | Net Change | Yes |
The following table describes the fields on the Row Definition page.
| Field | Description |
|---|---|
| Row No. | Alphanumeric codes are used for each section. The codes let you group by row number when you use formulas. Groupings help make formulas shorter and more simple. Each formula line is labeled with an alphanumeric code for easy identification. |
| Description | Used to hold the words to label each row of the report. |
| Totaling type | Formula is used in three ways: * To add the results of rows together. * When combined with a section header or total. * When inserting a blank row into the report. Posting accounts are used to indicate that the row pulls the result of posted transactions based on the accounts listed in the Totaling column. |
| Totaling | Contains either a range of accounts shown as 40000..40209, or multiple nonconsecutive ranges of accounts shown as 40210..40309|40430..40909. Formulas are expressed as a row number reference, such as CA, which adds all accounts with Row No. of CA. Following the general accounting convention of displaying financial report lines in the order of liquidity, general ledger accounts initially appear out of order. Notice that accounts show in the ranges created for each line. Totaling ranges let the report update dynamically when you add a new general ledger account to your chart of accounts. |
| Row type | Balance at Date is used for Balance Sheet reports. |
| Bold | Section headers and totals are set to Bold so they stand out. |
Tip
This example shows a summarized income statement, where each line is a group of related incomes statement accounts. Your report’s level of summarization is up to you. Good financial report design attempts to provide enough detail to tell the story of financial performance without detailing every account. Avoid creating an income statement that's a categorized trial balance. It can be hard for people to digest such a large amount of information.
Continue to add income statement sections as shown in the following table. You can incorporate your own account groupings to create or replicate your company’s method of displaying accounts.
The last line of this report is a check figure that the report complies with the accounting equation where Assets = Liabilities + Equity. The result of this check figure should always be zero. If it isn't zero, it's a good indication that there's a problem:
- Some accounts aren't included in the report.
- Accounts might be included more than once.
- A formula in the report isn't calculating correctly.
| Row No. | Description | Totaling Type | Totaling | Row Type | Bold |
|---|---|---|---|---|---|
| Operating Expense | Formula | Net Change | Yes | ||
| OE | Salaries and Wages | Posting Accounts | 70000..72109 | Net Change | |
| OE | Employee Benefits | Posting Accounts | 72110..73299 | Net Change | |
| OE | Employee Insurance | Posting Accounts | 73300..74109 | Net Change | |
| OE | Employee Tax | Posting Accounts | 74110..79999 | Net Change | |
| OE | Depreciation | Posting Accounts | 80000..89999 | Net Change | |
| OE | Other Expense | Posting Accounts | 90000..99999 | Net Change | |
| F5 | Total Operating Expense | Formula | OE | Net Change | Yes |
| Formula | Net Change | ||||
| F6 | Net (Income) / Loss | Formula | F1+F2+F5 | Net Change | |
| Formula | Net Change | ||||
| F7 | Total of Income Statement | Posting Accounts | 40000..99999 | Net Change | |
| F8 | Check Figure | Formula | F6-F7 | Net Change |
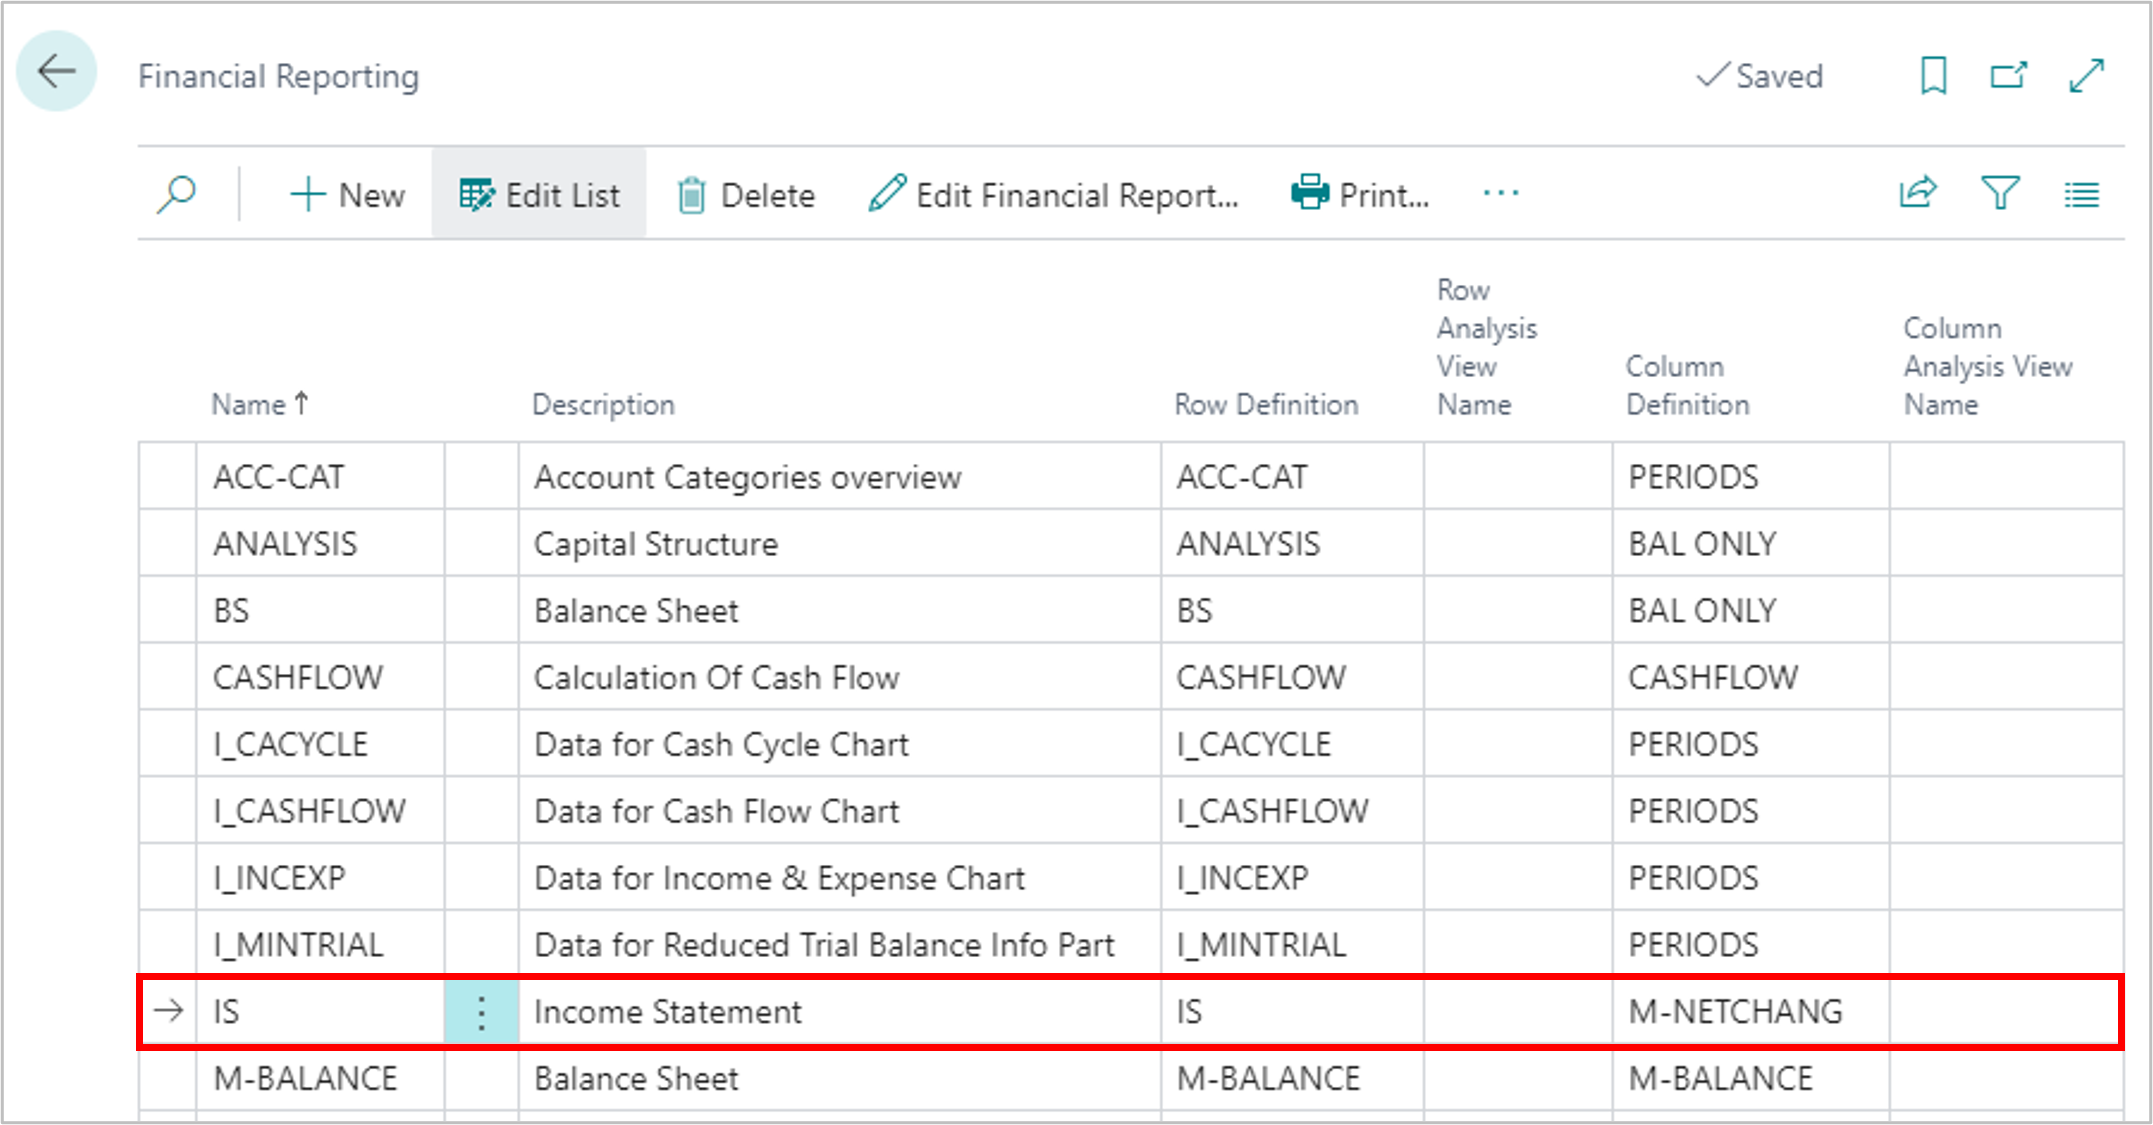
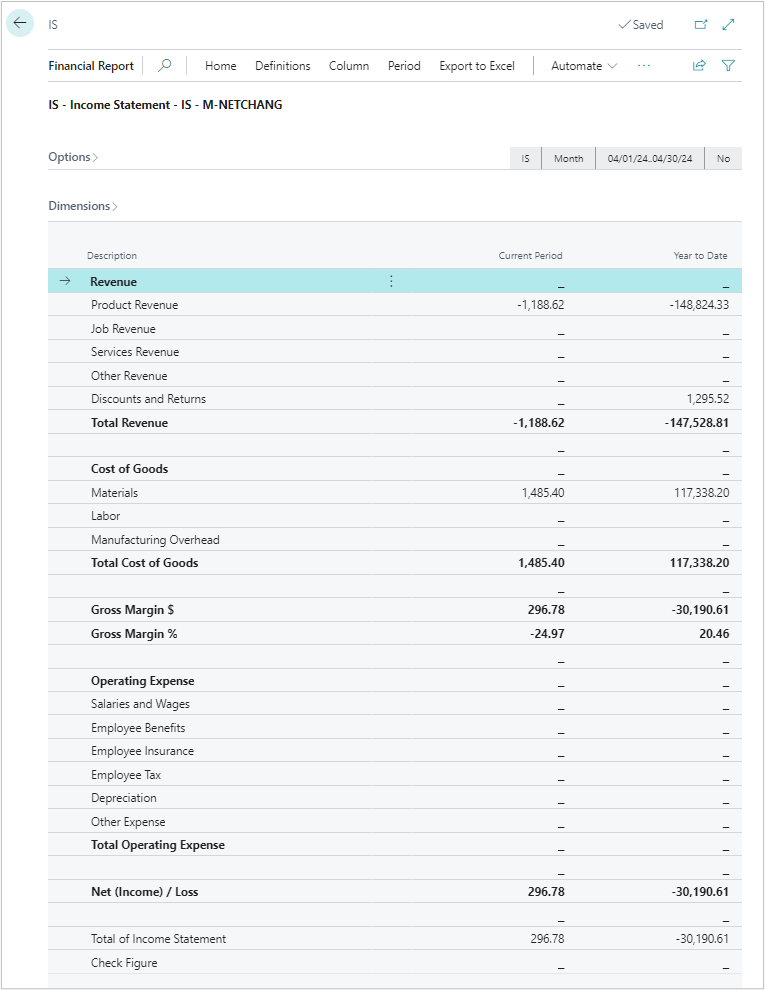
Your income statement report is complete. To view the report, choose the report on the Financial Reporting page, and select View Financial Report. Select any column definition you like to use with this report. The often used column definitions for an income statement are M-NetChang and PTD + YTD. You can also create a new column definition.
The following image shows the structure of the report in this example.

See also
Primary capabilities of financial reporting
Walkthrough: Make cash flow forecasts using financial reports
Prepare financial reporting with financial data and account categories
Financial analytics overview