Networking metrics in .NET
Metrics are numerical measurements reported over time. They are typically used to monitor the health of an app and generate alerts.
Starting with .NET 8, the System.Net.Http and the System.Net.NameResolution components are instrumented to publish metrics using .NET's new System.Diagnostics.Metrics API.
These metrics were designed in cooperation with OpenTelemetry to make sure they're consistent with the standard and work well with popular tools like Prometheus and Grafana.
They are also multi-dimensional, meaning that measurements are associated with key-value pairs called tags (a.k.a. attributes or labels) that allow data to be categorized for analysis.
Tip
For a comprehensive list of all built-in instruments together with their attributes, see System.Net metrics.
Collect System.Net metrics
There are two parts to using metrics in a .NET app:
- Instrumentation: Code in .NET libraries takes measurements and associates these measurements with a metric name. .NET and ASP.NET Core include many built-in metrics.
- Collection: A .NET app configures named metrics to be transmitted from the app for external storage and analysis. Some tools might perform configuration outside the app using configuration files or a UI tool.
This section demonstrates various methods to collect and view System.Net metrics.
Example app
For the sake of this tutorial, create a simple app that sends HTTP requests to various endpoints in parallel.
dotnet new console -o HelloBuiltinMetrics
cd ..\HelloBuiltinMetrics
Replace the contents of Program.cs with the following sample code:
using System.Net;

string[] uris = ["http://example.com", "http://httpbin.org/get", "https://example.com", "https://httpbin.org/get"];
using HttpClient client = new()
{
    DefaultRequestVersion = HttpVersion.Version20
};

Console.WriteLine("Press any key to start.");
Console.ReadKey();

while (!Console.KeyAvailable)
{
    await Parallel.ForAsync(0, Random.Shared.Next(20), async (_, ct) =>
    {
        string uri = uris[Random.Shared.Next(uris.Length)];
        byte[] bytes = await client.GetByteArrayAsync(uri, ct);
        await Console.Out.WriteLineAsync($"{uri} - received {bytes.Length} bytes.");
    });
}
View metrics with dotnet-counters
dotnet-counters is a cross-platform performance monitoring tool for ad-hoc health monitoring and first-level performance investigation.
dotnet tool install --global dotnet-counters
When running against a .NET 8+ process, dotnet-counters enables the instruments defined by the --counters argument and displays the measurements. It continuously refreshes the console with the latest numbers:
dotnet-counters monitor --counters System.Net.Http,System.Net.NameResolution -n HelloBuiltinMetrics
View metrics in Grafana with OpenTelemetry and Prometheus
Overview
- Is a vendor-neutral, open-source project supported by the Cloud Native Computing Foundation.
- Standardizes generating and collecting telemetry for cloud-native software.
- Works with .NET using the .NET metric APIs.
- Is endorsed by Azure Monitor and many APM vendors.
This tutorial shows one of the integrations available for OpenTelemetry metrics using the OSS Prometheus and Grafana projects. The metrics data flow consists of the following steps:
The .NET metric APIs record measurements from the example app.
The OpenTelemetry library running in the app aggregates the measurements.
The Prometheus exporter library makes the aggregated data available via an HTTP metrics endpoint. 'Exporter' is what OpenTelemetry calls the libraries that transmit telemetry to vendor-specific backends.
A Prometheus server:
- Polls the metrics endpoint.
- Reads the data.
- Stores the data in a database for long-term persistence. Prometheus refers to reading and storing data as scraping an endpoint.
- Can run on a different machine.
The Grafana server:
- Queries the data stored in Prometheus and displays it on a web-based monitoring dashboard.
- Can run on a different machine.
Configure the example app to use OpenTelemetry's Prometheus exporter
Add a reference to the OpenTelemetry Prometheus exporter to the example app:
dotnet add package OpenTelemetry.Exporter.Prometheus.HttpListener --prerelease
Note
This tutorial uses a pre-release build of OpenTelemetry's Prometheus support available at the time of writing.
Update Program.cs with OpenTelemetry configuration:
using OpenTelemetry.Metrics;
using OpenTelemetry;
using System.Net;

using MeterProvider meterProvider = Sdk.CreateMeterProviderBuilder()
    .AddMeter("System.Net.Http", "System.Net.NameResolution")
    .AddPrometheusHttpListener(options => options.UriPrefixes = new string[] { "http://localhost:9184/" })
    .Build();

string[] uris = ["http://example.com", "http://httpbin.org/get", "https://example.com", "https://httpbin.org/get"];
using HttpClient client = new()
{
    DefaultRequestVersion = HttpVersion.Version20
};

while (!Console.KeyAvailable)
{
    await Parallel.ForAsync(0, Random.Shared.Next(20), async (_, ct) =>
    {
        string uri = uris[Random.Shared.Next(uris.Length)];
        byte[] bytes = await client.GetByteArrayAsync(uri, ct);
        await Console.Out.WriteLineAsync($"{uri} - received {bytes.Length} bytes.");
    });
}
In the preceding code:
AddMeter("System.Net.Http", "System.Net.NameResolution")configures OpenTelemetry to transmit all the metrics collected by the built-inSystem.Net.HttpandSystem.Net.NameResolutionmeters.AddPrometheusHttpListenerconfigures OpenTelemetry to expose Prometheus' metrics HTTP endpoint on port9184.
Note
This configuration differs for ASP.NET Core apps, where metrics are exported with OpenTelemetry.Exporter.Prometheus.AspNetCore instead of HttpListener. See the related ASP.NET Core example.
Run the app and leave it running so measurements can be collected:
dotnet run
Set up and configure Prometheus
Follow the Prometheus first steps to set up a Prometheus server and confirm it is working.
Modify the prometheus.yml configuration file so that Prometheus scrapes the metrics endpoint that the example app is exposing. Add the following highlighted text in the scrape_configs section:
# my global config
global:
  scrape_interval: 15s # Set the scrape interval to every 15 seconds. Default is every 1 minute.
  evaluation_interval: 15s # Evaluate rules every 15 seconds. The default is every 1 minute.
  # scrape_timeout is set to the global default (10s).

# Alertmanager configuration
alerting:
  alertmanagers:
    - static_configs:
        - targets:
          # - alertmanager:9093

# Load rules once and periodically evaluate them according to the global 'evaluation_interval'.
rule_files:
  # - "first_rules.yml"
  # - "second_rules.yml"

# A scrape configuration containing exactly one endpoint to scrape:
# Here it's Prometheus itself.
scrape_configs:
  # The job name is added as a label `job=<job_name>` to any timeseries scraped from this config.
  - job_name: "prometheus"

    # metrics_path defaults to '/metrics'
    # scheme defaults to 'http'.

    static_configs:
      - targets: ["localhost:9090"]

  - job_name: 'OpenTelemetryTest'
    scrape_interval: 1s # poll very quickly for a more responsive demo
    static_configs:
      - targets: ['localhost:9184']
Start prometheus
Reload the configuration or restart the Prometheus server.
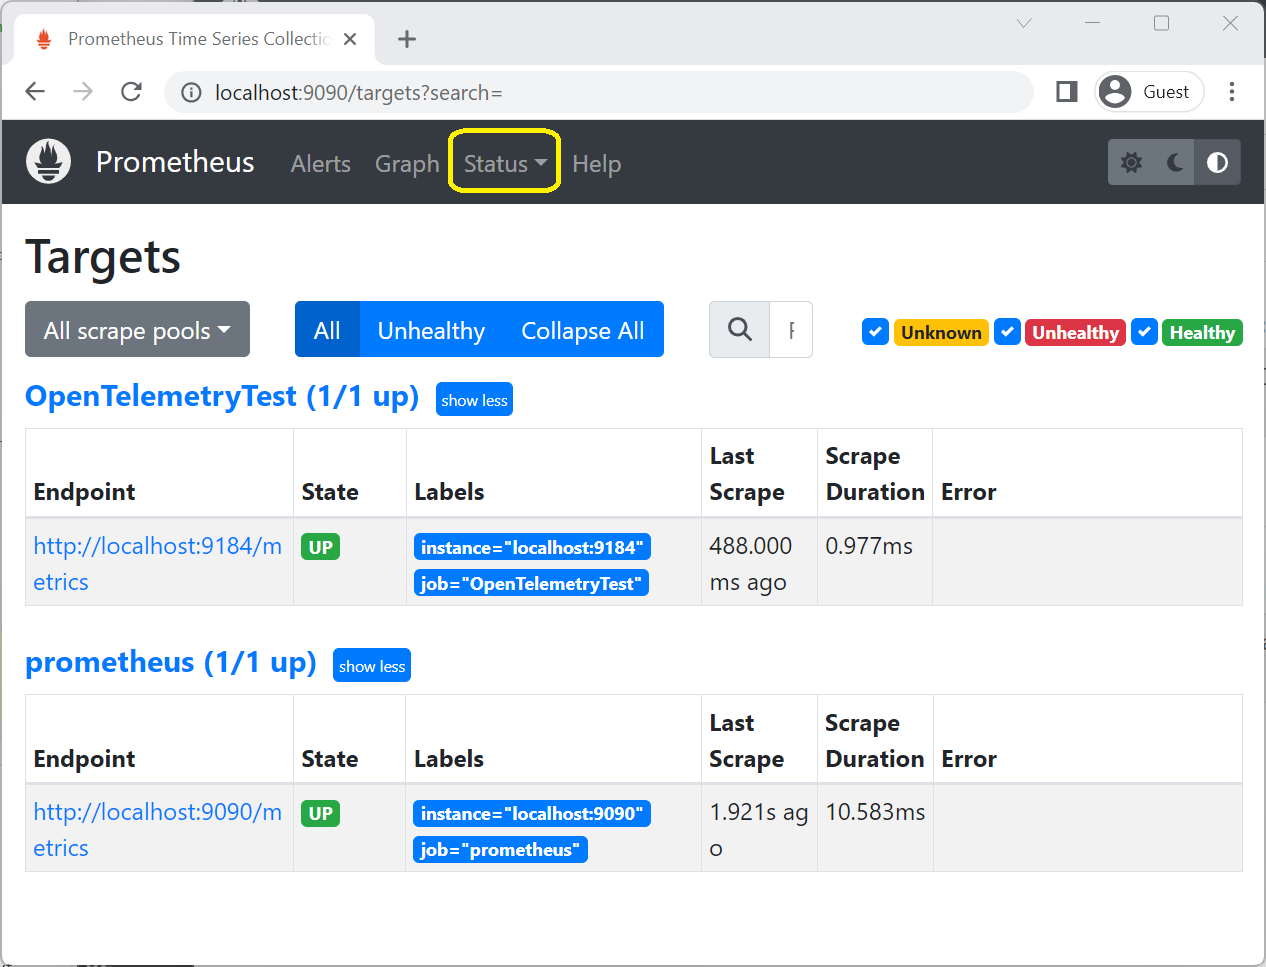
Confirm that OpenTelemetryTest is in the UP state in the Status > Targets page of the Prometheus web portal.

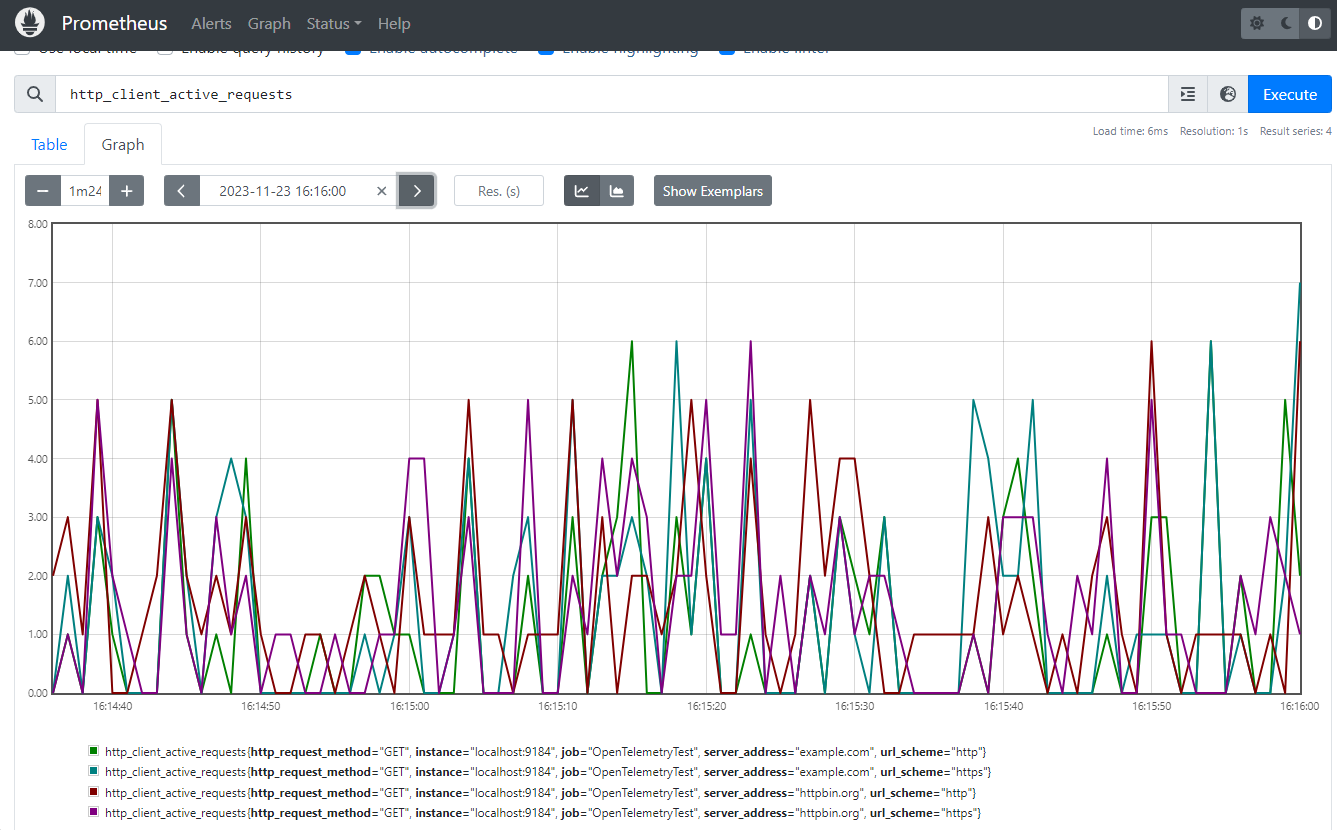
On the Graph page of the Prometheus web portal, enter
httpin the expression text box and selecthttp_client_active_requests. In the graph tab, Prometheus shows the value of the
 http.client.active_requestscounter that's emitted by the example app.
Show metrics on a Grafana dashboard
Follow the standard instructions to install Grafana and connect it to a Prometheus data source.
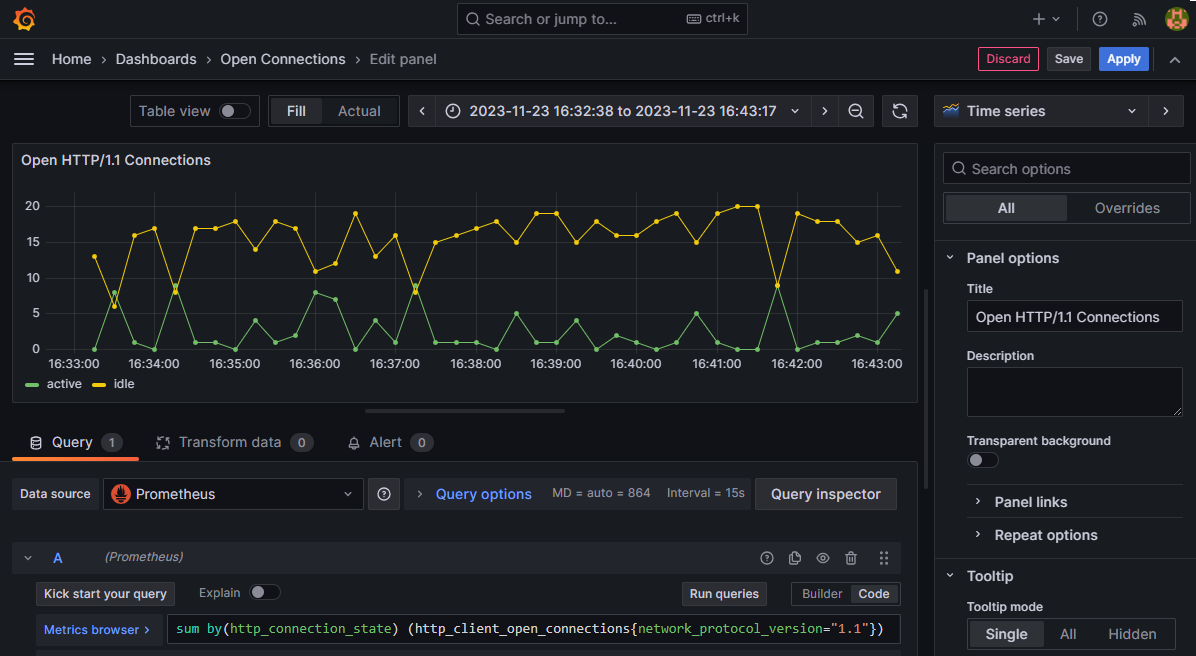
Create a Grafana dashboard by selecting the + icon on the top toolbar then selecting Dashboard. In the dashboard editor that appears, enter Open HTTP/1.1 Connections in the Title box and the following query in the PromQL expression field:
sum by(http_connection_state) (http_client_open_connections{network_protocol_version="1.1"})

- Select Apply to save and view the new dashboard. It displays the number of active vs idle HTTP/1.1 connections in the pool.
Enrichment
Enrichment is the addition of custom tags (a.k.a. attributes or labels) to a metric. This is useful if an app wants to add a custom categorization to dashboards or alerts built with metrics.
The http.client.request.duration instrument supports enrichment by registering callbacks with the HttpMetricsEnrichmentContext.
Note that this is a low-level API and a separate callback registration is needed for each HttpRequestMessage.
A simple way to do the callback registration at a single place is to implement a custom DelegatingHandler. This will allow you to intercept and modify the requests before they are forwarded to the inner handler and sent to the server:
using System.Net.Http.Metrics;

using HttpClient client = new(new EnrichmentHandler() { InnerHandler = new HttpClientHandler() });

await client.GetStringAsync("https://httpbin.org/response-headers?Enrichment-Value=A");
await client.GetStringAsync("https://httpbin.org/response-headers?Enrichment-Value=B");

sealed class EnrichmentHandler : DelegatingHandler
{
    protected override Task<HttpResponseMessage> SendAsync(HttpRequestMessage request, CancellationToken cancellationToken)
    {
        HttpMetricsEnrichmentContext.AddCallback(request, static context =>
        {
            if (context.Response is not null) // Response is null when an exception occurs.
            {
                // Use any information available on the request or the response to emit custom tags.
                string? value = context.Response.Headers.GetValues("Enrichment-Value").FirstOrDefault();
                if (value != null)
                {
                    context.AddCustomTag("enrichment_value", value);
                }
            }
        });
        return base.SendAsync(request, cancellationToken);
    }
}
If you're working with IHttpClientFactory, you can use AddHttpMessageHandler to register the EnrichmentHandler:
using Microsoft.Extensions.DependencyInjection;
using Microsoft.Extensions.Options;
using System.Net.Http.Metrics;

ServiceCollection services = new();
services.AddHttpClient(Options.DefaultName).AddHttpMessageHandler(() => new EnrichmentHandler());

ServiceProvider serviceProvider = services.BuildServiceProvider();
HttpClient client = serviceProvider.GetRequiredService<HttpClient>();

await client.GetStringAsync("https://httpbin.org/response-headers?Enrichment-Value=A");
await client.GetStringAsync("https://httpbin.org/response-headers?Enrichment-Value=B");
Note
For performance reasons, the enrichment callback is only invoked when the http.client.request.duration instrument is enabled, meaning that something should be collecting the metrics.
This can be dotnet-monitor, Prometheus exporter, a MeterListener, or a MetricCollector<T>.
IMeterFactory and IHttpClientFactory integration
HTTP metrics were designed with isolation and testability in mind. These aspects are supported by the use of IMeterFactory, which enables publishing metrics by a custom Meter instance in order to keep Meters isolated from each other.
By default, all metrics are emitted by a global Meter internal to the System.Net.Http library. This behavior can be overriden by assigning a custom IMeterFactory instance to SocketsHttpHandler.MeterFactory or HttpClientHandler.MeterFactory.
Note
The Meter.Name is System.Net.Http for all metrics emitted by HttpClientHandler and SocketsHttpHandler.
When working with Microsoft.Extensions.Http and IHttpClientFactory on .NET 8+, the default IHttpClientFactory implementation automatically picks the IMeterFactory instance registered in the IServiceCollection and assigns it to the primary handler it creates internally.
Note
Starting with .NET 8, the AddHttpClient method automatically calls AddMetrics to initialize the metrics services and register the default IMeterFactory implementation with IServiceCollection. The default IMeterFactory caches Meter instances by name, meaning that there will be one Meter with the name System.Net.Http per IServiceCollection.
Test metrics
The following example demonstrates how to validate built-in metrics in unit tests using xUnit, IHttpClientFactory, and MetricCollector<T> from the Microsoft.Extensions.Diagnostics.Testing NuGet package:
[Fact]
public async Task RequestDurationTest()
{
    // Arrange
    ServiceCollection services = new();
    services.AddHttpClient();
    ServiceProvider serviceProvider = services.BuildServiceProvider();
    var meterFactory = serviceProvider.GetService<IMeterFactory>();
    var collector = new MetricCollector<double>(meterFactory,
        "System.Net.Http", "http.client.request.duration");
    var client = serviceProvider.GetRequiredService<HttpClient>();

    // Act
    await client.GetStringAsync("http://example.com");

    // Assert
    await collector.WaitForMeasurementsAsync(minCount: 1).WaitAsync(TimeSpan.FromSeconds(5));
    Assert.Collection(collector.GetMeasurementSnapshot(),
        measurement =>
        {
            Assert.Equal("http", measurement.Tags["url.scheme"]);
            Assert.Equal("GET", measurement.Tags["http.request.method"]);
        });
}
Metrics vs. EventCounters
Metrics are more feature-rich than EventCounters, most notably because of their multi-dimensional nature. This multi-dimensionality lets you create sophisticated queries in tools like Prometheus and get insights on a level that's not possible with EventCounters.
Nevertheless, as of .NET 8, only the System.Net.Http and the System.Net.NameResolutions components are instrumented using Metrics, meaning that if you need counters from the lower levels of the stack such as System.Net.Sockets or System.Net.Security, you must use EventCounters.
Moreover, there are some semantical differences between Metrics and their matching EventCounters.
For example, when using HttpCompletionOption.ResponseContentRead, the current-requests EventCounter considers a request to be active until the moment when the last byte of the request body has been read.
Its metrics counterpart http.client.active_requests doesn't include the time spent reading the response body when counting the active requests.
Need more metrics?
If you have suggestions for other useful information that could be exposed via metrics, create a dotnet/runtime issue.
