Resource monitoring
Resource monitoring involves the continuous measurement of resource utilization over a specified period. The Microsoft.Extensions.Diagnostics.ResourceMonitoring NuGet package offers a collection of APIs tailored for monitoring the resource utilization of your .NET applications.
The IResourceMonitor interface furnishes methods for retrieving real-time information concerning process resource utilization. This interface supports the retrieval of data related to CPU and memory usage and is currently compatible with both Windows and Linux platforms. All resource monitoring diagnostic information is published to OpenTelemetry by default, so there's no need to manually publish this yourself.
In addition, the resource monitoring library reports various diagnostic metrics. For more information, see Diagnostic Metrics: Microsoft.Extensions.Diagnostics.ResourceMonitoring.
Example resource monitoring usage
The following example demonstrates how to use the IResourceMonitor interface to retrieve information about the current process's CPU and memory usage.
using Microsoft.Extensions.DependencyInjection;
using Microsoft.Extensions.Diagnostics.ResourceMonitoring;
using Microsoft.Extensions.Logging;
using Spectre.Console;

var services = new ServiceCollection()
    .AddLogging(static builder => builder.AddConsole())
    .AddResourceMonitoring();

var provider = services.BuildServiceProvider();

var monitor = provider.GetRequiredService<IResourceMonitor>();
The preceding code:
- Instantiates a new ServiceCollection instance, chaining calls to the AddLogging and AddResourceMonitoring extension methods.
- Builds a new ServiceProvider instance from the
ServiceCollectioninstance. - Gets an instance of the IResourceMonitor interface from the
ServiceProviderinstance.
Important
The Microsoft.Extensions.Diagnostics.ResourceMonitoring package assumes that the consumer will register logging providers with the Microsoft.Extensions.Logging package. If you don't register logging, the call to AddResourceMonitoring will throw an exception. Furthermore, you can enable internal library logging by configuring the Debug log level for the Microsoft.Extensions.Diagnostics.ResourceMonitoring category as per the guide.
At this point, with the IResourceMonitor implementation you'll ask for resource utilization with the IResourceMonitor.GetUtilization method. The GetUtilization method returns a ResourceUtilization instance that contains the following information:
- ResourceUtilization.CpuUsedPercentage: CPU usage as a percentage.
- ResourceUtilization.MemoryUsedPercentage: Memory usage as a percentage.
- ResourceUtilization.MemoryUsedInBytes: Memory usage in bytes.
- ResourceUtilization.SystemResources: System resources.
- SystemResources.GuaranteedMemoryInBytes: Guaranteed memory in bytes.
- SystemResources.MaximumMemoryInBytes: Maximum memory in bytes.
- SystemResources.GuaranteedCpuUnits: Guaranteed CPU in units.
- SystemResources.MaximumCpuUnits: Maximum CPU in units.
Extend resource monitoring with Spectre.Console
Extending this example, you can leverage Spectre.Console, a well-regarded .NET library designed to simplify the development of visually appealing, cross-platform console applications. With Spectre, you'll be able to present resource utilization data in a tabular format. The following code illustrates the usage of the IResourceMonitor interface to access details regarding the CPU and memory usage of the current process, then presenting this data in a table:
await StartMonitoringAsync(monitor, token);

async Task StartMonitoringAsync(IResourceMonitor monitor, CancellationToken cancellationToken)
{
    var table = new Table()
        .Centered()
        .Title("Resource Monitoring", new Style(foreground: Color.Purple, decoration: Decoration.Bold))
        .Caption("Updates every three seconds. *GTD: Guaranteed ", new Style(decoration: Decoration.Dim))
        .RoundedBorder()
        .BorderColor(Color.Cyan1)
        .AddColumns(
        [
            new TableColumn("Time").Centered(),
            new TableColumn("CPU %").Centered(),
            new TableColumn("Memory %").Centered(),
            new TableColumn("Memory (bytes)").Centered(),
            new TableColumn("GTD / Max Memory (bytes)").Centered(),
            new TableColumn("GTD / Max CPU (units)").Centered(),
        ]);

    await AnsiConsole.Live(table)
        .StartAsync(async ctx =>
        {
            var window = TimeSpan.FromSeconds(3);
            while (cancellationToken.IsCancellationRequested is false)
            {
                var utilization = monitor.GetUtilization(window);
                var resources = utilization.SystemResources;

                table.AddRow(
                    [
                        $"{DateTime.Now:T}",
                        $"{utilization.CpuUsedPercentage:p}",
                        $"{utilization.MemoryUsedPercentage:p}",
                        $"{utilization.MemoryUsedInBytes:#,#}",
                        $"{resources.GuaranteedMemoryInBytes:#,#} / {resources.MaximumMemoryInBytes:#,#}",
                        $"{resources.GuaranteedCpuUnits} / {resources.MaximumCpuUnits}",
                    ]);

                ctx.Refresh();
                await Task.Delay(window);
            }
        });

    Console.CancelKeyPress += (_, e) =>
    {
        e.Cancel = true;
        cancellationTokenSource.Cancel();
    };
}
The preceding code:
- Creates a cancellation token source and a cancellation token.
- Creates a new
Tableinstance, configuring it with a title, caption, and columns. - Performs a live render of the
Tableinstance, passing in a delegate that will be invoked every three seconds. - Gets the current resource utilization information from the
IResourceMonitorinstance and displays it as a new row in theTableinstance.
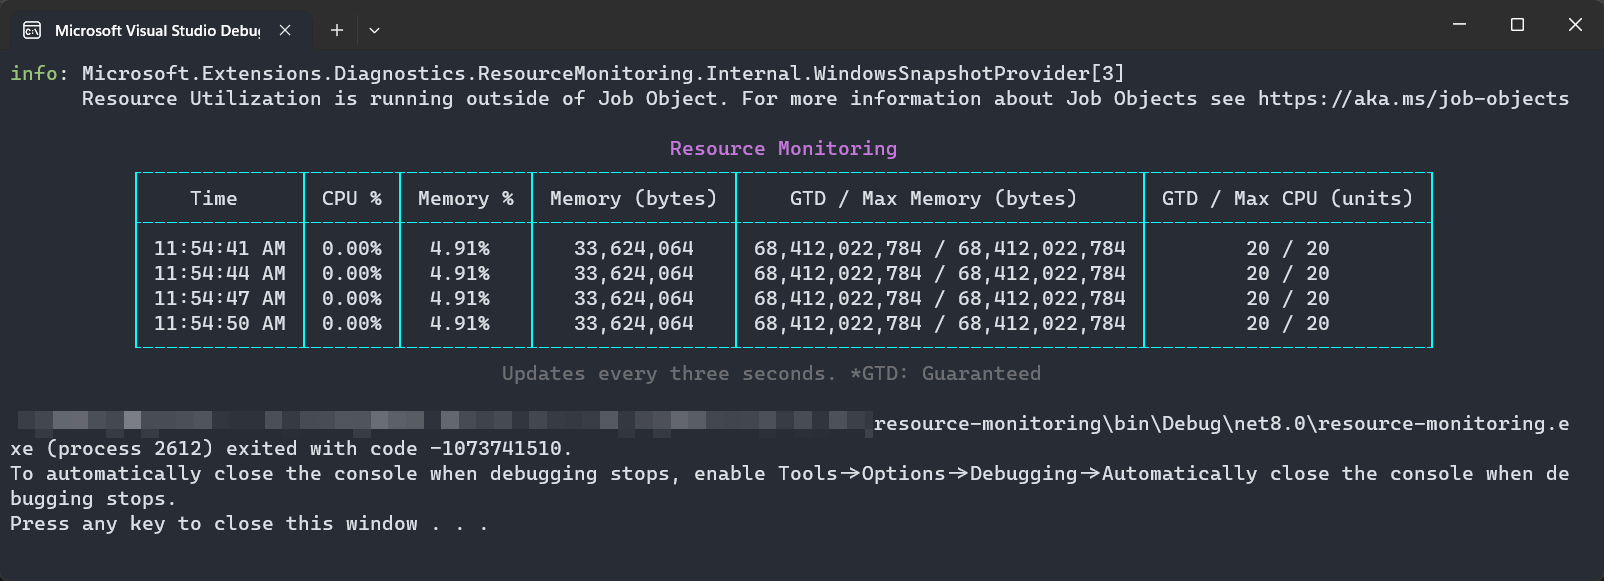
The following is an example of the output from the preceding code:
For the source code of this example, see the Resource monitoring sample.
Kubernetes probes
In addition to resource monitoring, apps that exist within a Kubernetes cluster report their health through diagnostic probes. The Microsoft.Extensions.Diagnostics.Probes NuGet package provides support for Kubernetes probes. It externalizes various health checks that align with various Kubernetes probes, for example:
- Liveness
- Readiness
- Startup
The library communicates the apps current health to a Kubernetes hosting environment. If a process reports as being unhealthy, Kubernetes doesn't send it any traffic, providing the process time to recover or terminate.
To add support for Kubernetes probes, add a package reference to Microsoft.Extensions.Diagnostics.Probes. On an IServiceCollection instance, call AddKubernetesProbes.

