Troubleshoot Microsoft Defender Antivirus performance issues with WPRUI
Tip
First, review common reasons for performance issues such as high CPU usage in Troubleshoot performance issues related to Microsoft Defender Antivirus real-time protection (RTP) or scans (scheduled or on-demand). Then, run the Microsoft Defender Antivirus Performance Analyzer to analyze the cause of high CPU usage in Microsoft Defender Antivirus (Antimalware Service Executable, Microsoft Defender Antivirus service, or MsMpEng.exe). If the Microsoft Defender Antivirus Performance Analyzer doesn't identify the root cause of high CPU utilization, run Processor Monitor to narrow down or determine the root cause of the high CPU utilization in Microsoft Defender Antivirus. The final tool in your toolkit is to run the Windows Performance Recorder UI (WPRUI) or the Windows Performance Recorder (WPR command-line) as discussed in this article.
Capture performance logs using Windows Performance Recorder
Windows Performance Recorder (WPR) is a powerful recording tool that creates Event Tracing for Windows recordings and allows you to include additional information in your submission to Microsoft support.
WPR is part of the Windows Assessment and Deployment Kit (Windows ADK) and can be downloaded from Download and install the Windows ADK. You can also download it as part of the Windows 10 Software Development Kit at Windows 10 SDK.
Alternatively, follow the steps in Capture performance logs using the WPR UI, or use the command-line tool wpr.exe Capture performance logs using the WPR CLI. Both are available in Windows 8 and later versions.
There are two ways to capture the Windows Performance Recorder (WPRUI) trace:
Using the MDE Client Analyzer
Manually
Using the MDE Client Analyzer
Download the MDE Client Analyzer.
Run the MDE Client Analyzer using Live Response or locally.
Tip
Before starting the trace, make sure the issue is reproducible. Additionally, close any applications that don't contribute to the reproduction of the issue.
Run the MDE Client Analyzer with the
-aand-vswitches.PowerShellCopy
C:\Work\tools\MDEClientAnalyzer\MDEClientAnalyzer.cmd -a -v
Manually
Capture performance logs using the WPR UI
Tip
If multiple devices are experiencing this issue, use the one with the most RAM.
Download and install WPR.
Under Windows Kits, right-click Windows Performance Recorder.
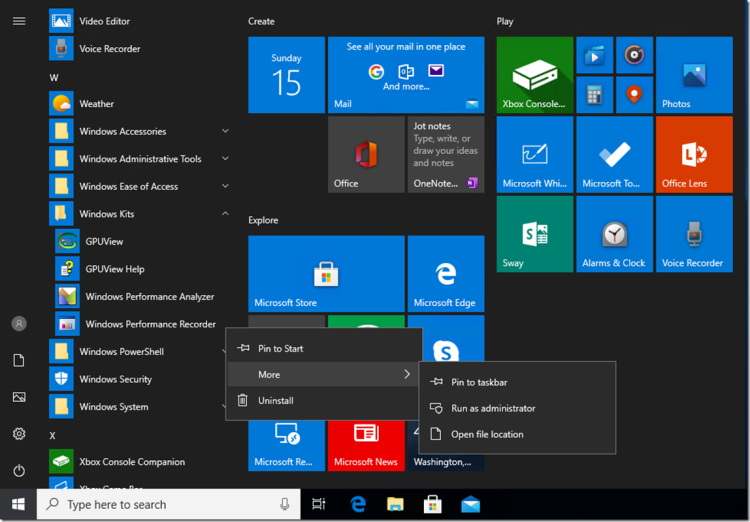
Select More. Select Run as administrator.
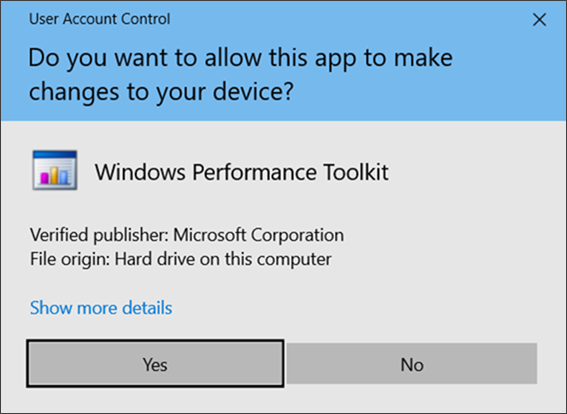
Right-click Yes when the User Account Control dialog box appears.
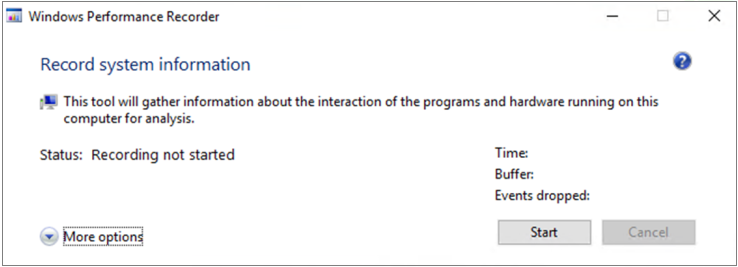
Next, download the Microsoft Defender for Endpoint analysis profile and save as
MDAV.wprpto a folder such asC:\temp.In the WPR dialog box, select More options.
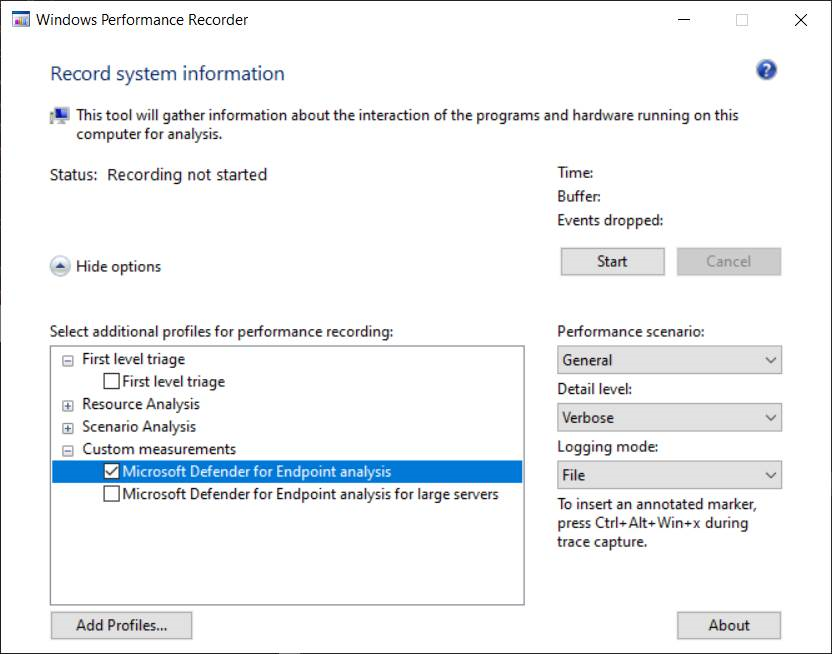
Select Add Profiles... and browse to the path of the
MDAV.wprpfile.A new profile named Microsoft Defender for Endpoint analysis should appear under Custom measurements.
Warning
If your Windows Server has 64 GB of RAM or more, use the custom measurement
Microsoft Defender for Endpoint analysis for large serversinstead ofMicrosoft Defender for Endpoint analysis. Otherwise, your system might consume a high amount of nonpaged pool memory or buffers, leading to system instability. To address this, explore Resource Analysis to choose profiles to add. This custom profile provides the necessary context for in-depth performance analysis.To use the custom measurement Microsoft Defender for Endpoint verbose analysis profile in the WPR UI:
Ensure no profiles are selected under the First-level triage, Resource Analysis and Scenario Analysis groups.
Select Custom measurements.
Select Microsoft Defender for Endpoint analysis.
Select Verbose under Detail level.
Select File or Memory under Logging mode.
Important
Select File to use the file logging mode if you can directly reproduce the performance issue. Most issues fall under this category. However, if you can't directly reproduce the issue, select Memory to use the memory logging mode. This prevents the trace log from inflating excessively due to long run times.
Now you're ready to collect data. Close all unnecessary applications. Select Hide options to keep the space occupied by the WPR window small.
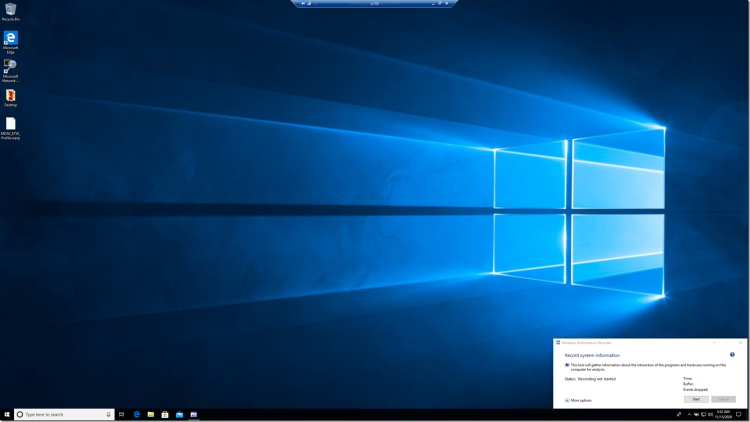
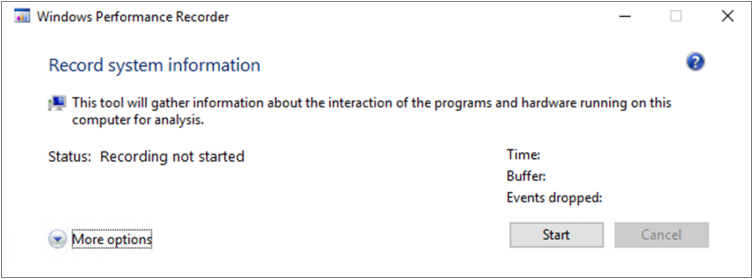
Select Start.
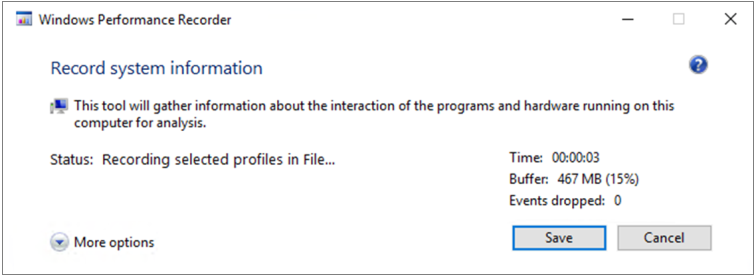
Reproduce the issue.
Tip
Limit the data collection to a maximum of five minutes. Ideally, aim for two to three minutes, as a significant amount of data is being collected.
Select Save.
Fill in Type in a detailed description of the problem: with information about the problem and how you reproduced the issue.
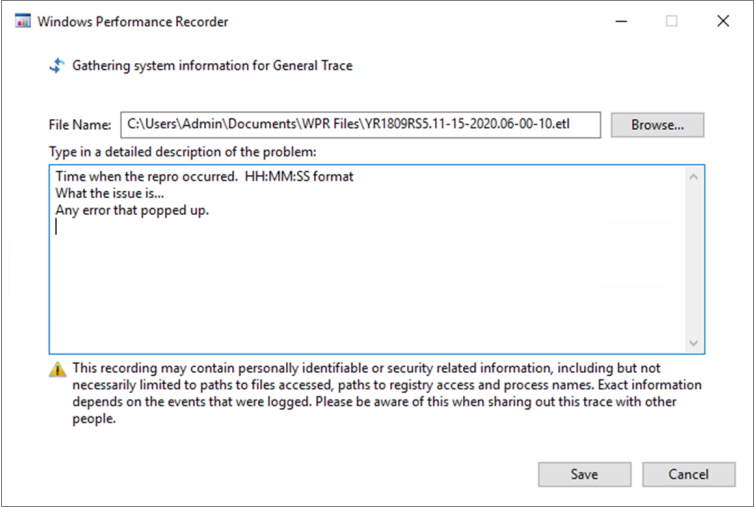
Select File Name: to determine where your trace file is saved. By default, it's saved to
%user%\Documents\WPR Files\.Select Save.
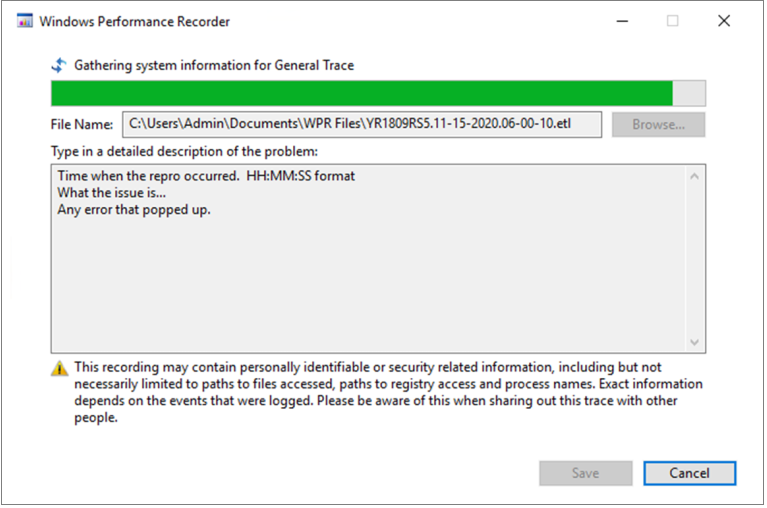
After the trace has been merged and saved, right-click Open folder.
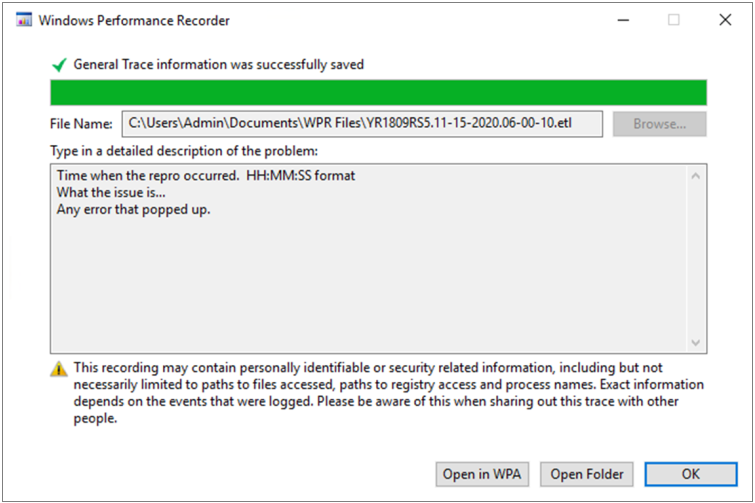
Include both the file and the folder in your submission to Microsoft Support.

Capture performance logs using the WPR CLI
To collect a WPR trace using the command-line tool wpr.exe:
Download Microsoft Defender for Endpoint analysis performance trace profile as
MDAV.wprpin a local directory such asC:\traces.Right-click the Start Menu icon and select Windows PowerShell (Admin) or Command Prompt (Admin) to open an Admin command prompt window.
Select Yes in the User Account Control dialog box.
At the Command Prompt (Admin), run the following command to start a Microsoft Defender for Endpoint performance trace:
wpr.exe -start C:\traces\MDAV.wprp!WD.Verbose -filemodeWarning
If your Windows Server has 64 GB of RAM or more, use profiles
WDForLargeServers.LightandWDForLargeServers.Verboseinstead of profilesWD.LightandWD.Verbose, respectively. Otherwise, your system consumes a high amount of nonpaged pool memory or buffers, leading to system instability.Reproduce the issue.
Tip
Limit the data collection to a maximum of five minutes. Ideally, aim for two to three minutes, as a significant amount of data is being collected.
At the Command Prompt (Admin), run the following command to start a Microsoft Defender for Endpoint performance trace:
wpr.exe -stop merged.etl "Timestamp when the issue was reproduced, in HH:MM:SS format" "Description of the issue" "Any error that popped up"Wait until the trace is merged.
Include both the file and the folder in your submission to Microsoft Support.
See also
Configure and validate exclusions for Microsoft Defender Antivirus scans
Troubleshoot performance issues related to Microsoft Defender Antivirus
Troubleshoot Microsoft Defender Antivirus performance issues with Process Monitor
Troubleshoot Microsoft Defender Antivirus performance issues with WPRUI
Tip
Do you want to learn more? Engage with the Microsoft Security community in our Tech Community: Microsoft Defender for Endpoint Tech Community.