How performance works when virtual machines are connected to Elastic SAN volumes
This article clarifies how Elastic SAN performance works, and how the combination of Elastic SAN limits and Azure Virtual Machines (VM) limits can affect the performance of your workloads.
How performance works
Azure VMs have input/output operations per second (IOPS) and throughput performance limits based on the type and size of the VM. An Elastic SAN has a pool of performance that it allocates to each of its volumes. Elastic SAN volumes can be attached to VMs and each volume has its own IOPS and throughput limits.
Your application's performance gets throttled when it requests more IOPS or throughput than what is allotted for the VM or attached volumes. When throttled, the application has suboptimal performance, and can experience negative consequences like increased latency. One of the main benefits of an Elastic SAN is its ability to provision IOPS automatically, based on demand. Your SAN's IOPS are shared amongst all its volumes, so when a workload peaks, it can be handled without throttling or extra cost. This article shows how this provisioning works.
Elastic SAN performance
An Elastic SAN has three attributes that determine its performance: total capacity, IOPS, and throughput. For the best possible performance, your SAN should be in the same zone as the VM you're provisioning.
Capacity
The total capacity of your Elastic SAN is determined by two different capacities, the base capacity and the additional capacity. Increasing the base capacity also increases the SAN's IOPS and throughput but is more costly than increasing the additional capacity. Increasing additional capacity doesn't increase IOPS or throughput.
IOPS
The IOPS of an Elastic SAN increases by 5,000 per base TiB. So if you had an Elastic SAN that has 6 TiB of base capacity, that SAN could still provide up to 30,000 IOPS. That same SAN would still provide 30,000 IOPS whether it had 50 TiB of additional capacity or 500 TiB of additional capacity, since the SAN's performance is only determined by the base capacity. The IOPS of an Elastic SAN are distributed among all its volumes.
Throughput
The throughput of an Elastic SAN increases by 200 MB/s per base TiB. So if you had an Elastic SAN that has 6 TiB of base capacity, that SAN could still provide up to 1200 MB/s. That same SAN would provide 1200-MB/s throughput whether it had 50 TiB of additional capacity or 500 TiB of additional capacity, since the SAN's performance is only determined by the base capacity. The throughput of an Elastic SAN is distributed among all its volumes.
Elastic SAN volumes
The performance of an individual volume is determined by its capacity. The maximum IOPS of a volume increase by 750 per GiB, up to a maximum of 80,000 IOPS. The maximum throughput increases by 60 MB/s per GiB, up to a maximum of 1,280 MB/s. A volume needs at least 107 GiB to be capable of using 80,000 IOPS. A volume needs at least 22 GiB in order to be capable of using the maximum 1,280 MB/s. The combined IOPS and throughput of all your volumes can't exceed the IOPS and throughput of your SAN.
Example configuration
Each of the example scenarios in this article uses the following configuration for the Elastic SAN:
| Resource | Capacity | IOPS |
|---|---|---|
| Elastic SAN | 27 TiB | 135,000 (provisioned) |
| AKS SAN volume | 3 TiB | Up to 80,000 |
| Workload 1 SAN volume | 10 TiB | Up to 80,000 |
| Workload 2 SAN volume | 4 TiB | Up to 80,000 |
| Workload 3 SAN volume | 2 TiB | Up to 80,000 |
Example scenarios
The following example scenarios depict how your Elastic SAN handles performance allocation. For best performance, both the VMs and the SAN need to be in the same zone.
Typical workload
| Workload | Requested IOPS | Served IOPS |
|---|---|---|
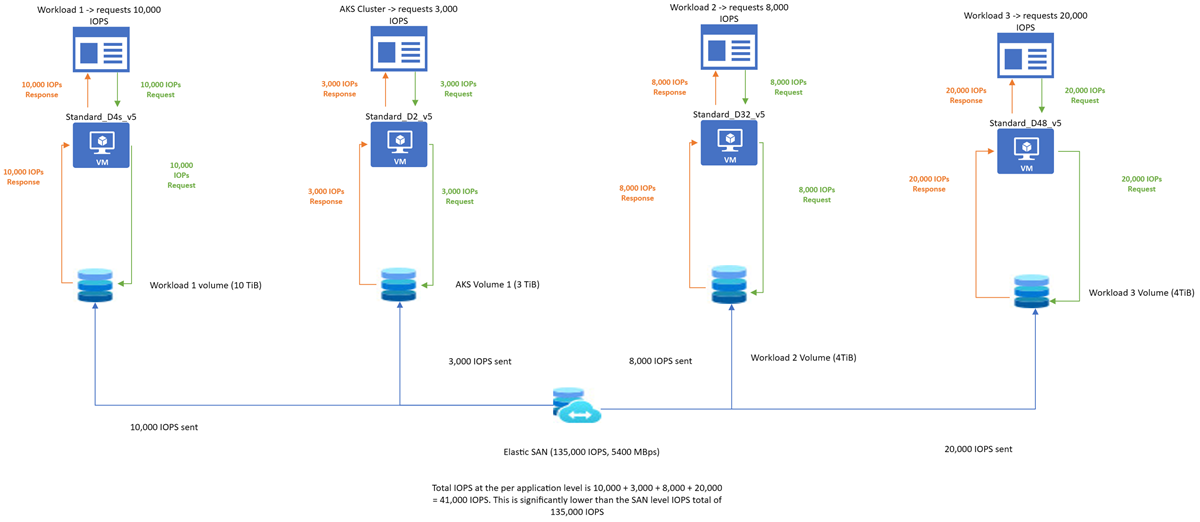
| AKS workload | 3,000 | 3,000 |
| Workload 1 | 10,000 | 10,000 |
| Workload 2 | 8,000 | 8,000 |
| Workload 3 | 20,000 | 20,000 |
In this scenario, no throttling occurs at either the VM or SAN level. The SAN itself has 135,000 IOPS, each volume is large enough to serve up to 80,000 IOPS, enough IOPS are available from the SAN, none of the VM's IOPS limits have been surpassed, and the total IOPS requested is 41,000. So the workloads all execute without any throttling.
Single workload spike
| Workload | Requested IOPS | Served IOPS | Spike time |
|---|---|---|---|
| AKS workload | 2,000 | 2,000 | N/A |
| Workload 1 | 10,000 | 10,000 | N/A |
| Workload 2 | 10,000 | 10,000 | N/A |
| Workload 3 | 80,000 | 80,000 | 9:00 am |
In this scenario, no throttling occurs. Workload 3 spiked at 9am, requesting 80,000 IOPS. None of the other workloads spiked and the SAN had enough free IOPS to distribute to the workload, so there was no throttling.
Generally, this is the ideal configuration for a SAN sharing workloads. It's best to have enough performance to handle the normal operations of workloads, and occasional peaks.
All workloads spike
| Workload | Requested IOPS | Served IOPS | Spike time |
|---|---|---|---|
| AKS workload | 5,000 | 5,000 | 9:00 am |
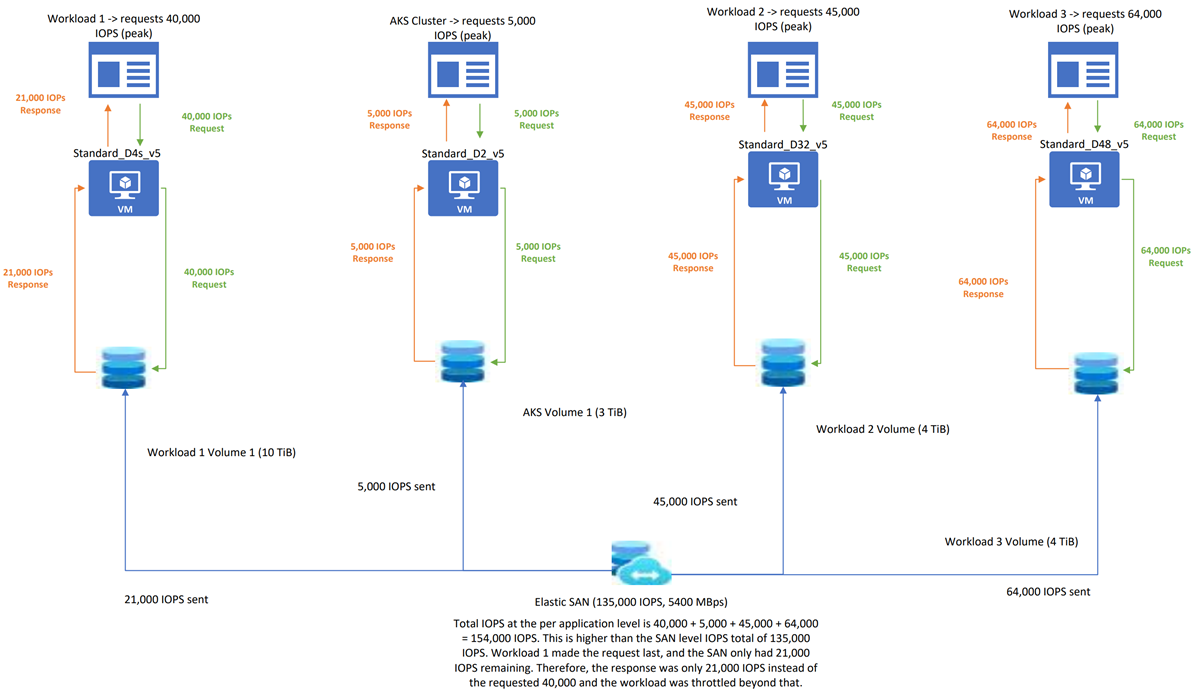
| Workload 1 | 40,000 | 21,000 | 9:01 am |
| Workload 2 | 45,000 | 45,000 | 9:00 am |
| Workload 3 | 64,000 | 64,000 | 9:00 am |
It's important to know the behavior of a SAN in the worst case scenario, where each workload peaks at the same time.
In this scenario, all the workloads hit their spike at almost the same time. At this point, the total IOPS required by all the workloads combined (64,000 + 45,000 + 40,000 + 5,000) is more than the IOPS provisioned at the SAN level (135,000). So the workloads are throttled. Throttling happens on a first-come, first-served basis, so whichever workloads request IOPS after the max capacity has been reached doesn't get more performance. In this case, workload 1 requested 40,000 IOPS after the other workloads, the SAN had already allocated most of its available IOPS, so only the remaining IOPS was provided.


