Monitor and track user audit activity across SAP systems
This article describes the SAP - Security Audit log and Initial Access workbook, used for monitoring and tracking user audit activity across your SAP systems. Use the workbook to get a bird's eye view of user audit activity, better secure your SAP systems, and gain quick visibility into suspicious actions. Drill down into suspicious events as needed.
Use the workbook either for ongoing monitoring of your SAP systems, or to review the systems following a security incident or other suspicious activity.
For example:
Content in this article is intended for your security team.
Prerequisites
Before you can start using the SAP - Security Audit log and Initial Access workbook, you must have:
A Microsoft Sentinel solution for SAP installed and a data connector configured. For more information, see Deploy a Microsoft Sentinel solution for SAP applications.
The SAP - Security Audit log and Initial Access workbook installed in your Log Analytics workspace enabled for Microsoft Sentinel. For more information, see Visualize and monitor your data by using workbooks in Microsoft Sentinel.
Important
The SAP - Security Audit log and Initial Access workbook is hosted by the workspace where the Microsoft Sentinel solution for SAP applications were installed. By default, both the SAP and the SOC data is assumed to be on the workspace that hosts the workbook.
If the SOC data is on a different workspace than the workspace hosting the workbook, make sure to include the subscription for that workspace, and select the SOC workspace from Azure audit and activity workspace.
At least one incident in your Microsoft Sentinel workspace, with at least one entry available in the
SecurityIncidenttable. This doesn't need to be an SAP incident, and you can generate a demo incident using a basic analytics rule if you don't have another one.If your Microsoft Entra data is in a different Log Analytics workspace, make sure you select the relevant subscriptions and workspaces at the top of the workbook, under Azure audit and activities.
We recommend that you configure auditing for all messages from the audit log, instead of only specific logs. Ingestion cost differences are generally minimal and the data is useful for Microsoft Sentinel detections and in post-compromise investigations and hunting. For more information, see Configure SAP auditing.
Supported filters
The SAP - Security Audit log and Initial Access workbook supports the following filters to help you focus on the data you need:
- Time Range. From four hours to 90 days.
- System Roles. The SAP system roles, for example: Development.
- System Usage. For example: SAP GTS.
- SAP systems. You can select all systems, a specific system, or select multiple systems.
If you select systems that aren't configured in the SAP systems watchlist, the workbook shows an error, specifying the systems with issues. In this case, configure the watchlist to correctly include these systems.
Logon analysis report data
The Logon analysis report tab on the SAP - Security Audit log and Initial Access workbook shows data about sign-in failures, such as anomalous data, Microsoft Entra data, and more.
The data is based on the SAP systems watchlist.
The Logon analysis report tab includes the following areas:
Logon analysis
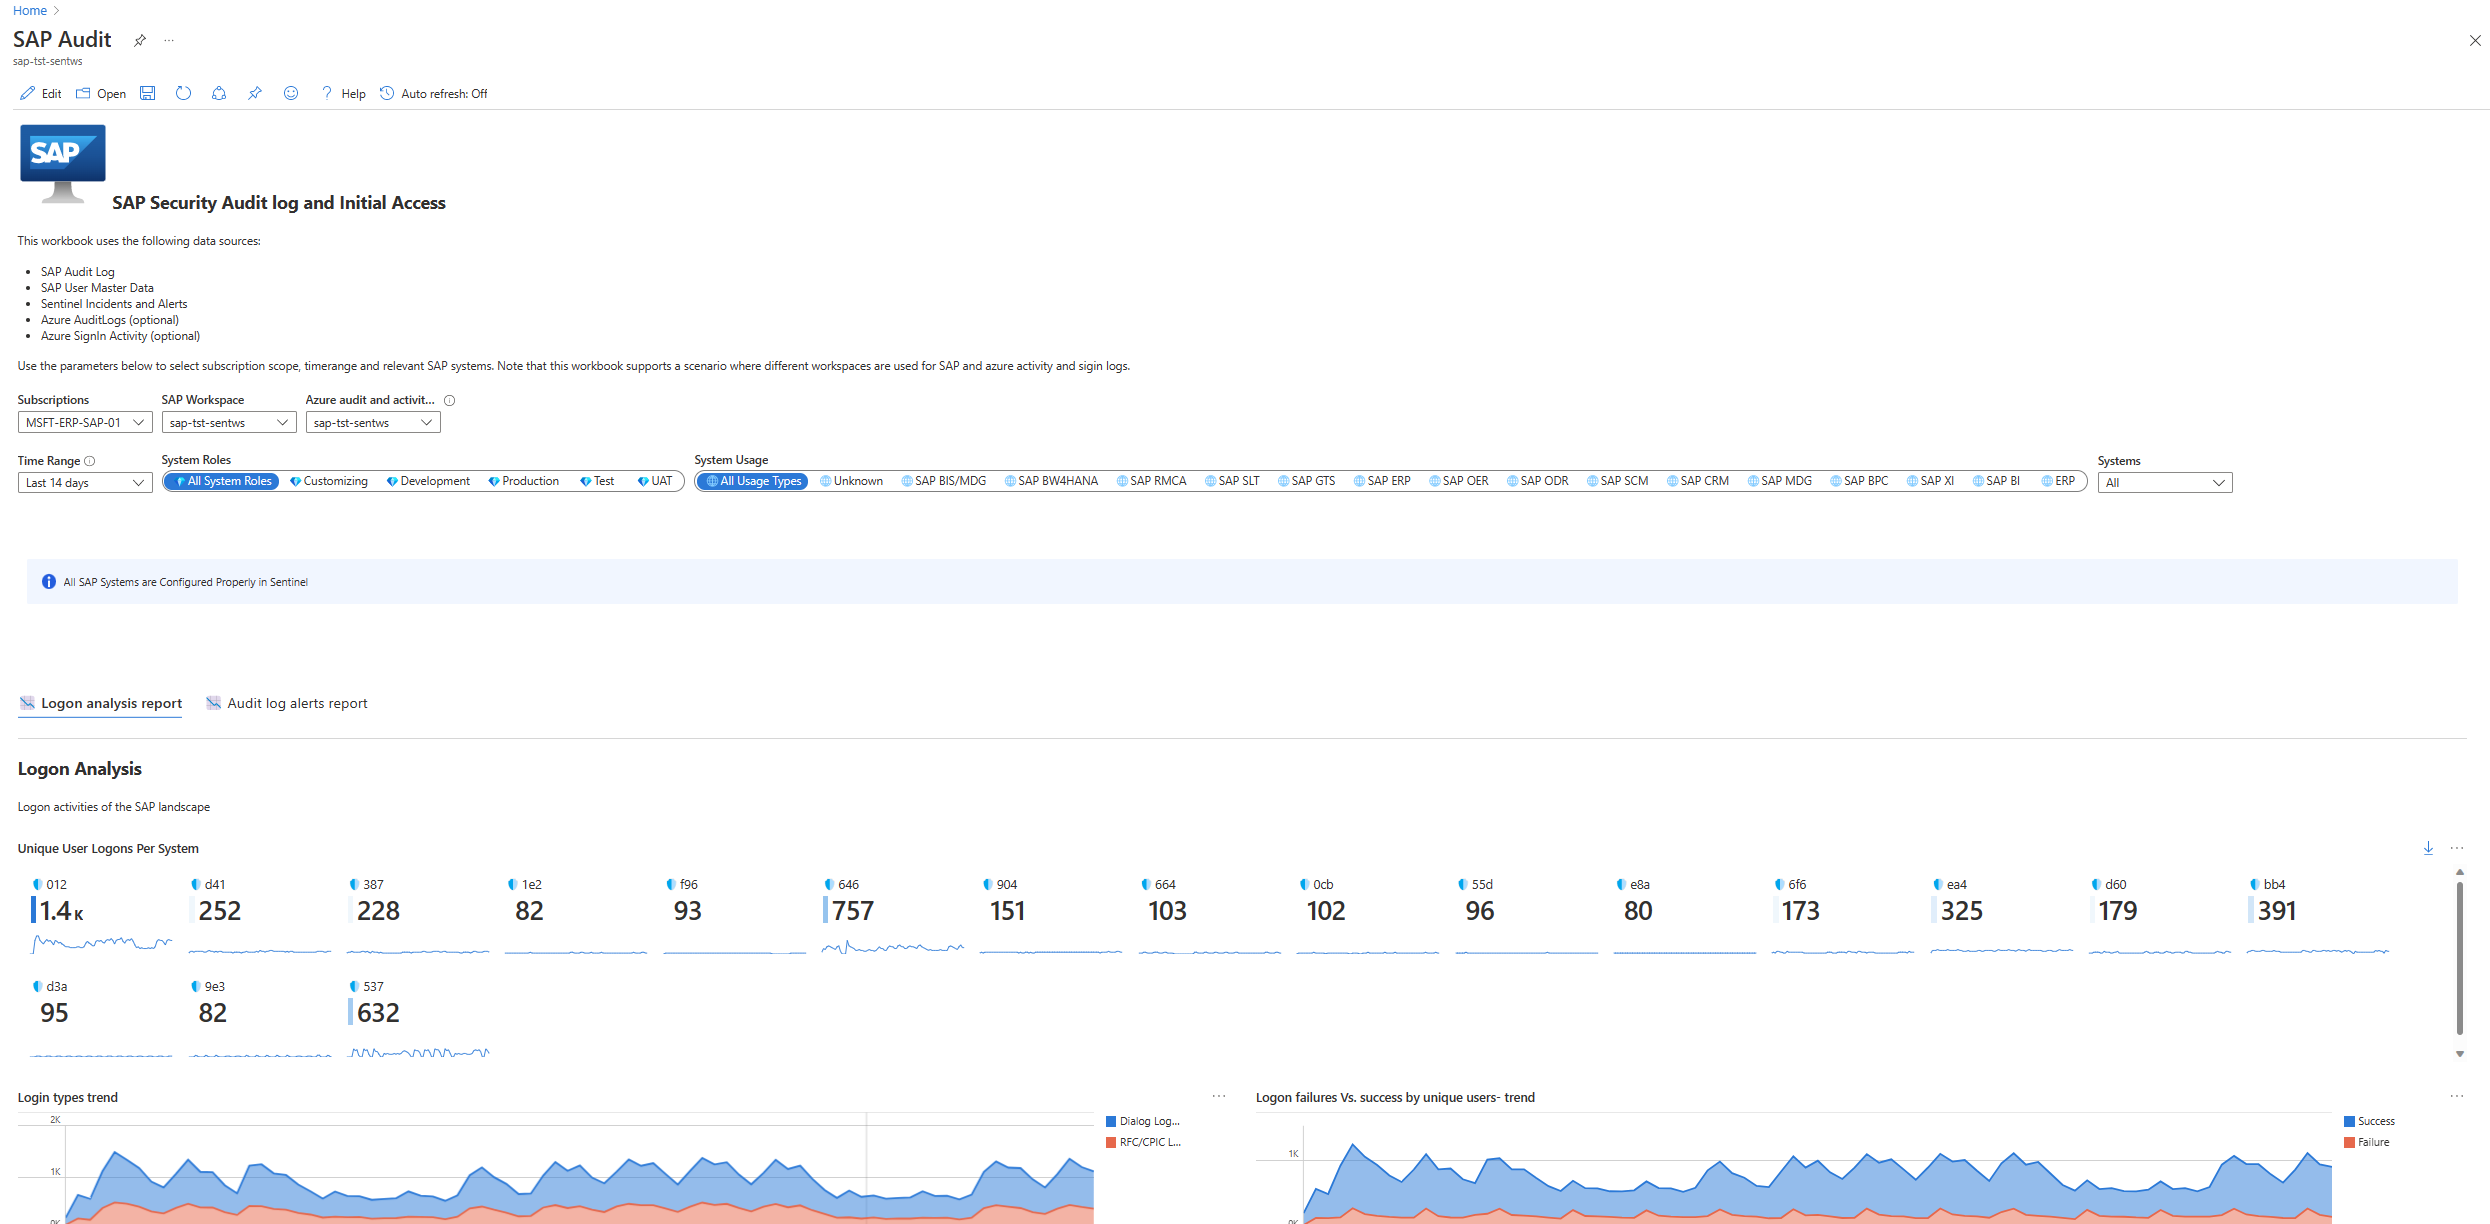
The Logon analysis area shows regarding user sign-ins. For example:
The following table describes each metric in the Logon analysis area:
| Area | Description |
|---|---|
| Unique user logons per system | Shows the number of unique sign-ins for each SAP system, and a graph with the sign-in trends over the selected time for each system. For example: the 012 system has 1.4-K unique logon attempts in the last 14 days, and in these 14 days the graph shows a relatively rising sign-in trend. |
| Logon types trend | Shows a trend of the number of sign ins according to type, for example, login via dialog. Hover over the graph to show the number of logons for different dates. |
| Logon failures Vs. success by unique users - trend | Shows a trend of successful and failed sign ins in the selected period. Hover over the graph to show the amount of successful and failed sign ins for different dates. |
Logon failures - anomaly detection
The areas under Anomaly detection - filtering out noisy failed login attempts show login failure data for SAP systems and users. To see only data flagged by, select Anomalous only next to Failed logons on the right.
For more information, see Monitor the SAP audit log.
For example:
The following table describes each metric in the Anomaly detection area:
| Area | Description |
|---|---|
| Logon failure rate > Logon failure anomalies > Unique User failed logons per SAP system | Shows the number of unique failed sign ins for each SAP system. |
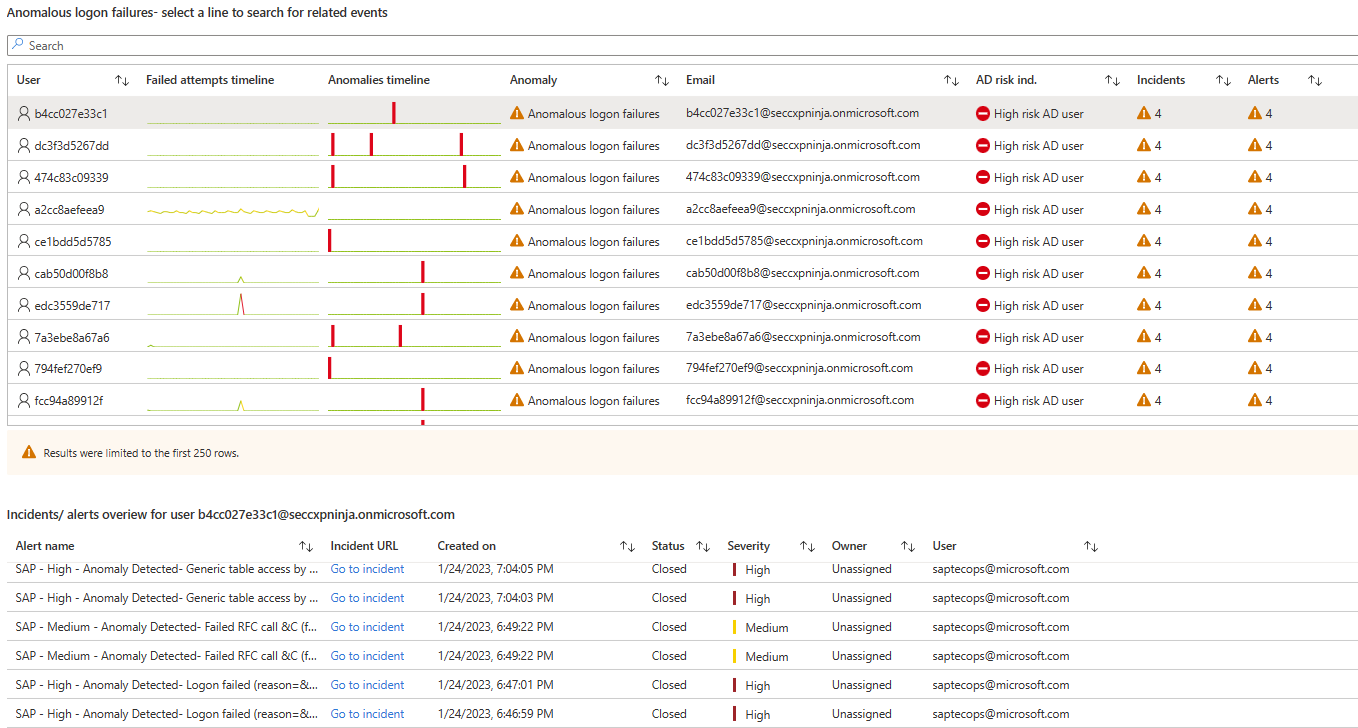
| SAP and Active Directory are better together | The Anomalous login failures table shows a combination of Microsoft Sentinel and Microsoft Entra data, listing users according to risk, with the most risky users at the top. For each user, the table shows: - A timeline of failed sign-in attempts - A timeline showing at which point an anomalous failed attempt occurred - The type of anomaly - The user's email address - The Microsoft Entra risk indicator - The number of incidents and alerts in Microsoft Sentinel Select a user's row to see a list of related alerts and incidents. Microsoft Entra risk events are listed under Azure audit and signin risks for user. |
| Logon failure rate per system | Shows the selected SAP systems, grouped by type, with the number of failures in the selected period. The system's color indicates the number of failed attempts: Green for a few suspicious sign-in attempts, and red for more. Select a system to see a list of failed sign-ins, with details about the failures. |
In the following screenshot, note the data shown when the first line is selected in the Anomalous login failures table. The specific alerts and incident URLs are shown in the Incidents/alerts overview for user table.
In the following screenshot, the Azure audit and signin risks for user table shows data for the sign-in risk related to this user.
In the following screenshot, note the Login failure rate per system area, where the 84e system under the Test group is selected. The Failed logons for system area on the right shows failure events for this system.
Logon failures - trends
The Logon failures trends area shows the trends and number of failed sign-ins, grouped by different types of data. For example:
The following table describes each metric in the Logon failures trends area:
| Area | Description |
|---|---|
| Login failure by cause | Shows the trend of the number of sign-in failures according to failure cause, such as incorrect sign-in data. |
| Login failure by type | Shows the trend of the number of sign-in failures according to type, such as the sign-in triggered a background job, or the sign-in was via HTTP. |
| Login failure by method | Shows the trend of the number of sign-in failures according to method, such as SNC or a sign-in ticket. |
Audit log alerts report tab
The Audit log alerts tab shows data about the SAP Audit log events that the Microsoft Sentinel solution for SAP applications watches. The data is based on the SAP_Dynamic_Audit_Log_Monitor_Configuration watchlist.
The Audit log alerts tab shows the severity and audit trends for each SAP system and user. All areas in this tab show data flagged by anomaly detection only. For all events, select All next to Failed logons on the right.
For more information, see Monitor the SAP audit log.
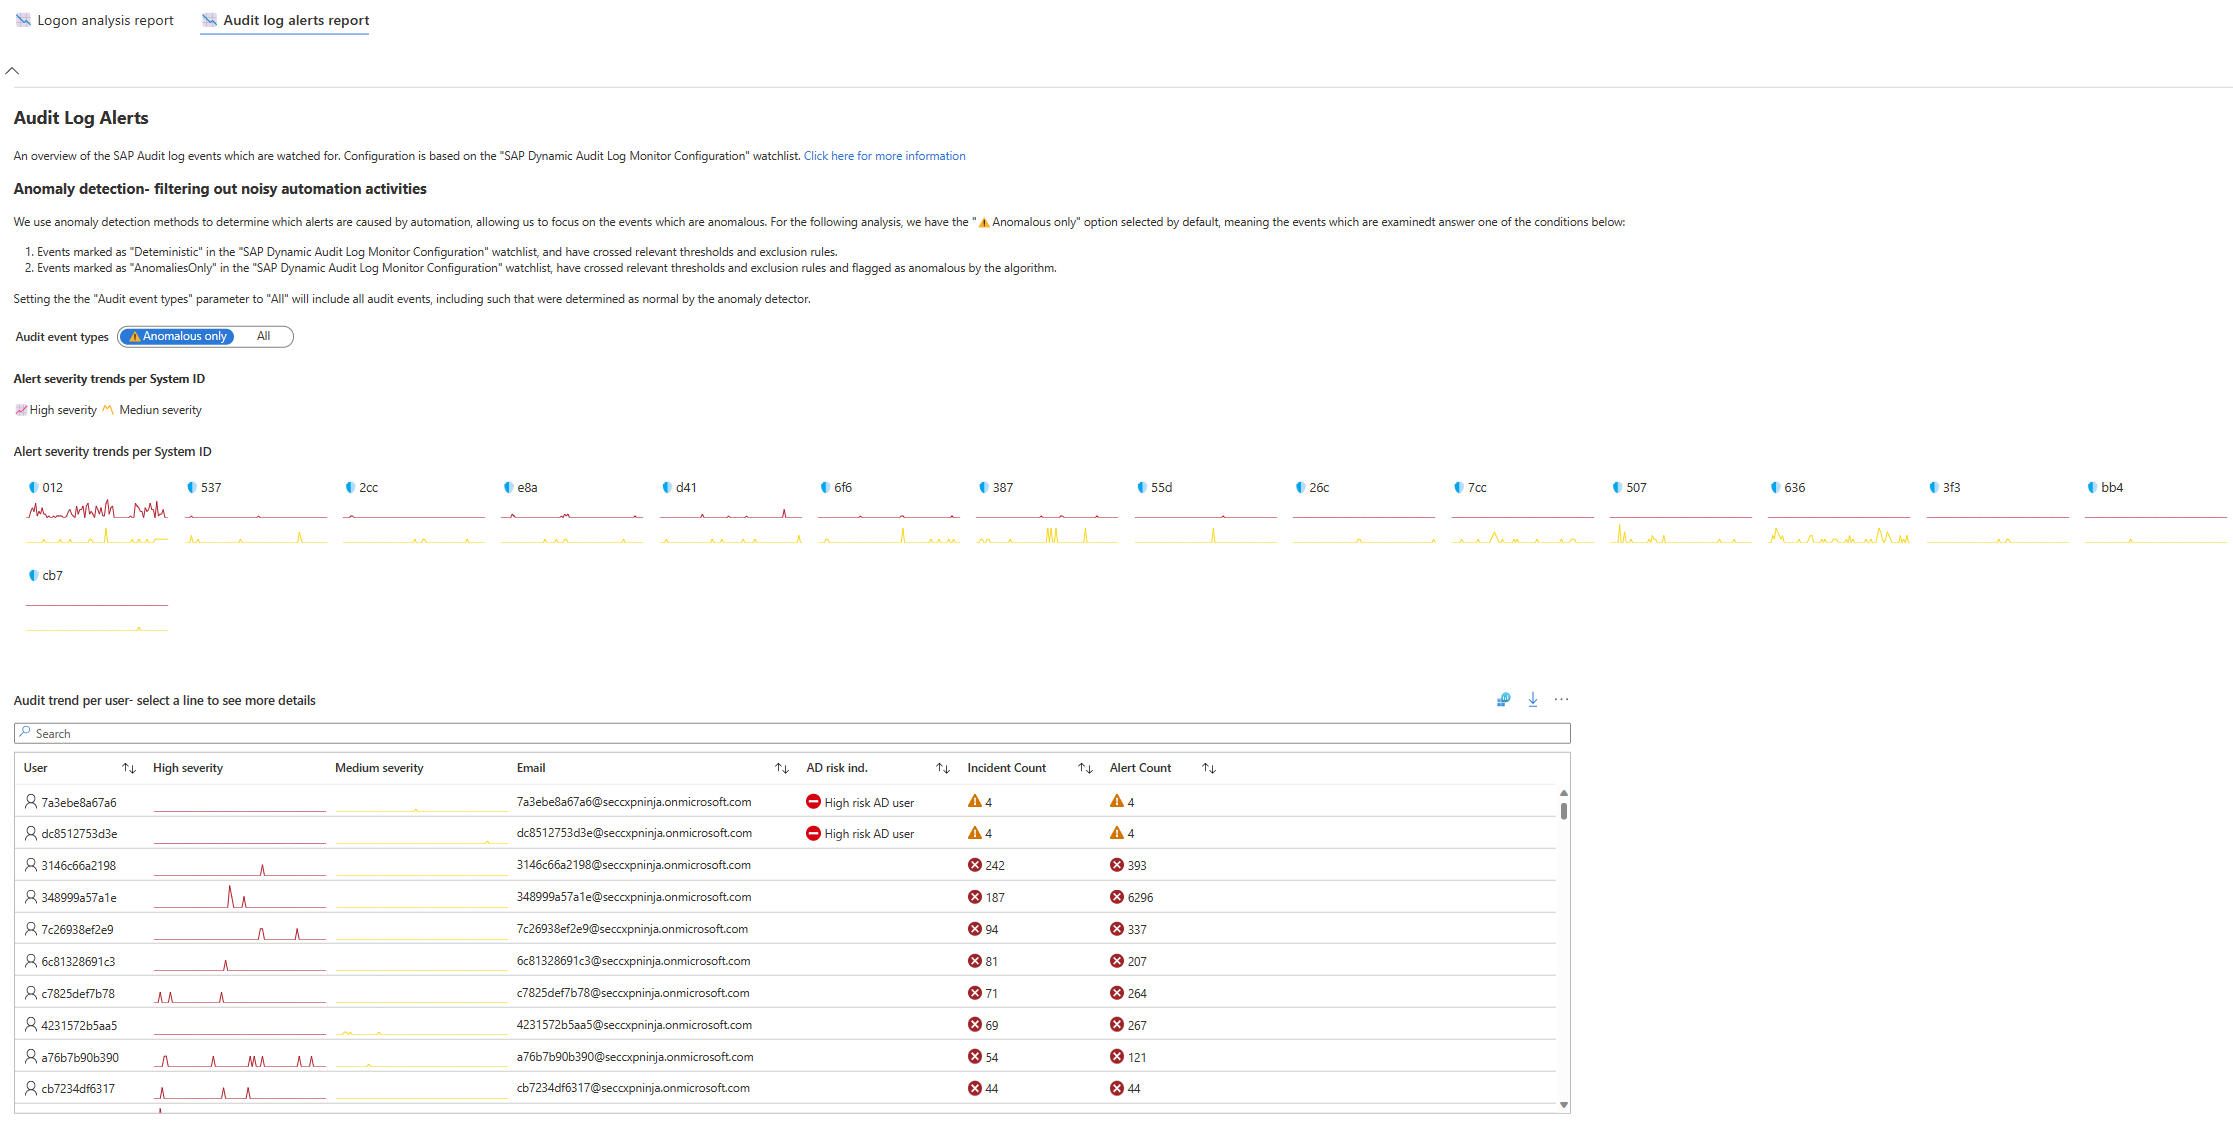
For example:
The following table describes each metric on the Audit log alerts tab:
| Area | Description |
|---|---|
| Alert severity trends per system ID | Shows a list of systems, with a graph of Medium and High severity event trends per system. For example, the 012 system had many High severity events over the entire period, and a few Medium severity events, with a spike that shows more Medium severity events in the middle of the period. |
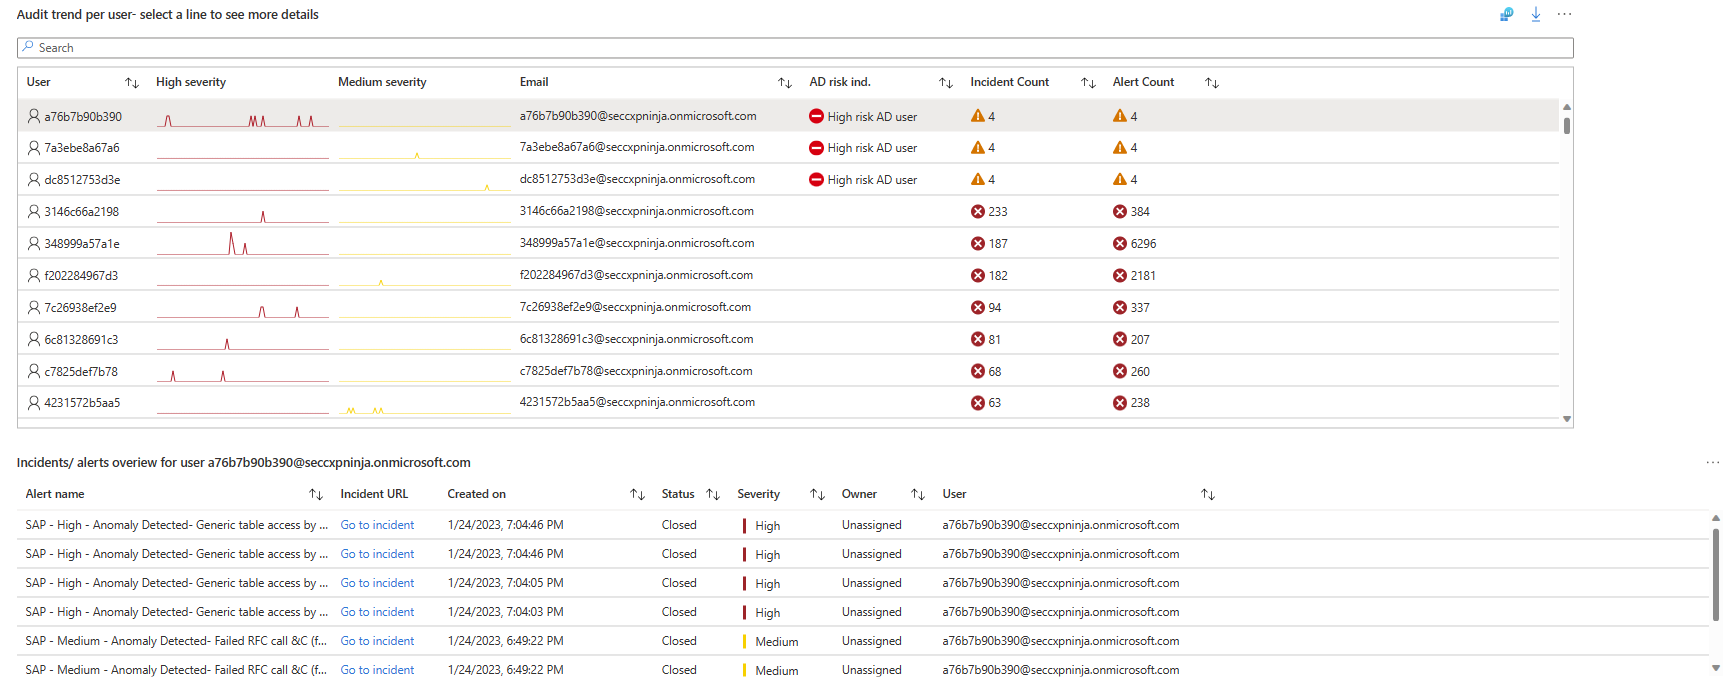
| Audit trend per user | Shows a combination of Microsoft Sentinel and Microsoft Entra data, listing users according to risk, with the most risky users at the top. For each user the workbook shows the following data: - A timeline of High and Medium severity events - The user's email address - The Microsoft Entra risk indicator - The number of incidents and alerts in Microsoft Sentinel Select a row to see a list of alerts and incidents for that user under Incidents/alerts overview for user. View Microsoft Entra risk events under Azure audit and signin risks for user. |
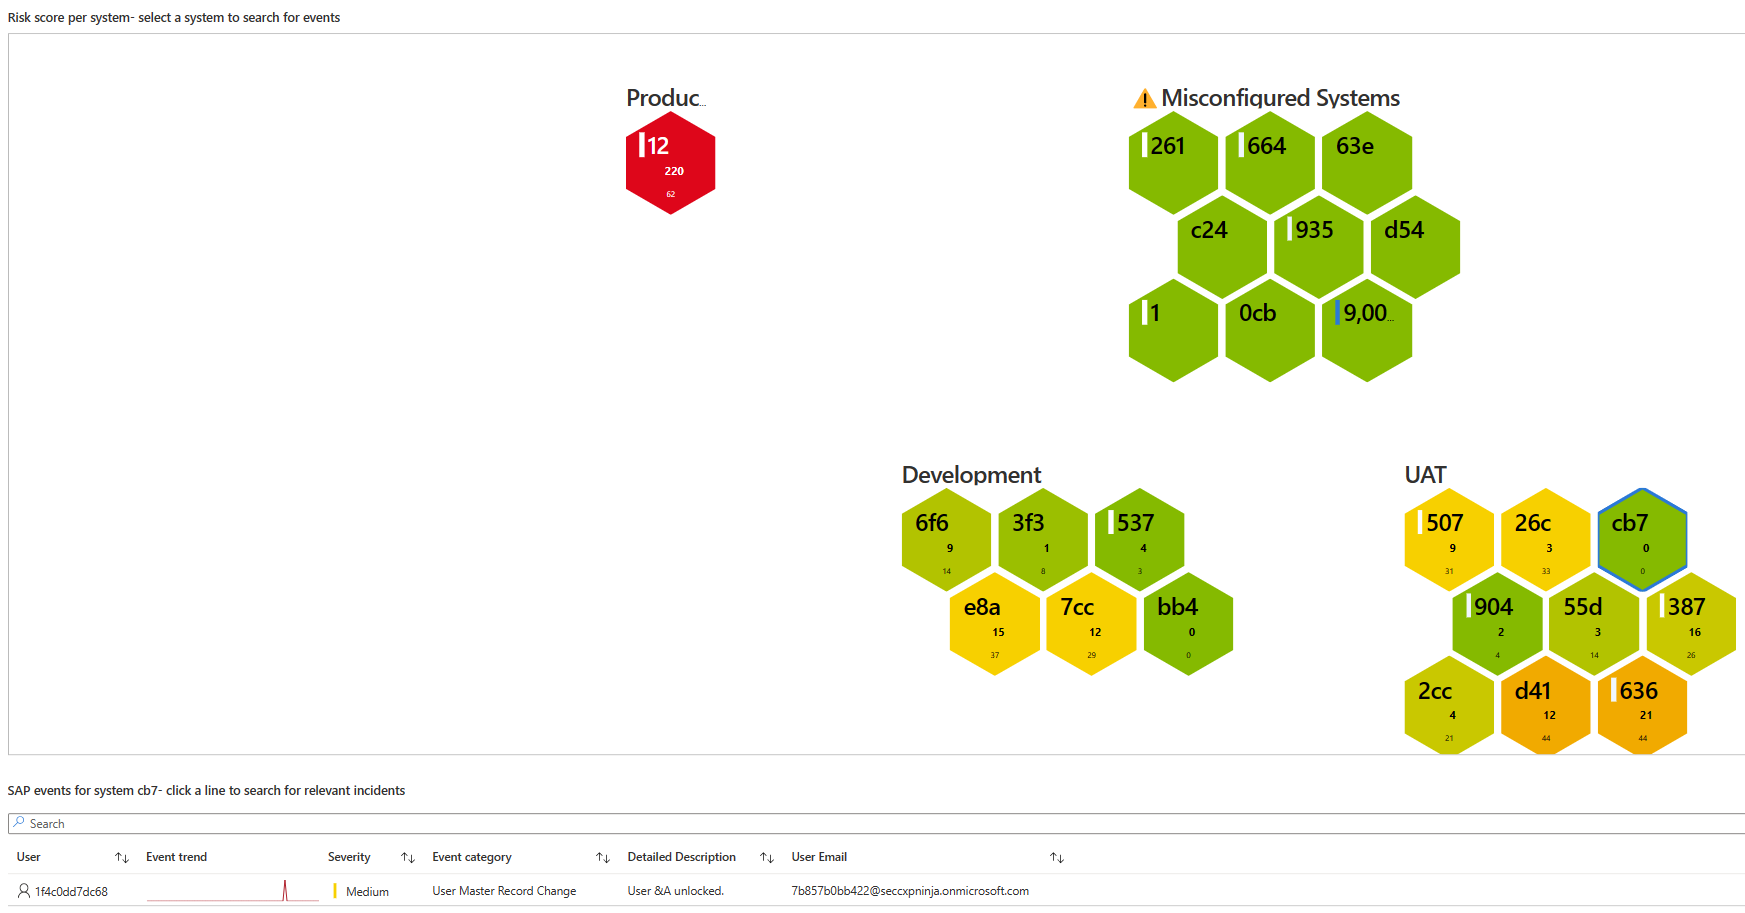
| Risk score per system | Visually represents each system in a cell shape, showing the risk score for each system and grouping systems by type. The system's color indicates the system's risk score: Green for a lower risk score and red for a higher risk score. Select a system to see a list of SAP events per system. |
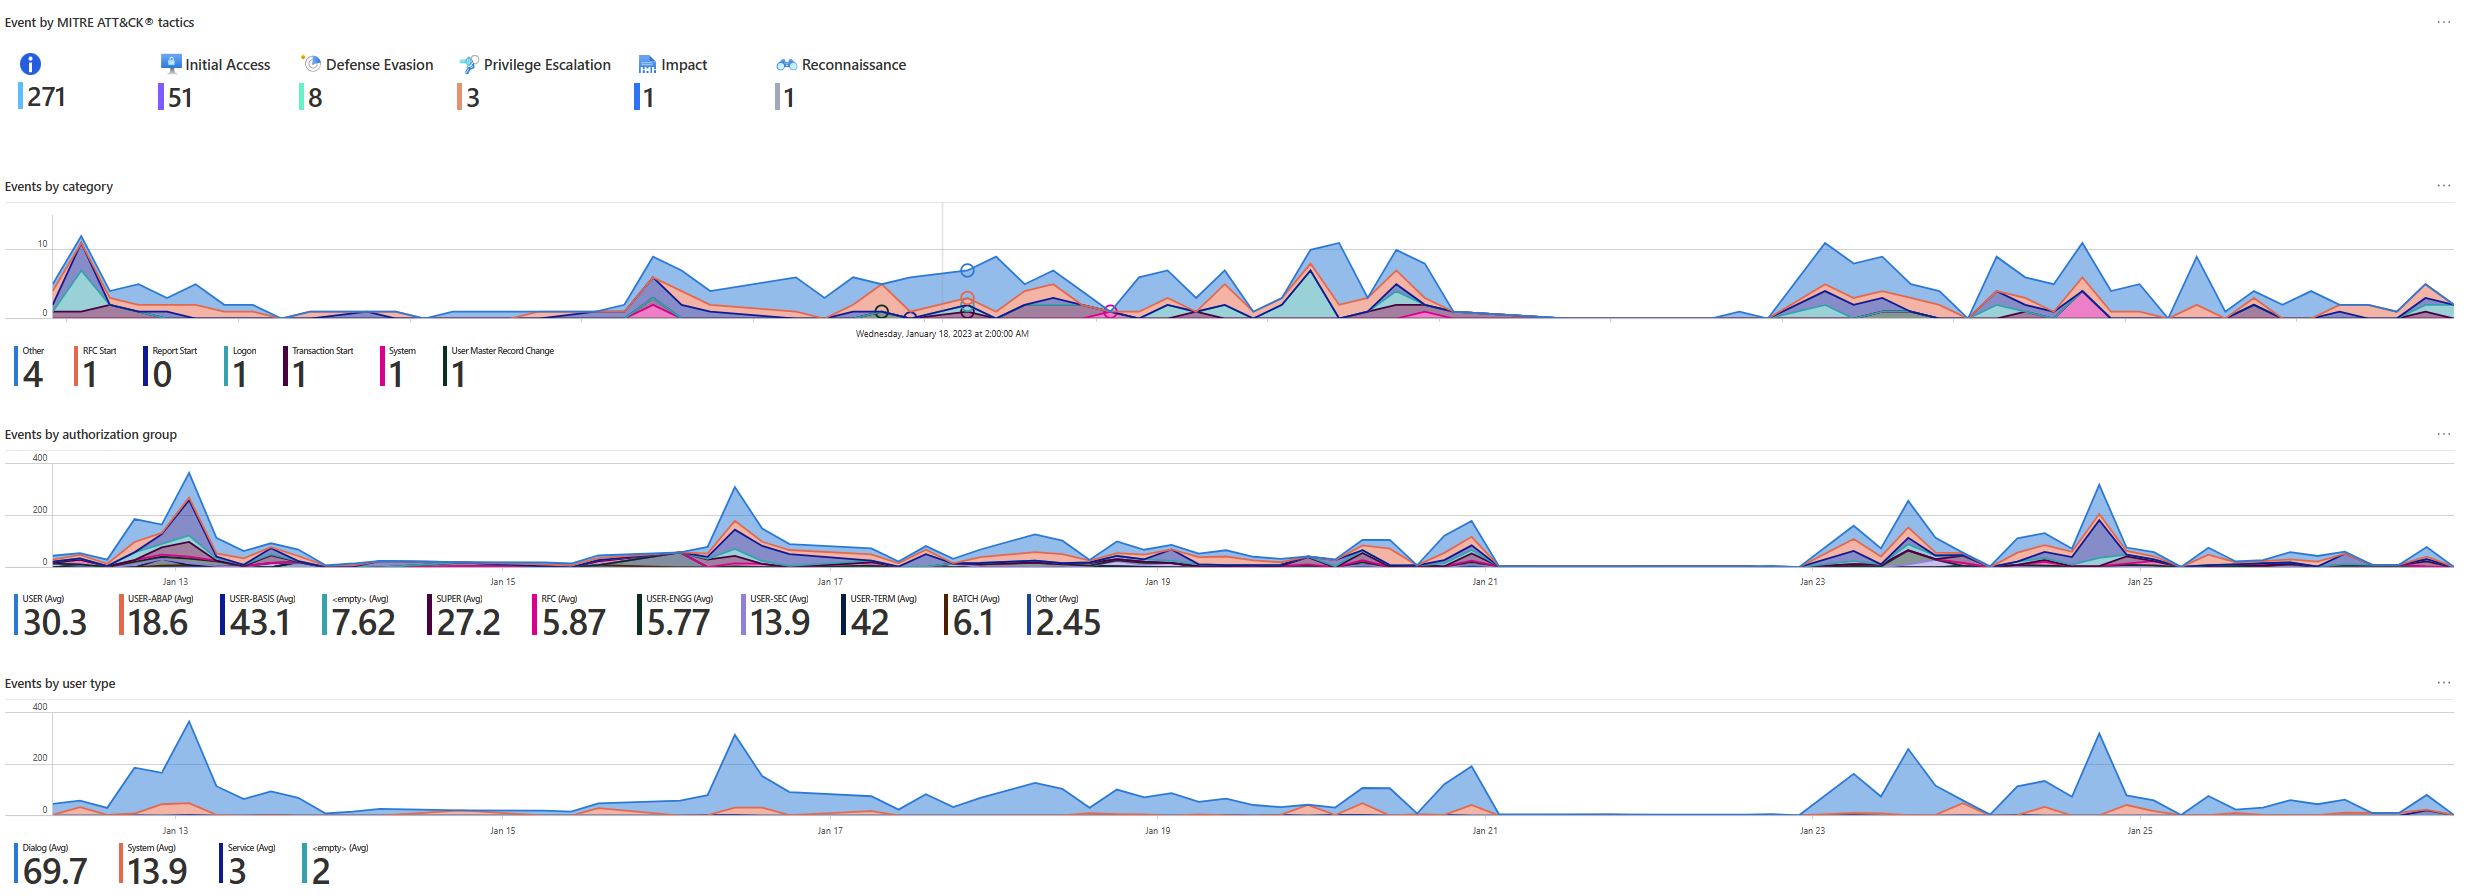
| Events by MITRE ATT&CK tactics | Shows a list of SAP events grouped by MITRE ATT&CK tactics, like Initial Access or Defense Evasion. Hover over the graph to show the number of sign-ins for different dates. |
| Events by category | Shows a list of SAP event trends grouped by category, like RFC Start or Logon. Hover over the graph to show the sign-in number for different dates. |
| Events by authorization group | Shows a list of SAP event trends grouped by the SAP authorization group, like USER or SUPER. Hover over the graph to show the number of sign-ins for different dates. |
| Events by user type | Shows a list of SAP event trends grouped by the SAP user type, like Dialog or System. Hover over the graph to show the number of sign-ins for different dates. |
In the following screenshot, note the data shown when the first line is selected in the Audit trends per user table. The specific alerts and incident URLs are shown in the Incidents/alerts overview for user table.
In the following screenshot, note the Risk score per system area, where the cb7 system under the UAT group is selected. The SAP events for system area below the system visualization shows the SAP event for this system.
In the following screenshot, note areas with events and event trends grouped by different types of data: MITRE ATT&CK tactics, SAP authorization group, and user type.
Related content
For more information, see Deploy the Microsoft Sentinel solution for SAP applications from the content hub and Microsoft Sentinel solution for SAP applications: security content reference.
