Download PostgreSQL and upgrade logs
APPLIES TO:  Azure Database for PostgreSQL - Flexible Server
You can use PostgreSQL server logs to diagnose specific issues experienced in an Azure Database for PostgreSQL flexible server, and to gain detailed insights about the activities that run on your servers. You can use major version upgrade logs to troubleshoot errors that might occur during an attempt to upgrade your server to a higher major version of PostgreSQL.
By default, capturing server logs for download in an Azure Database for PostgreSQL flexible server is disabled. However, after you enable the feature, your Azure Database for PostgreSQL flexible server starts capturing the server logs to files, which you can download for detailed inspection. You can use Azure portal or Azure CLI commands to list and download these files that can assist you with any troubleshooting efforts.
This article explains how to enable and disable the feature. It also describes how you can list all available server logs, and how can you download any of them.
Steps to enable the capture of PostgreSQL and upgrade logs for download
Using the Azure portal:
Select your Azure Database for PostgreSQL flexible server.
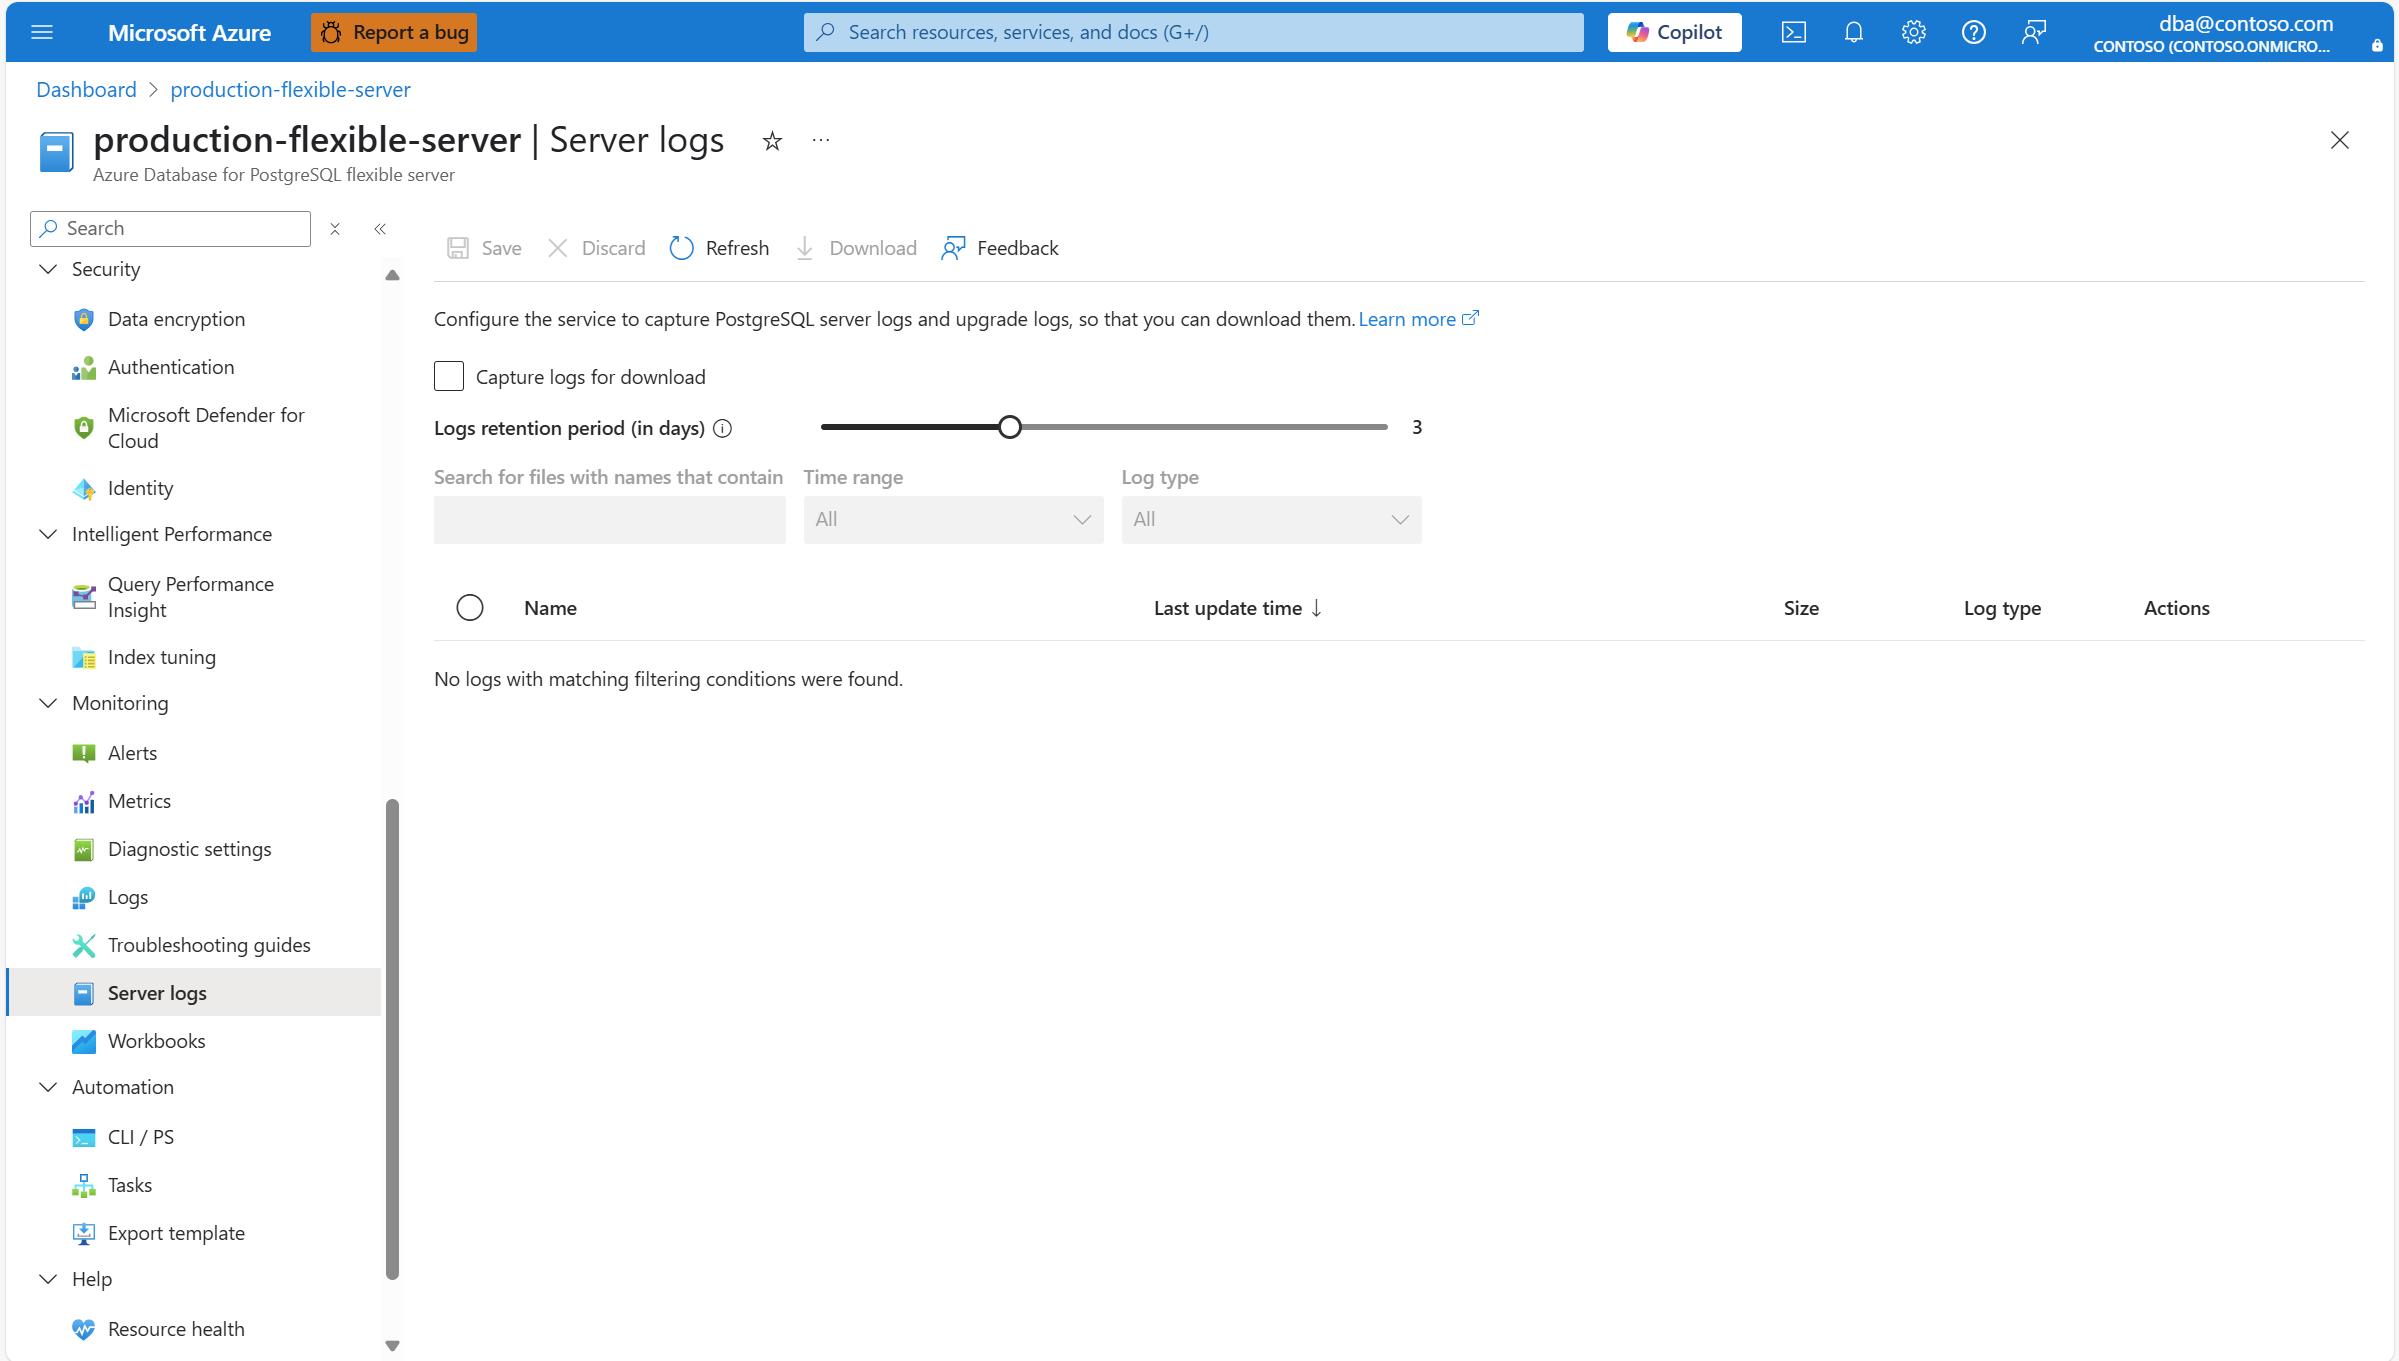
In the resource menu, under the Monitoring section, select Server logs.
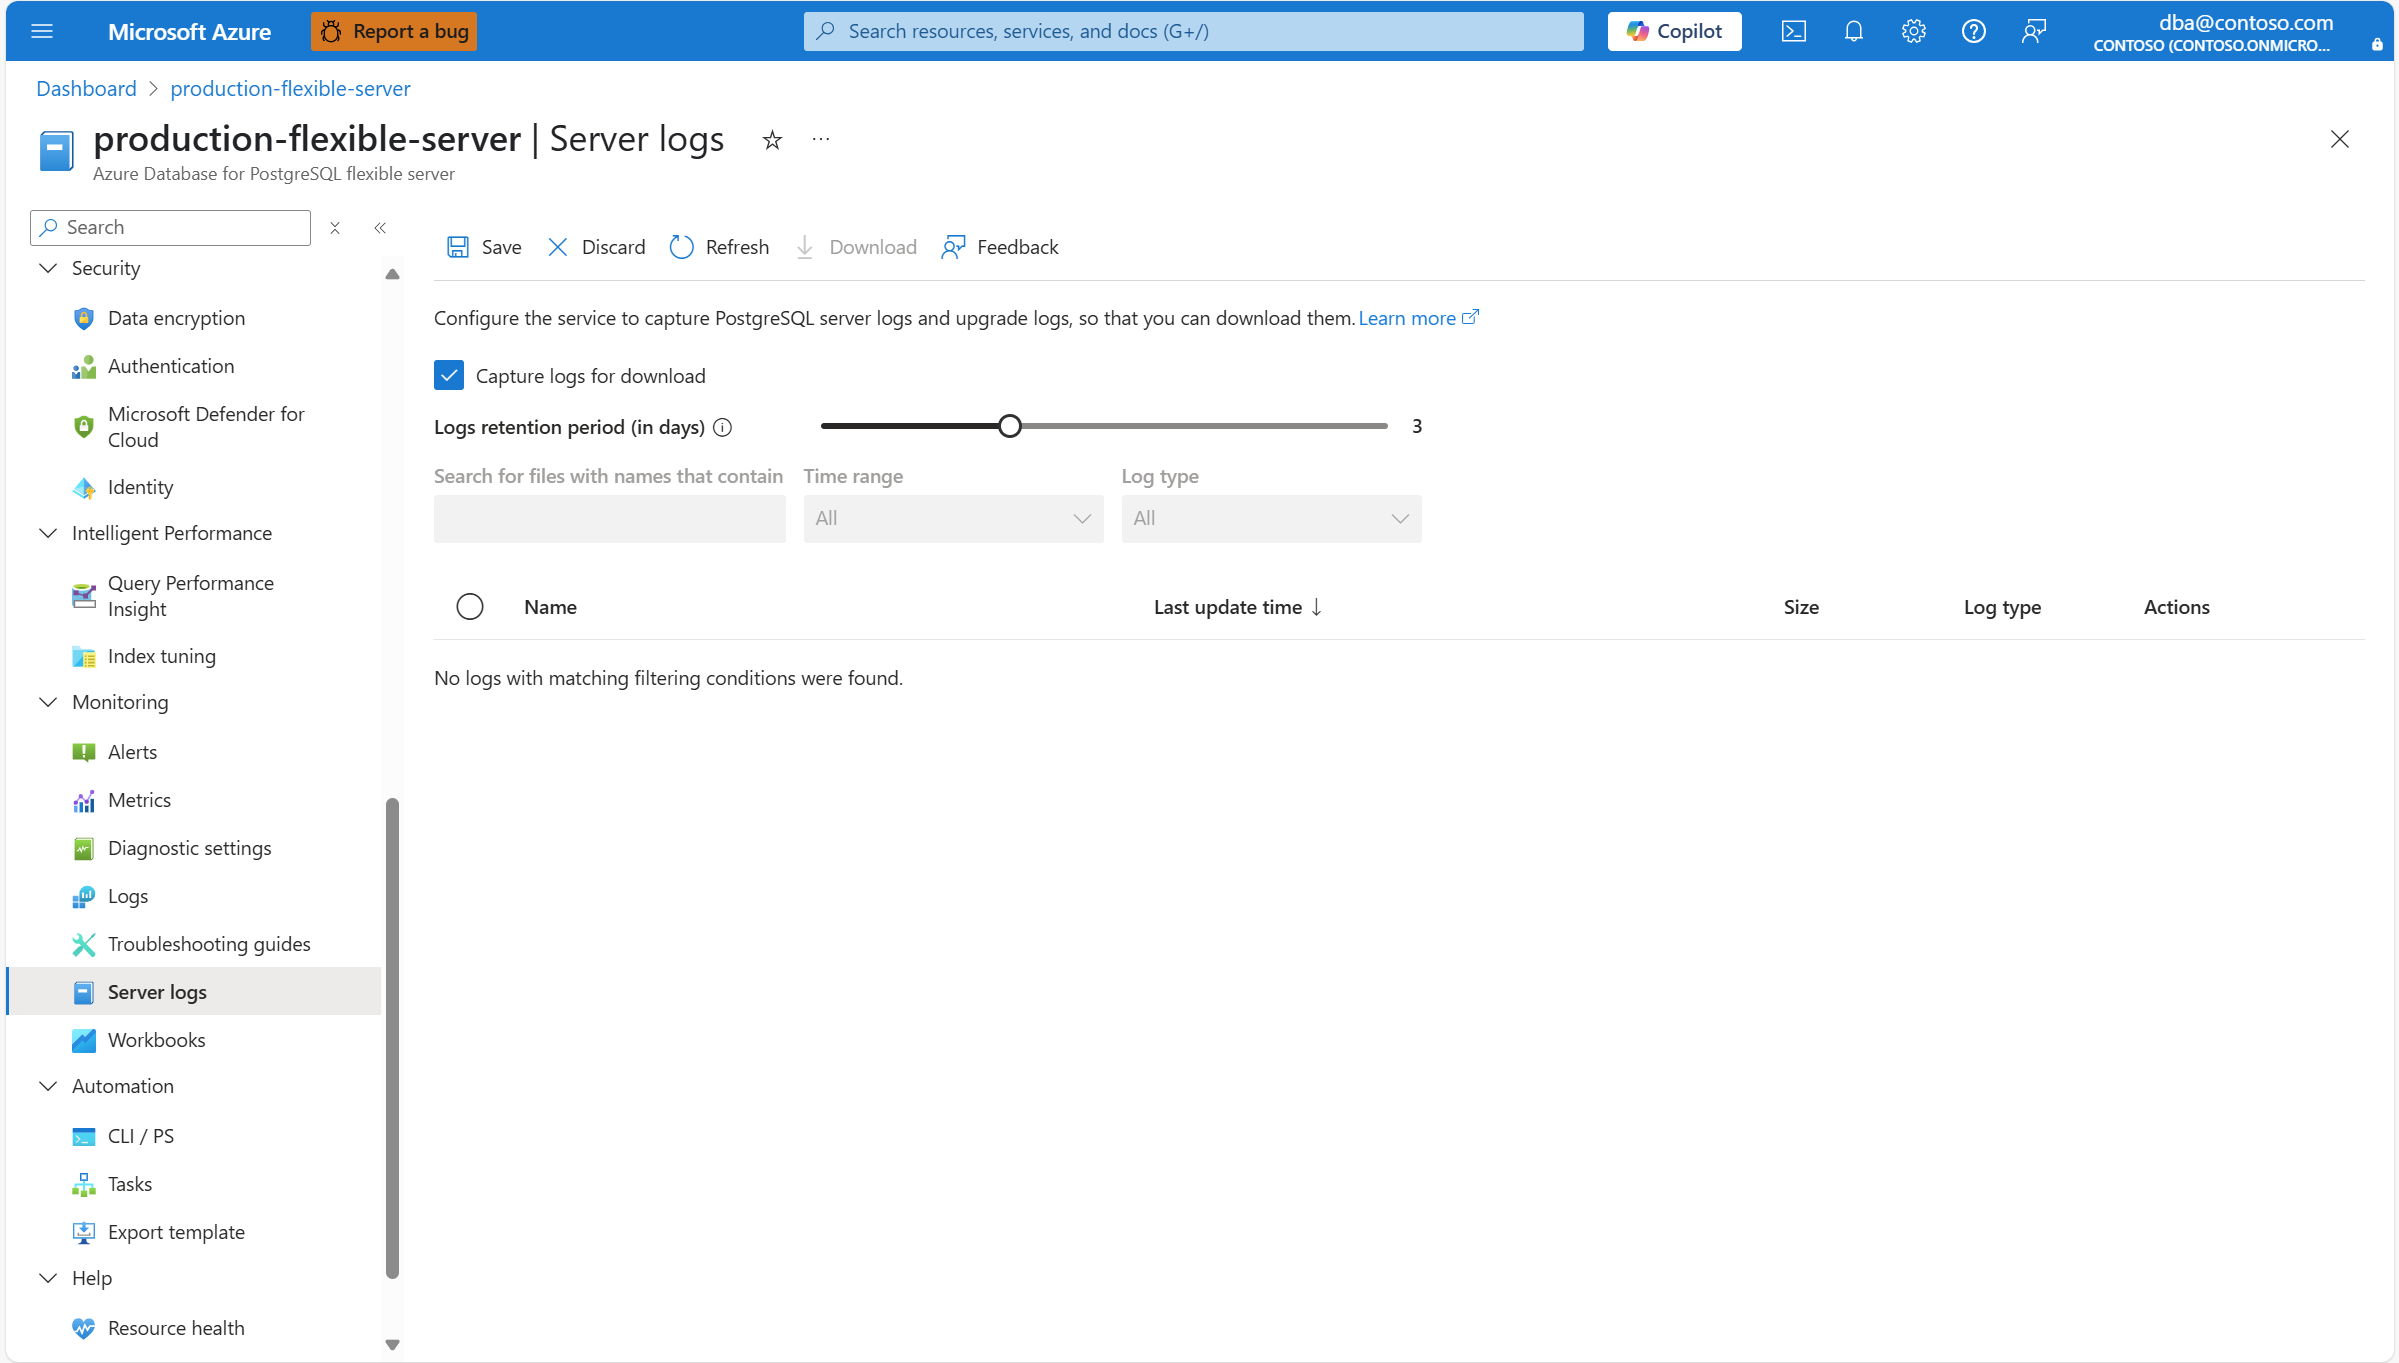
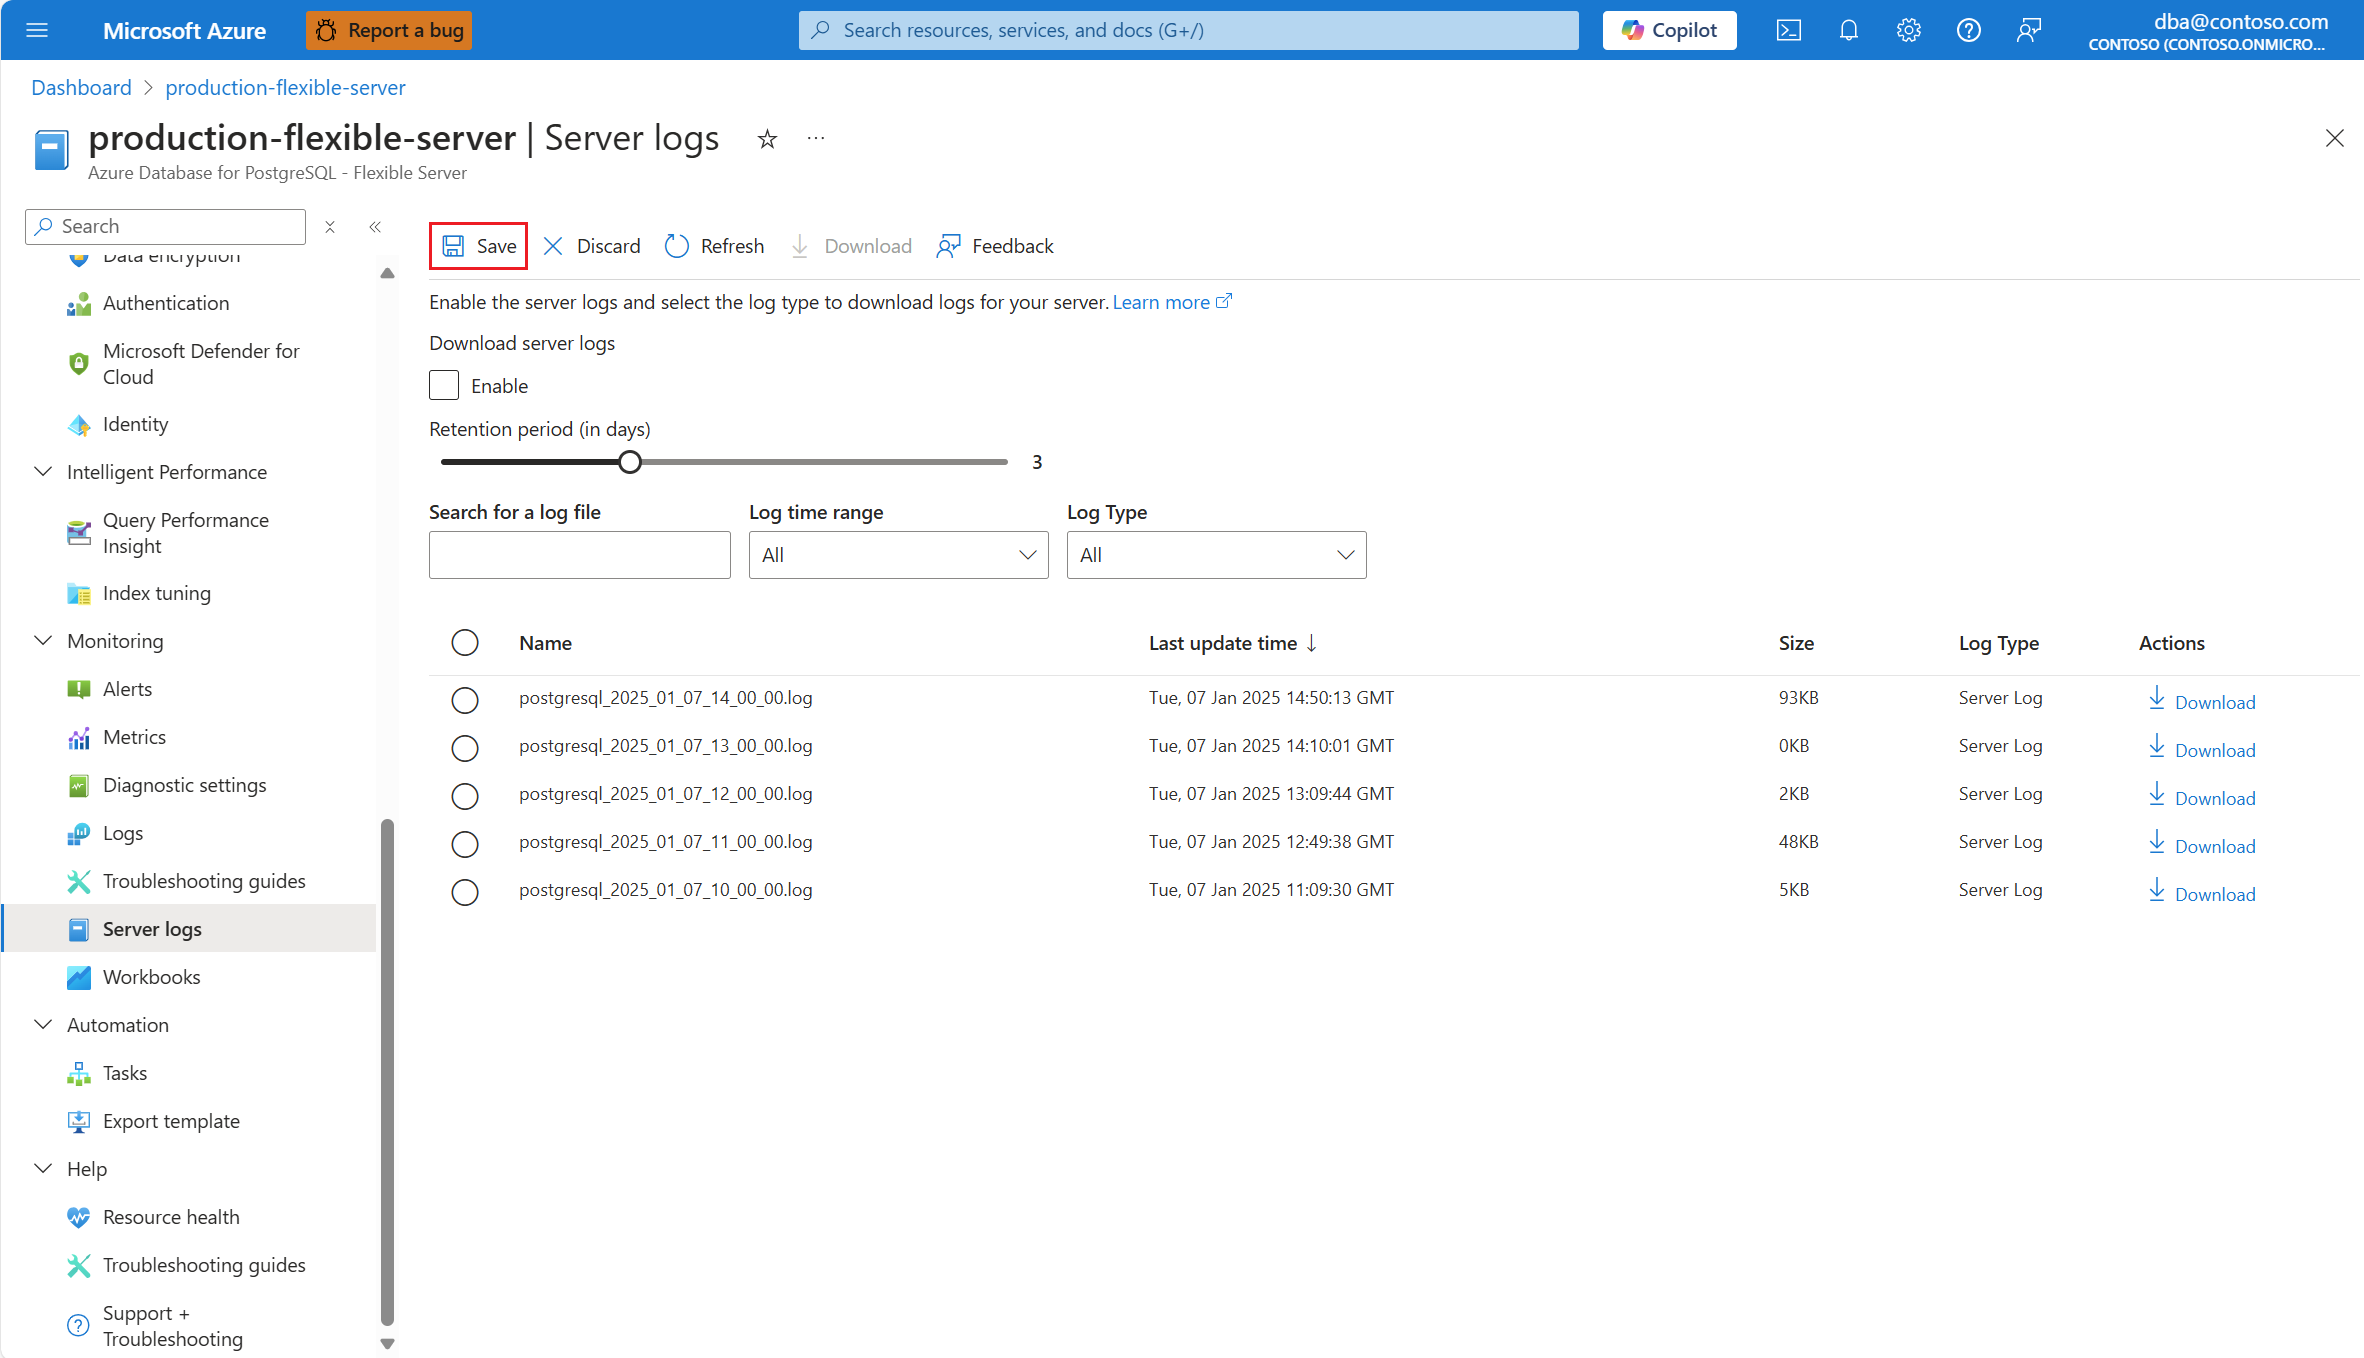
Under Download server logs, mark the Enable checkbox.
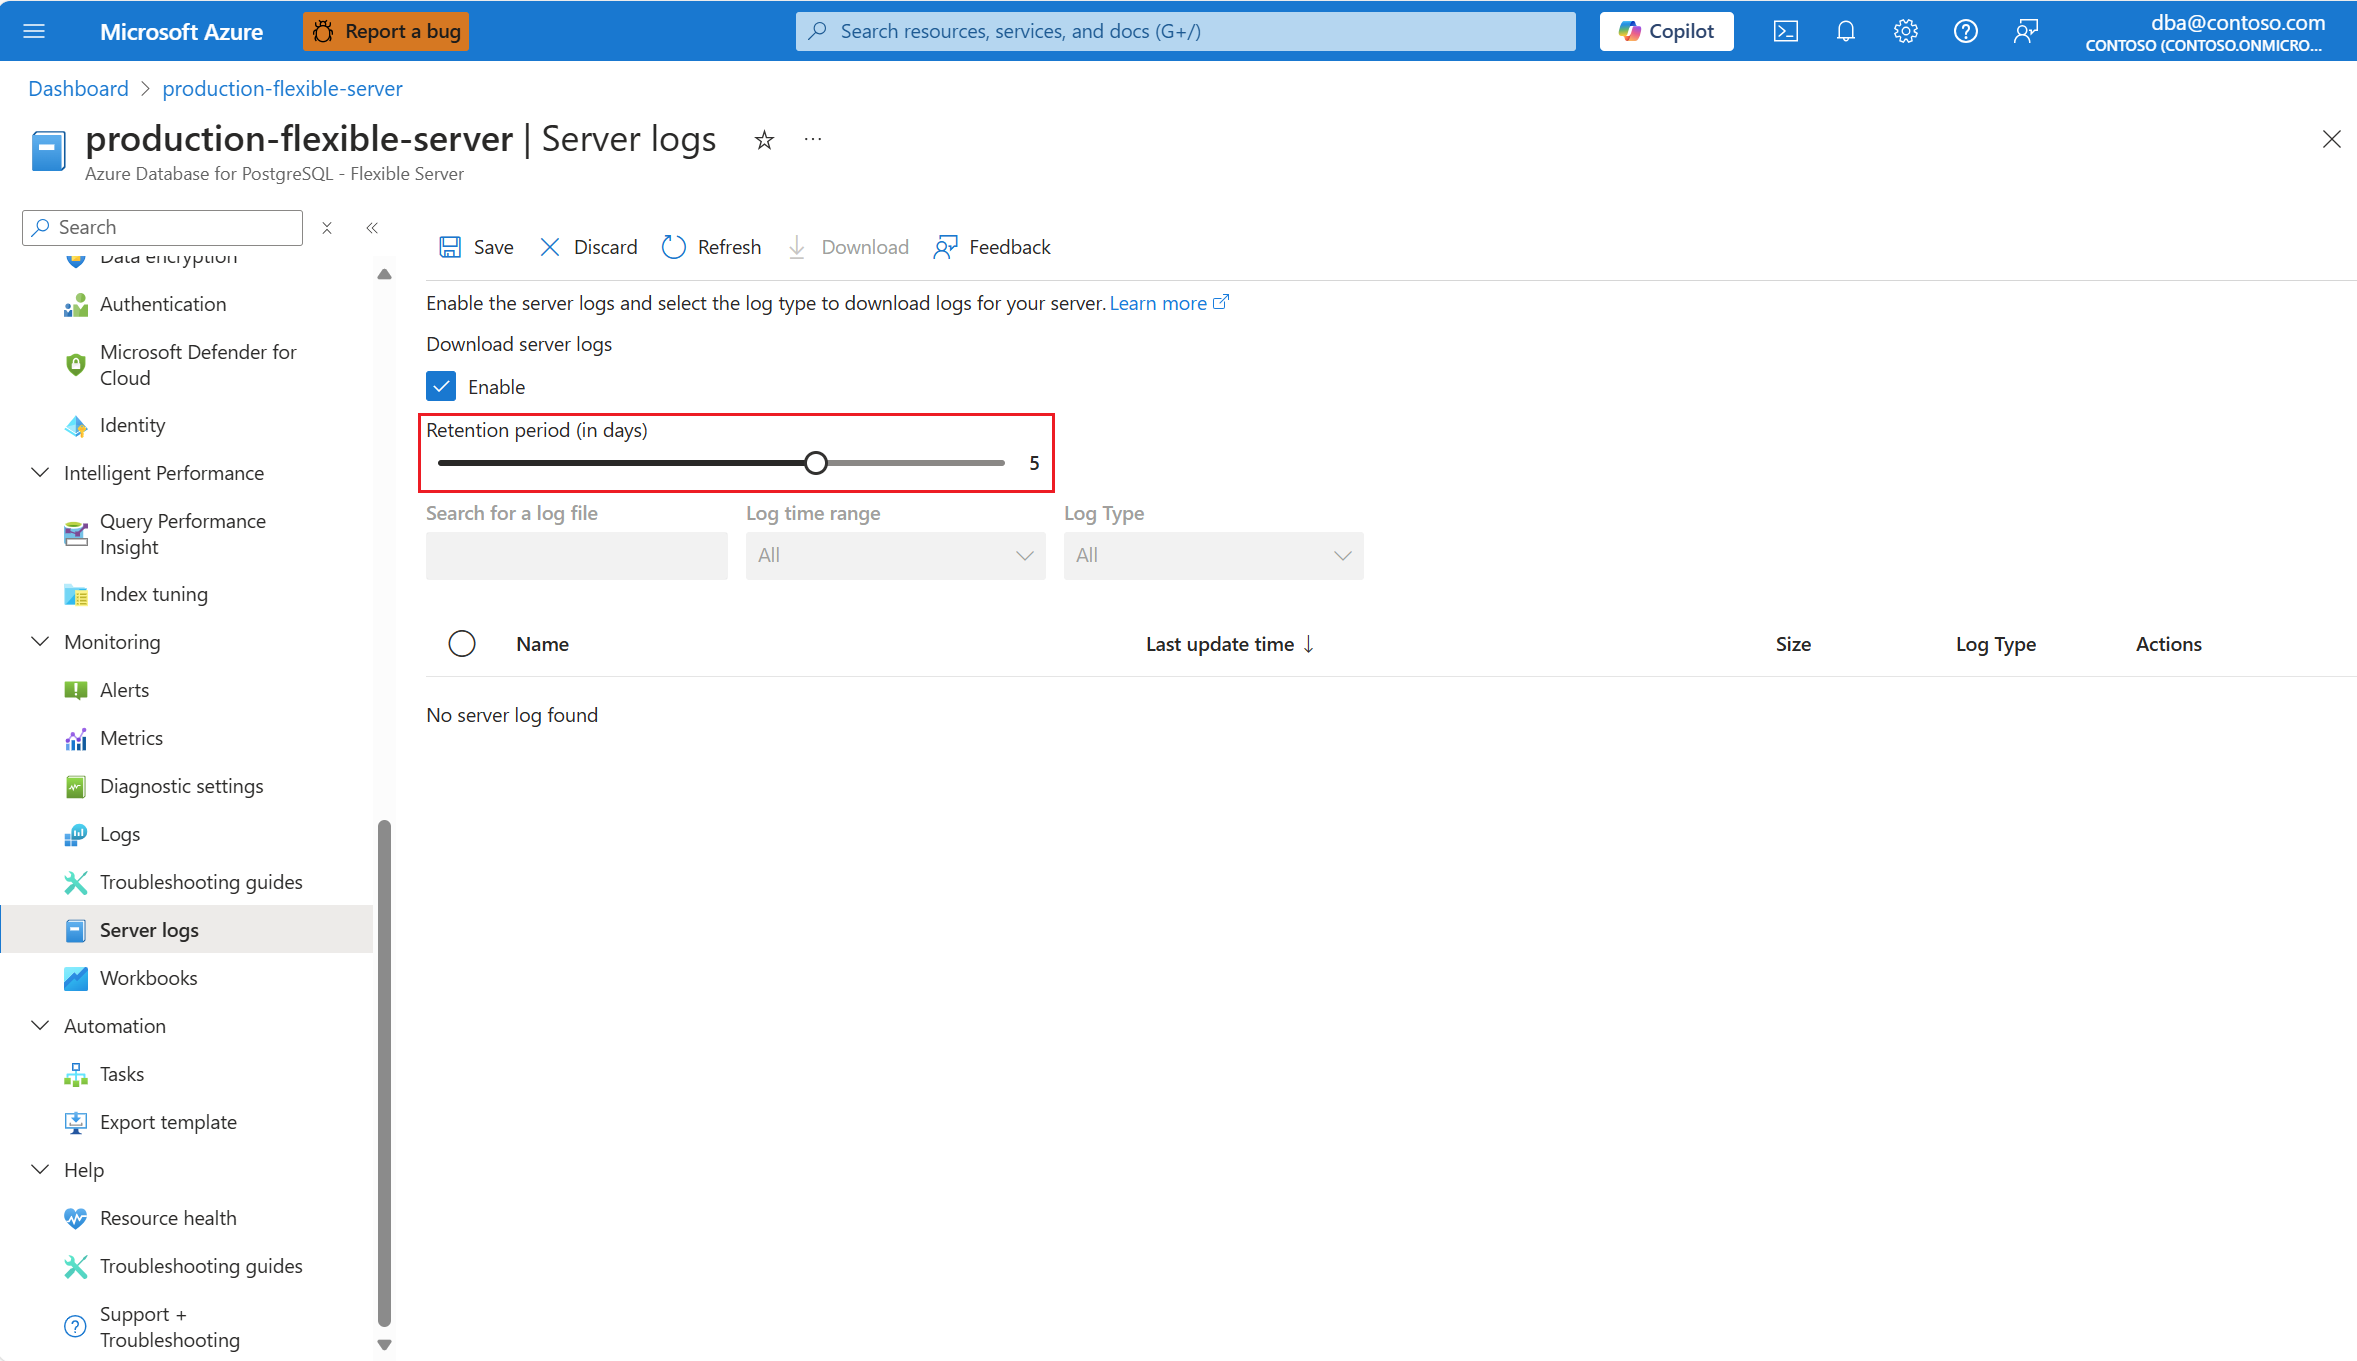
By default, log files are retained for three days, but you can adjust the retention period from 1 to 7 days. Use the Retention period (in days) slicer to adjust to your desired configuration.
Select the Save button.
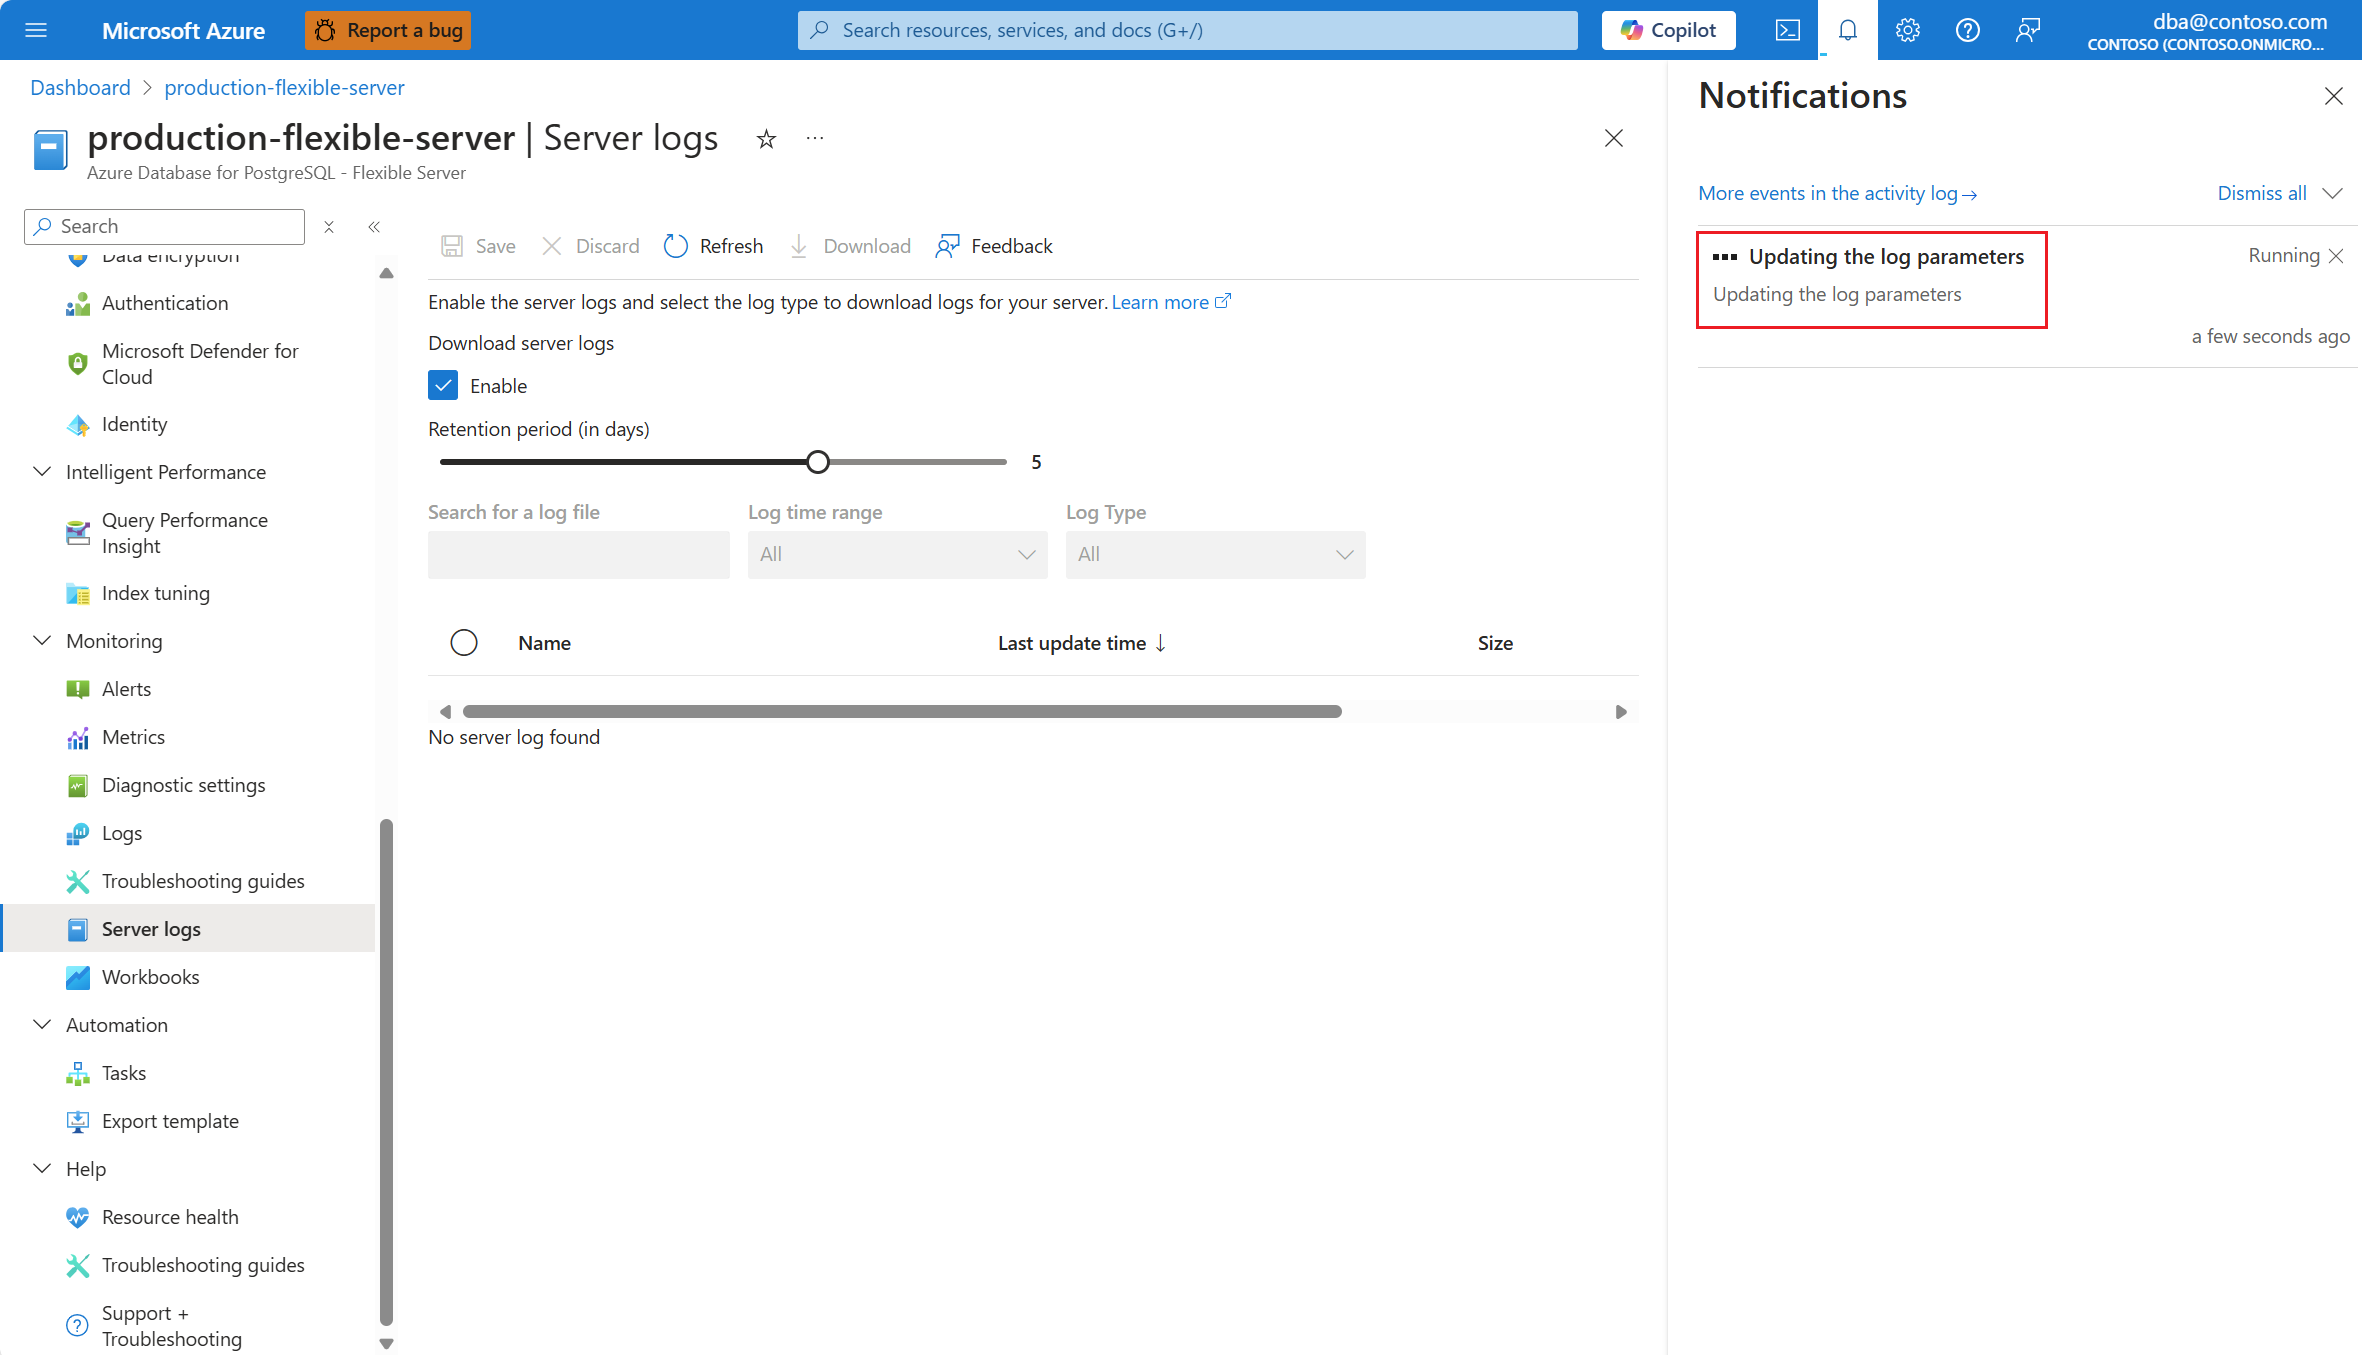
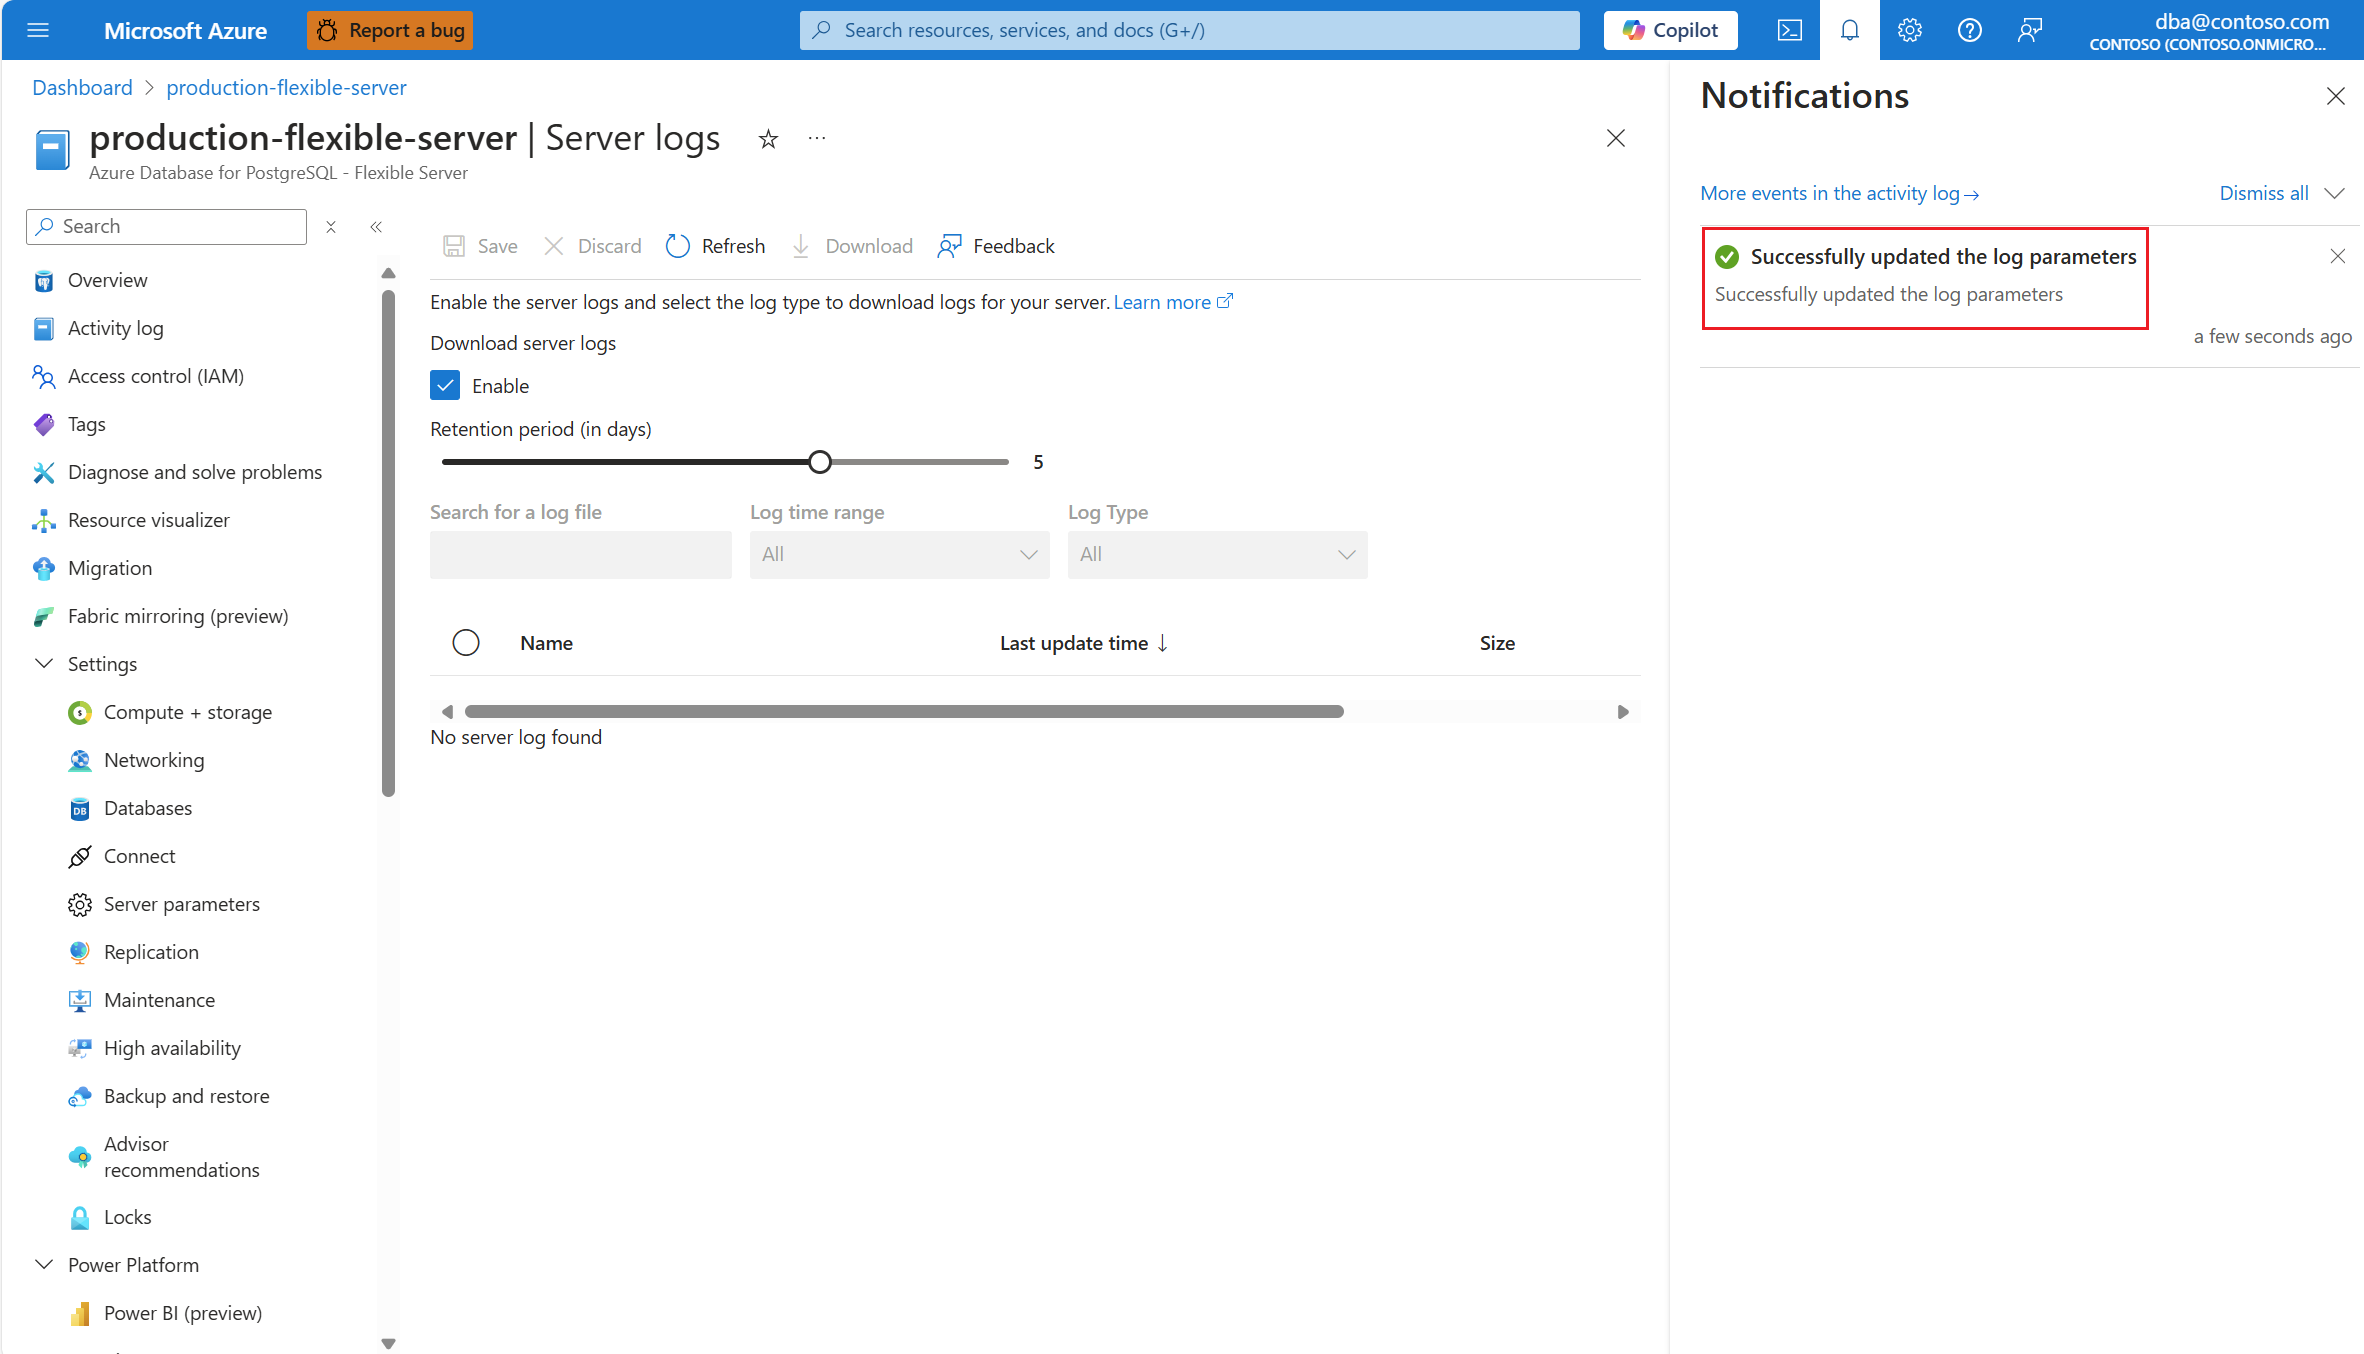
A notification informs you that the service is configuring the capture of logs for download.
Once the operation ends, a notification informs you that the service completed the configuration of the capture of logs for download.
Note
A few minutes after enabling the capture of server logs for download, the first log will be available for download.
Initially, and for approximately one hour, server logs occupy data disk space. Then, they're moved to backup storage and kept there for the configured retention period.
Steps to disable the capture of PostgreSQL and upgrade logs for download
Using the Azure portal:
Select your Azure Database for PostgreSQL flexible server.
In the resource menu, under the Monitoring section, select Server logs.
Under Download server logs, clear the Enable checkbox.
Select the Save button.
A notification informs you that the service is configuring the capture of logs for download.
Once the operation ends, a notification informs you that the service completed the configuration of the capture of logs for download.
Steps to list captured logs available for download
Using the Azure portal:
Select your Azure Database for PostgreSQL flexible server.
In the resource menu, under the Monitoring section, select Server logs.
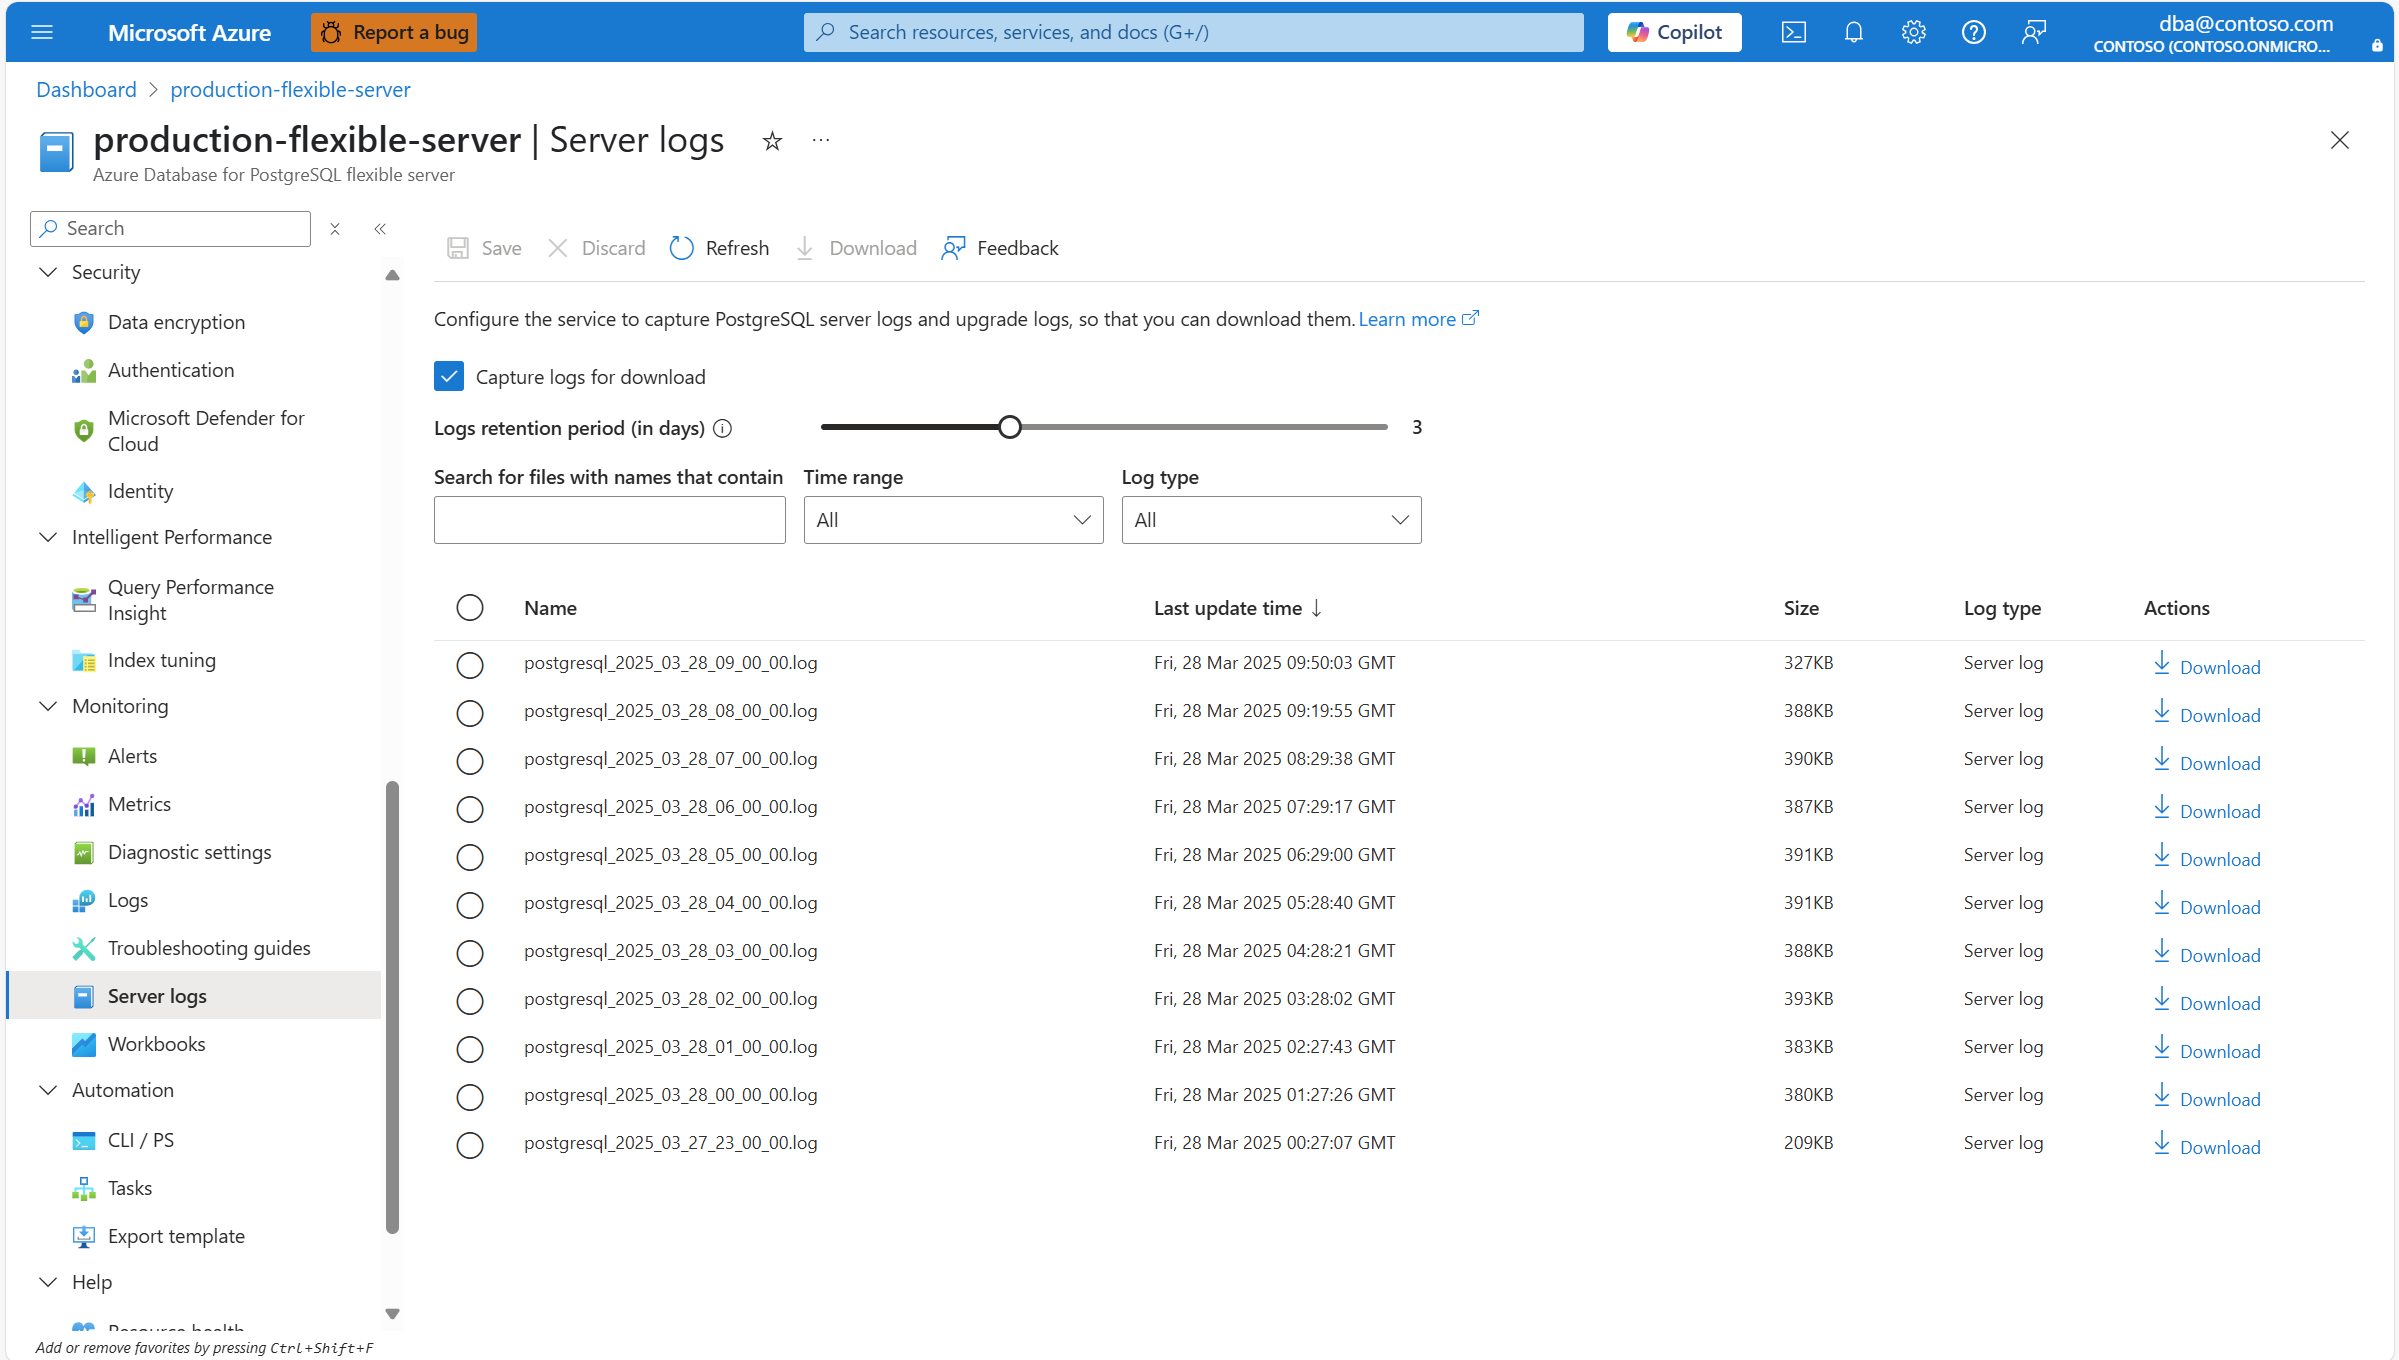
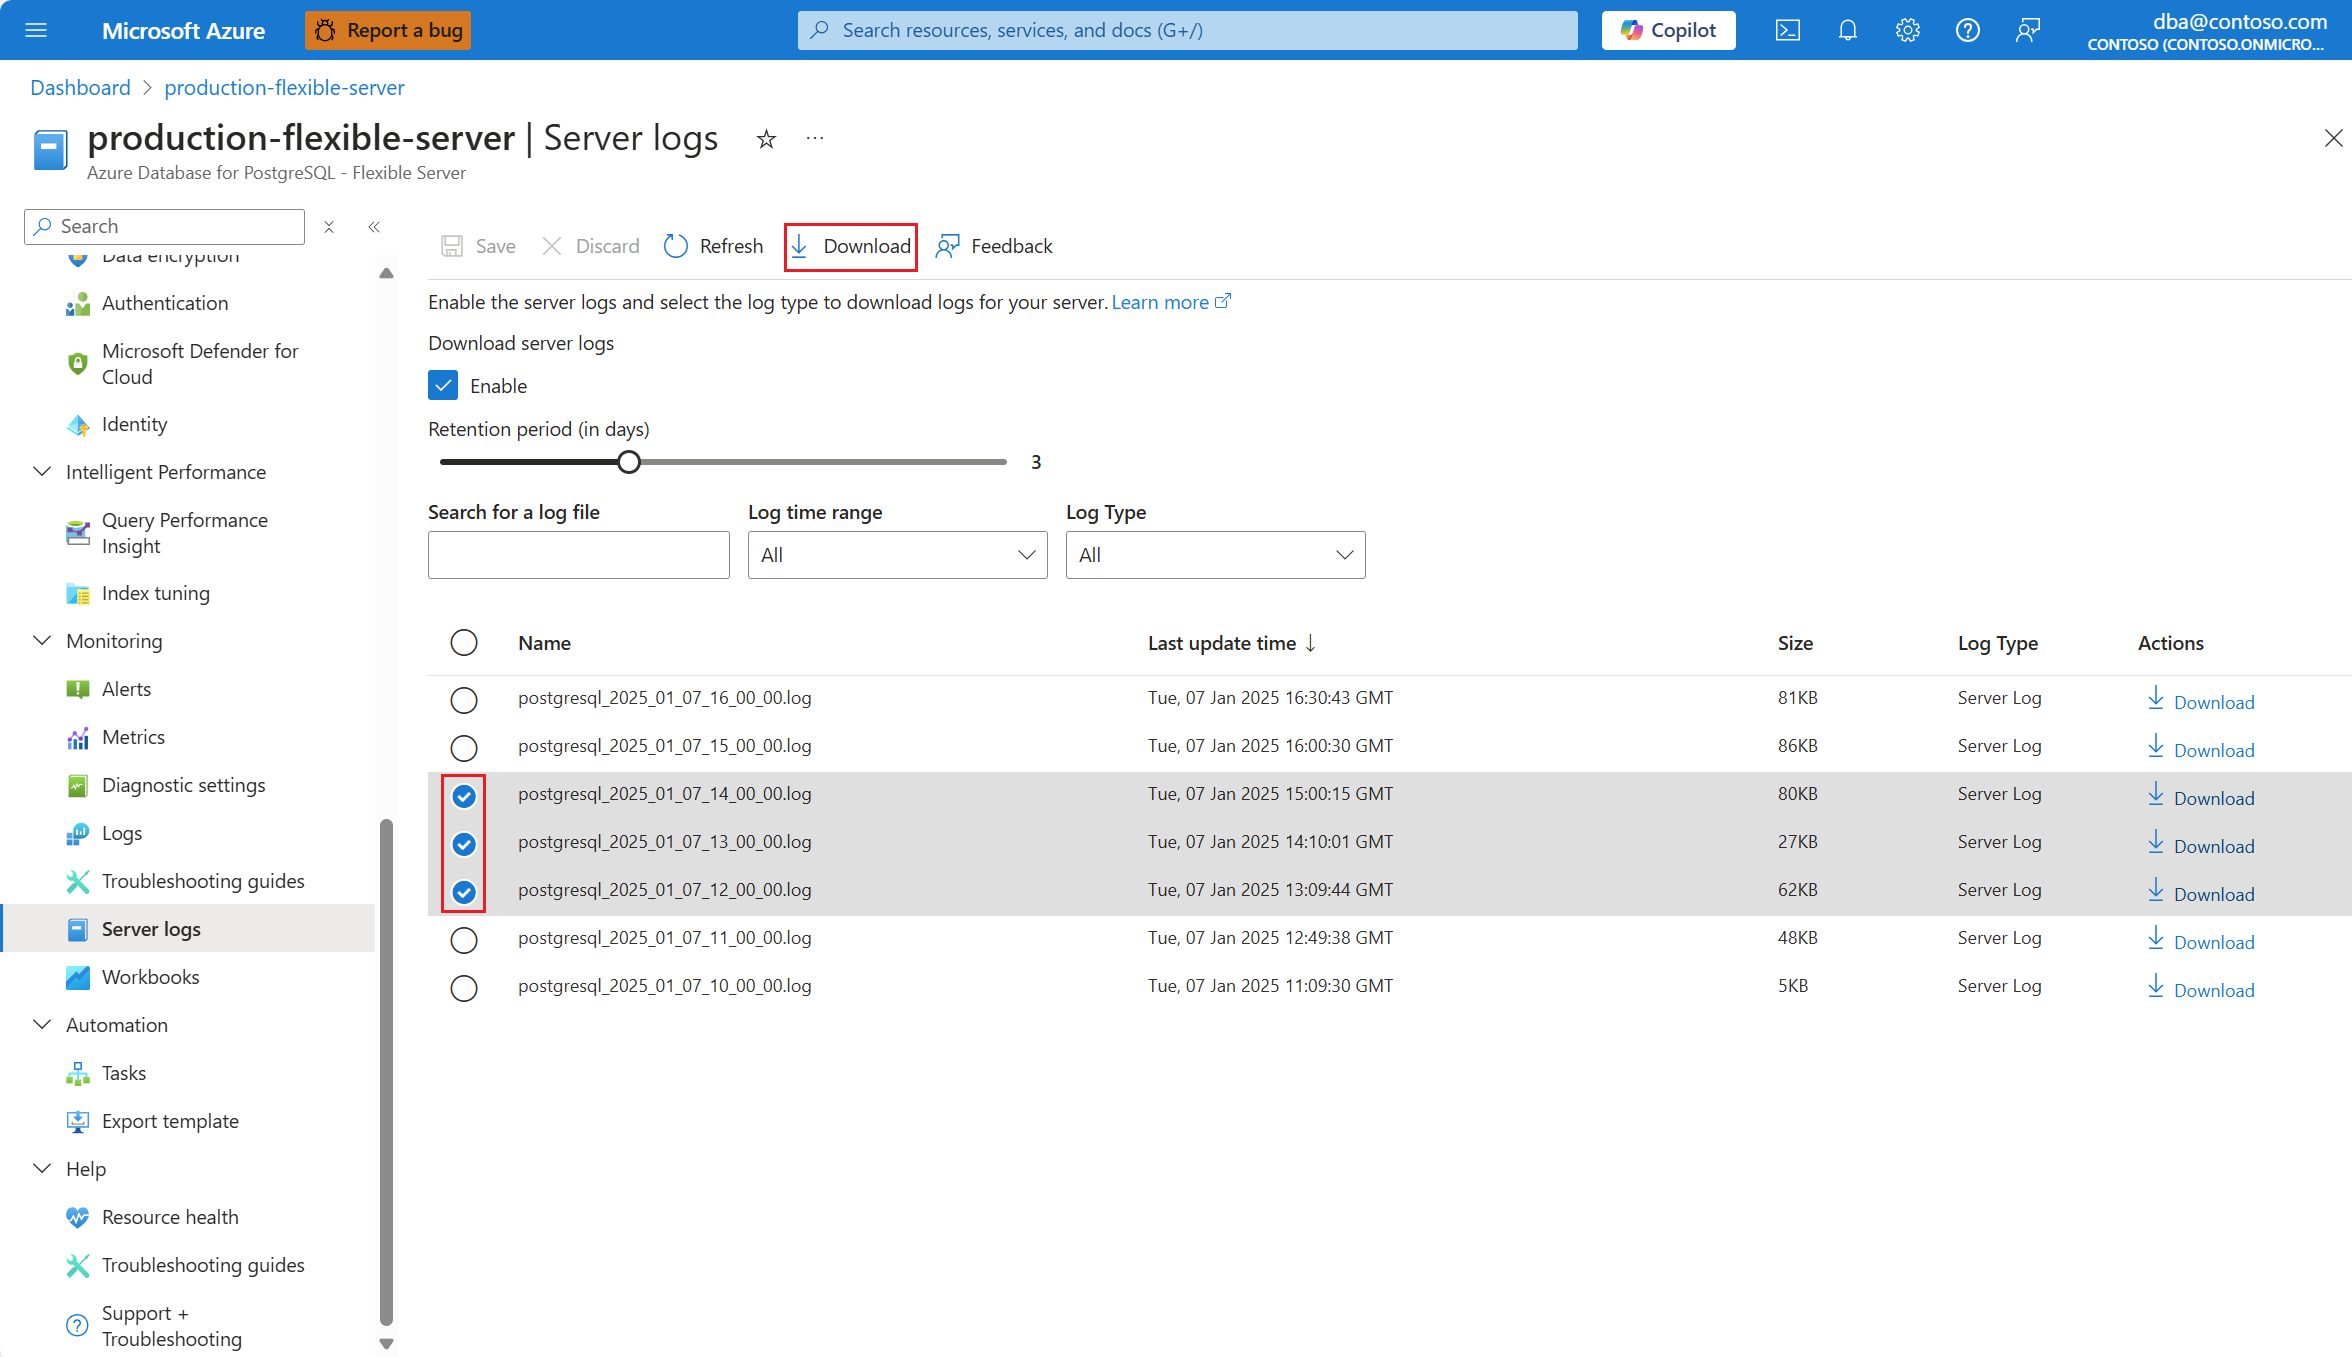
A table shows all captured log files which aren't deleted yet. Files which were captured at some point, but were deleted because they exceeded the configured retention period, aren't visible or accessible anymore. Using the Search for a log file, Log time range, and Log Type boxes, you can define filtering conditions to reduce the logs shown. By selecting a column header, you can sort the list of visible log files, in ascending or descending order, by the value of the attribute represented by the selected header. Under each available column, you can see the different attributes of each file:
- Name: Name of the log file. The service assigns each log file a name with this pattern
postgresql_yyyy_mm_dd_hh_00_00.log. - Last update time: Timestamp of the last time each log file was uploaded. Log files are uploaded, approximately, every 10 minutes.
- Size: Size in bytes occupied by the log file.
- Log Type: Server Log indicates the file corresponds to a PostgreSQL server log. Upgrade Log indicates the file corresponds to a major version upgrade log.
- Name: Name of the log file. The service assigns each log file a name with this pattern
Content of the table isn't automatically updated. To see the most recent information, you can select Refresh.
Steps to download captured logs
Using the Azure portal:
Select your Azure Database for PostgreSQL flexible server.
In the resource menu, under the Monitoring section, select Server logs.
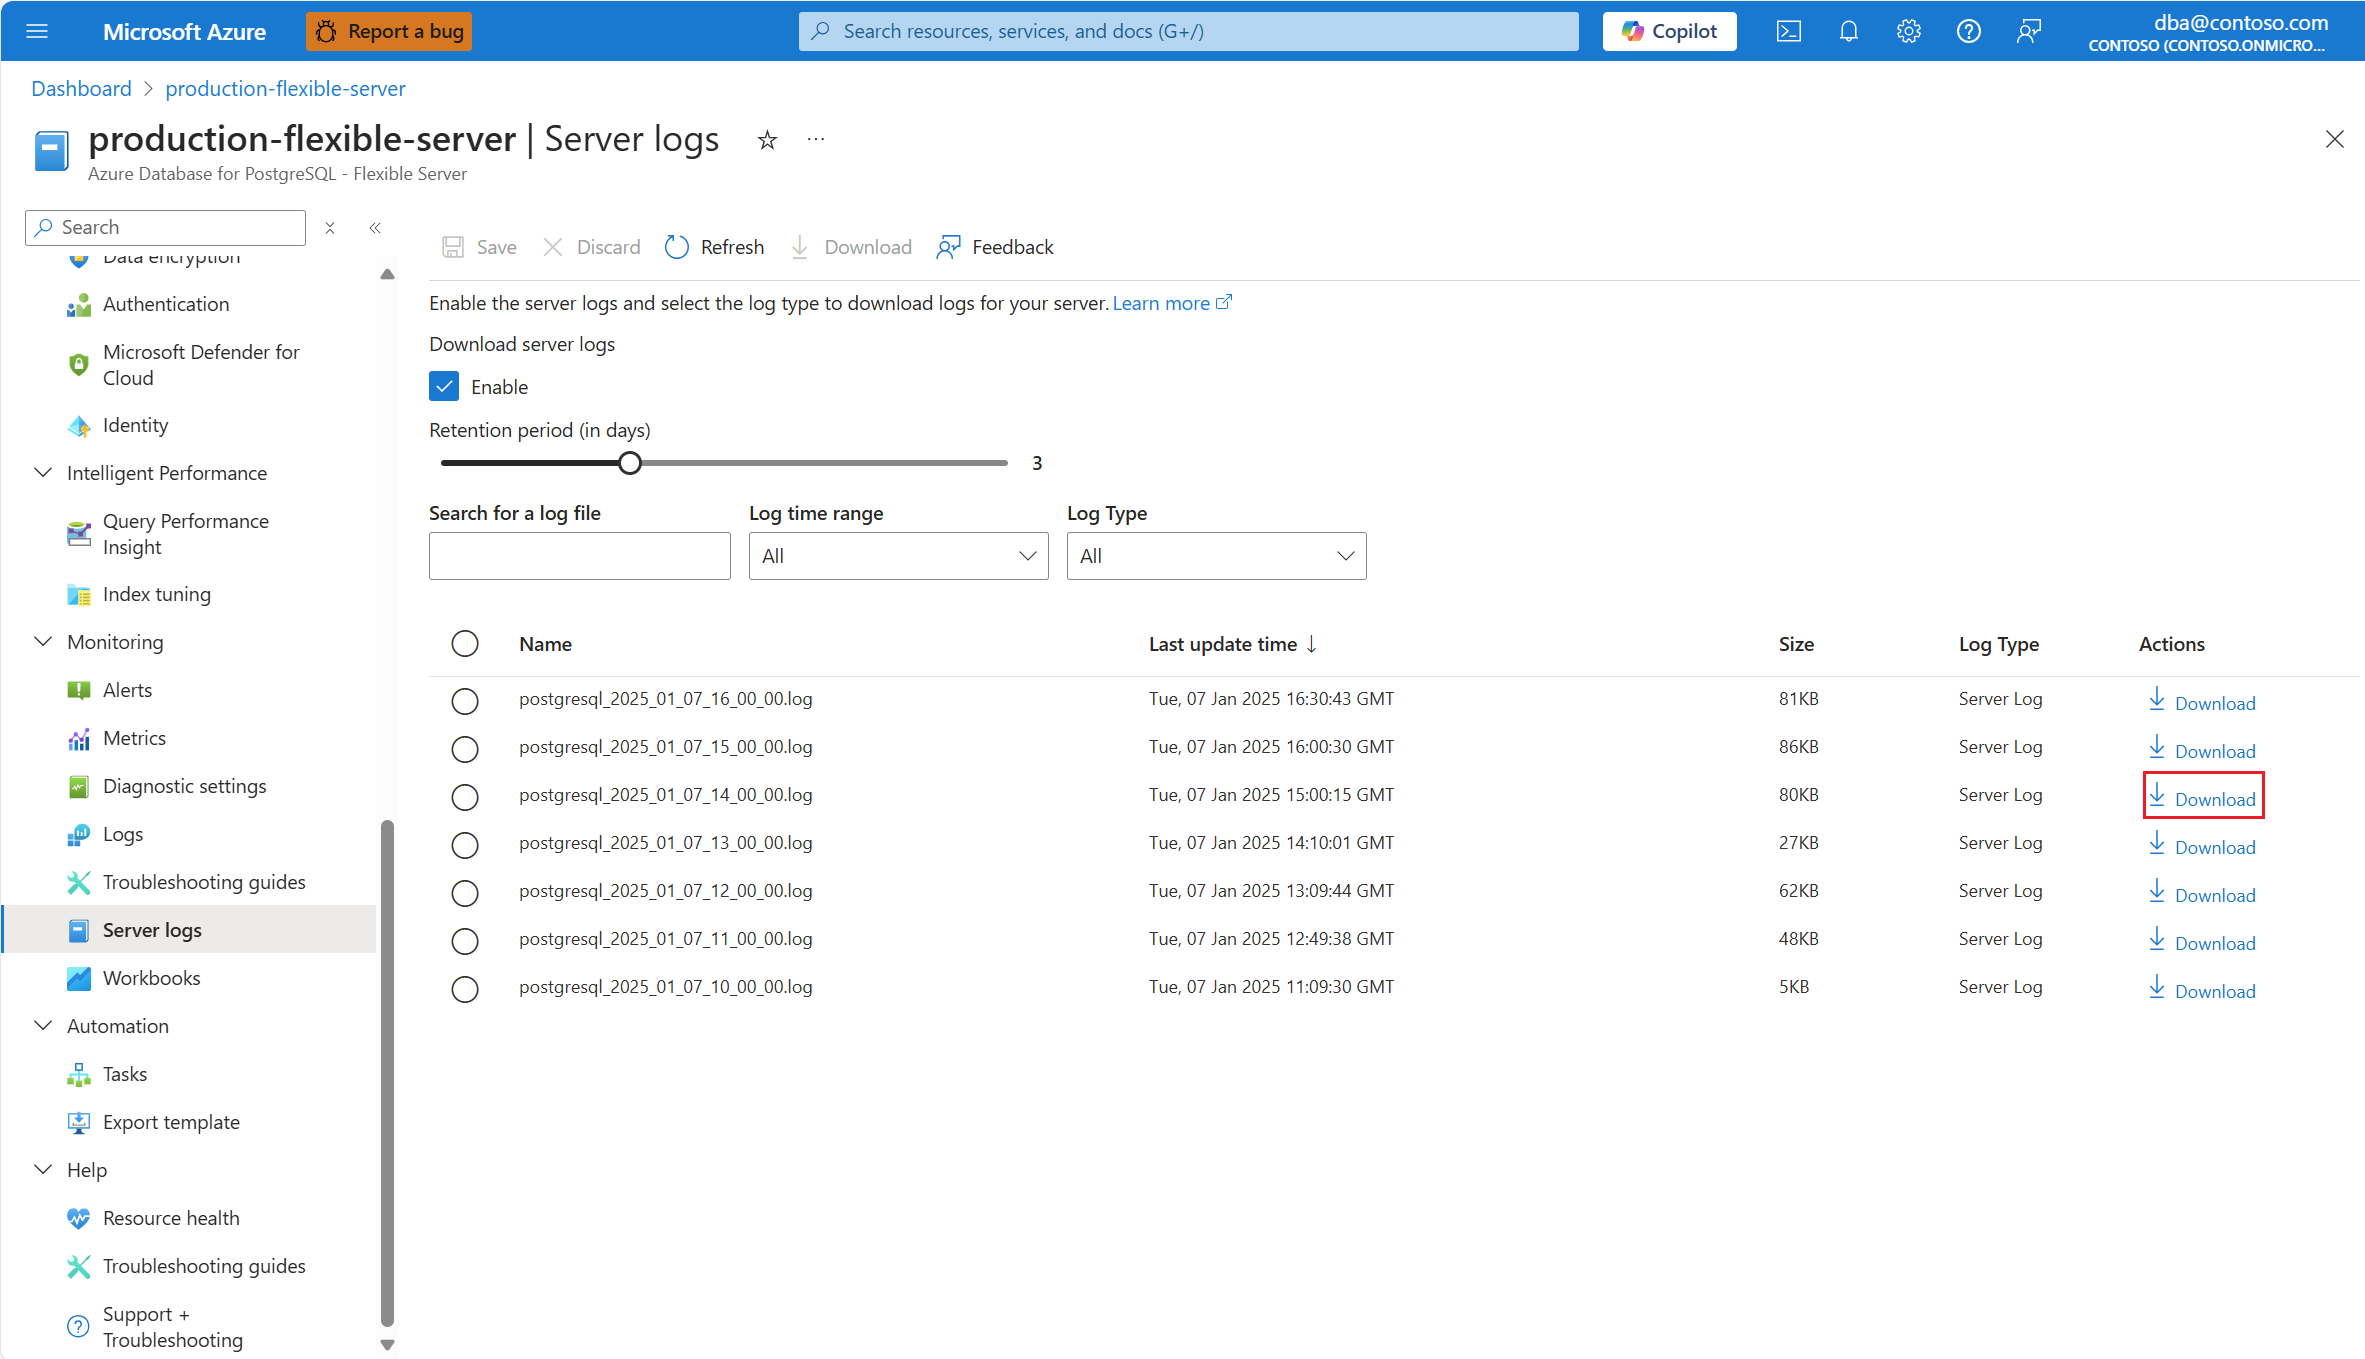
A table shows all captured log files which aren't deleted yet. Files which were captured at some point, but were deleted because they exceeded the configured retention period, aren't visible or accessible anymore. Using the Search for a log file, Log time range, and Log Type boxes, you can define filtering conditions to reduce the logs shown. By selecting a column header, you can sort the list of visible log files, in ascending or descending order, by the value of the attribute represented by the selected header. Identify the log that you want to download and, under the Actions column, select Download.
If you want to download multiple log files at one time, select all the files that you want to download, and select Download in the toolbar.
Content of the table isn't automatically updated. To see the most recent information, you can select Refresh.
