Enable scan statistics for queries
Note
We will retire Azure HDInsight on AKS on January 31, 2025. Before January 31, 2025, you will need to migrate your workloads to Microsoft Fabric or an equivalent Azure product to avoid abrupt termination of your workloads. The remaining clusters on your subscription will be stopped and removed from the host.
Only basic support will be available until the retirement date.
Important
This feature is currently in preview. The Supplemental Terms of Use for Microsoft Azure Previews include more legal terms that apply to Azure features that are in beta, in preview, or otherwise not yet released into general availability. For information about this specific preview, see Azure HDInsight on AKS preview information. For questions or feature suggestions, please submit a request on AskHDInsight with the details and follow us for more updates on Azure HDInsight Community.
Often data teams are required to investigate performance or optimize queries to improve resource utilization or meet business requirements.
A new capability has been added in Trino for HDInsight on AKS that allows user to capture Scan statistics for any connector. This capability provides deeper insights into query performance profile beyond what is available in statistics produced by Trino.
You can enable this feature using session property collect_raw_scan_statistics, and by following Trino command:
SET SESSION collect_raw_scan_statistics=true
Once enabled, source operators in the query like TableScanOperator, ScanFilterAndProject etc. have statistics on data scans, the granularity is per operator instance in a pipeline.
Tip
Scan stats are helpful in identifying bottlenecks when the cluster or query is not CPU constrained, and read performance of the query needs investigation. It also helps to understand the execution profile of the query from a split level perspective.
Note
Currently, captured number of splits per worker is limited to 1000 due to size constraints of produced data. If the number of splits per worker for the query exceeds this limit, top 1000 longest running splits are returned.
How to access scan statistics
Once the session property is set, subsequent queries in the session start capturing statistics from source operators whenever they're available. There are multiple ways users can consume and analyze scan statistics generated for a query.
Query Json
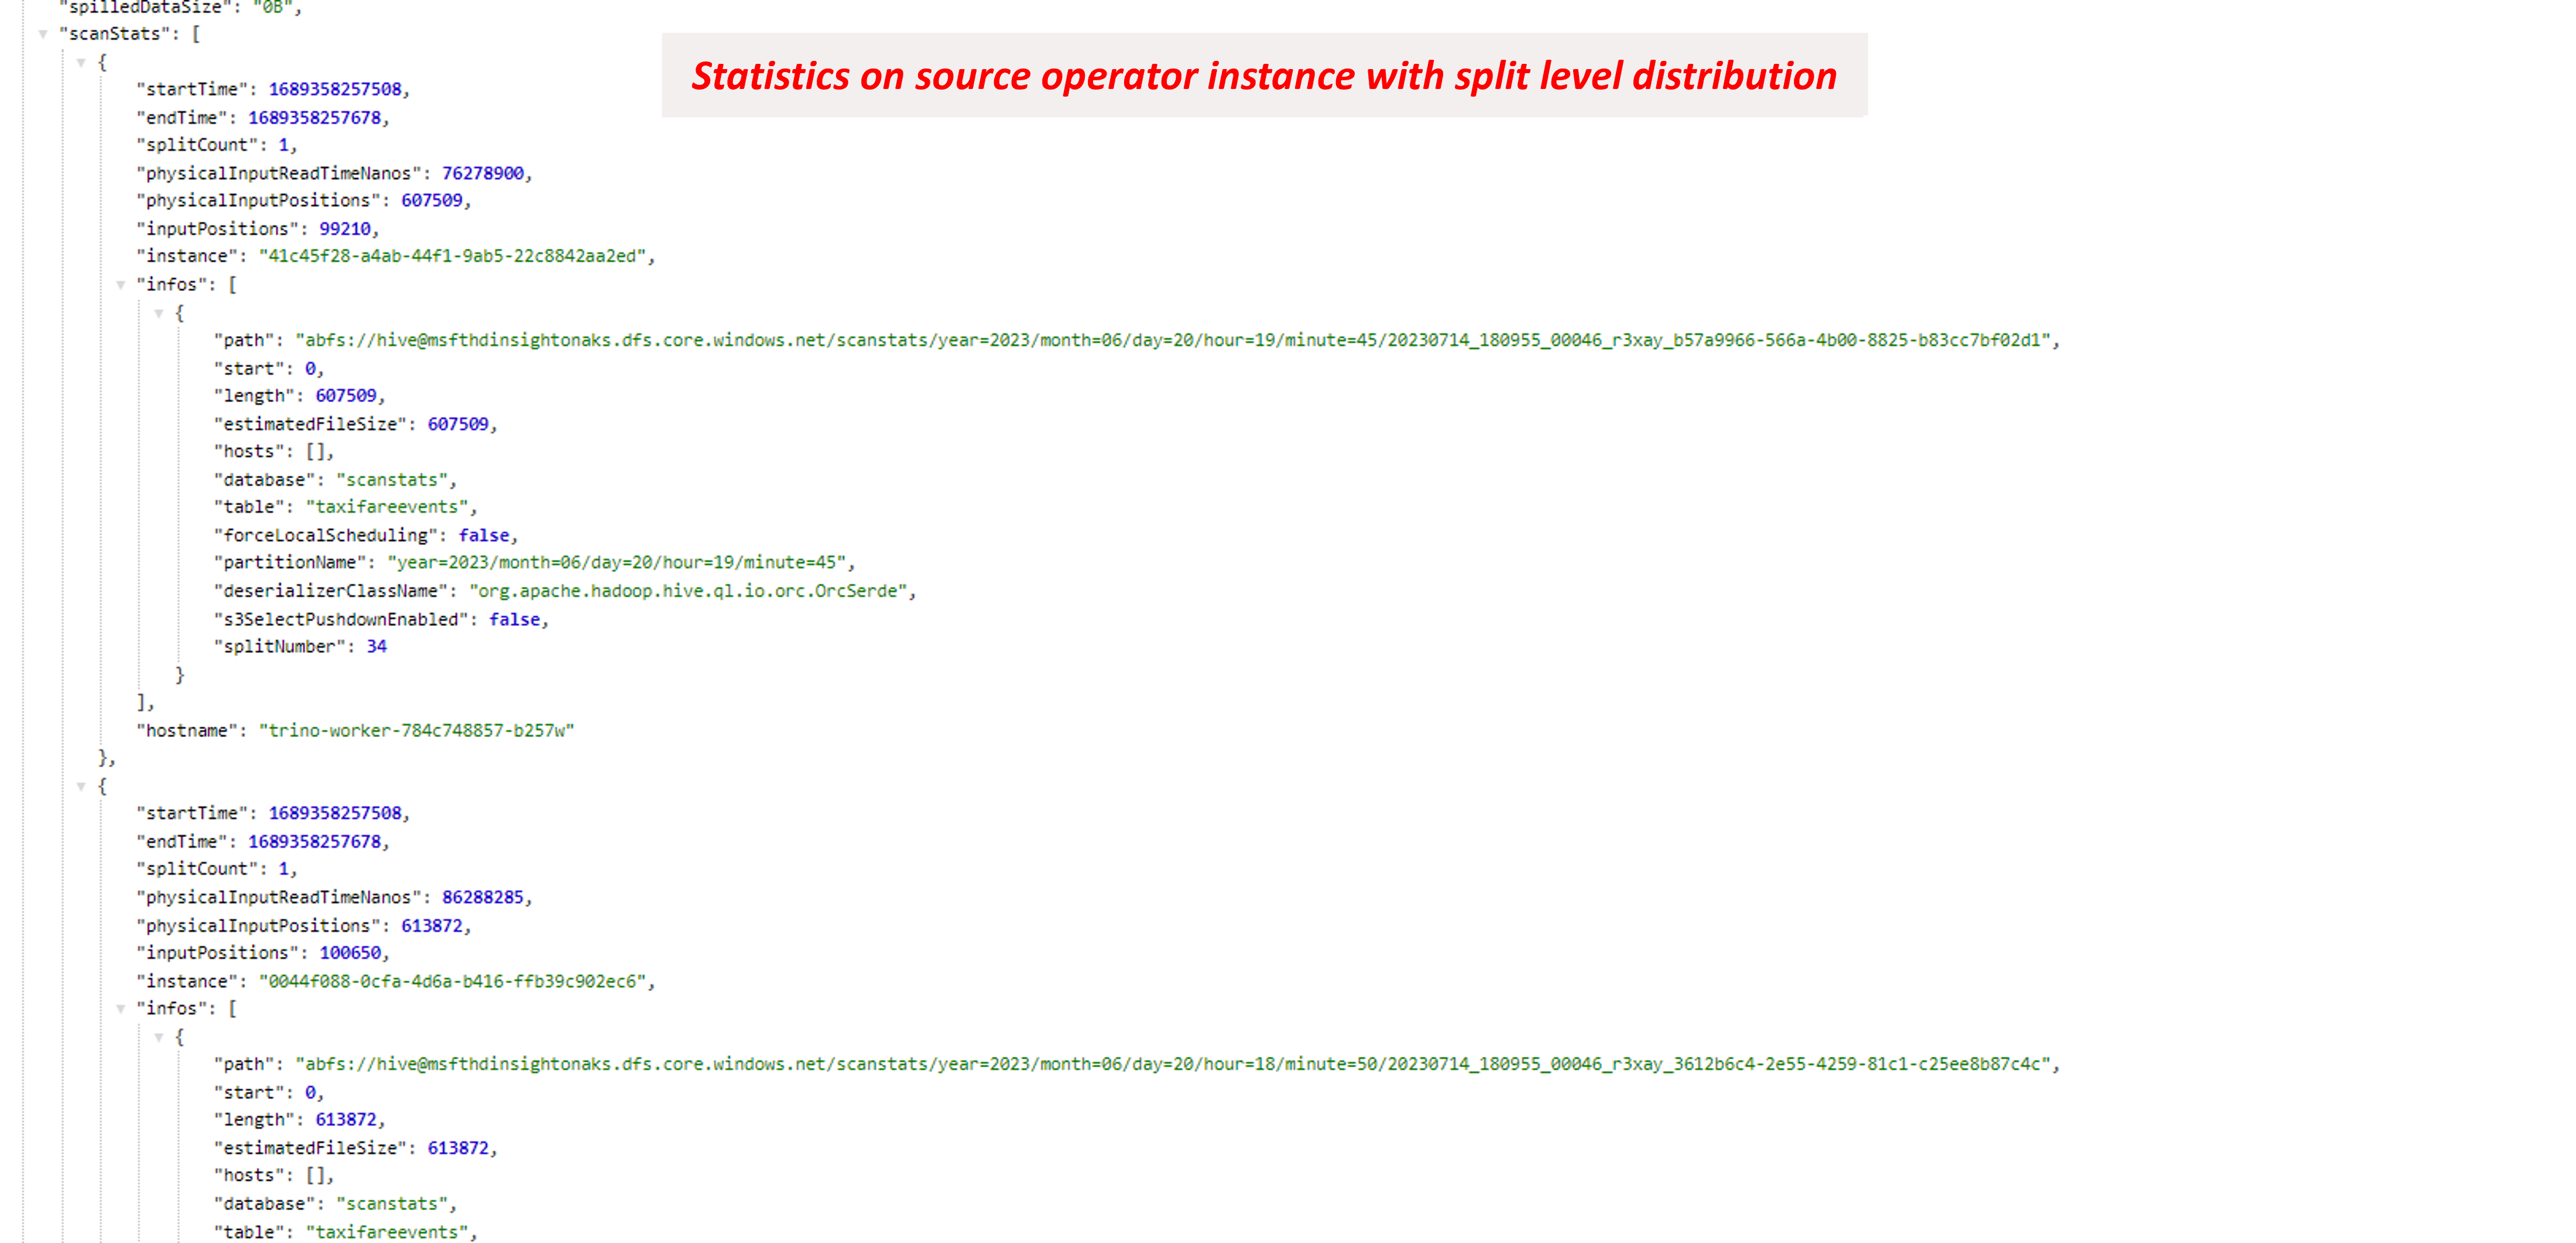
The Json tab on Query details page provides the JSON representation of query, which included statistics on every stage, pipeline of the query. When the session property is set, the json includes a new field called scanStats in queryStats.operatorSummaries[*]. The array contains one object per instance of operator.
The following example shows a json for a query using hive connector and scan statistics enabled.
Note
The scan statistics summary includes splitInfo which is populated by the connector. This allows users to control what information about the store they would like to include in their custom connectors.
Scan Statistics UI
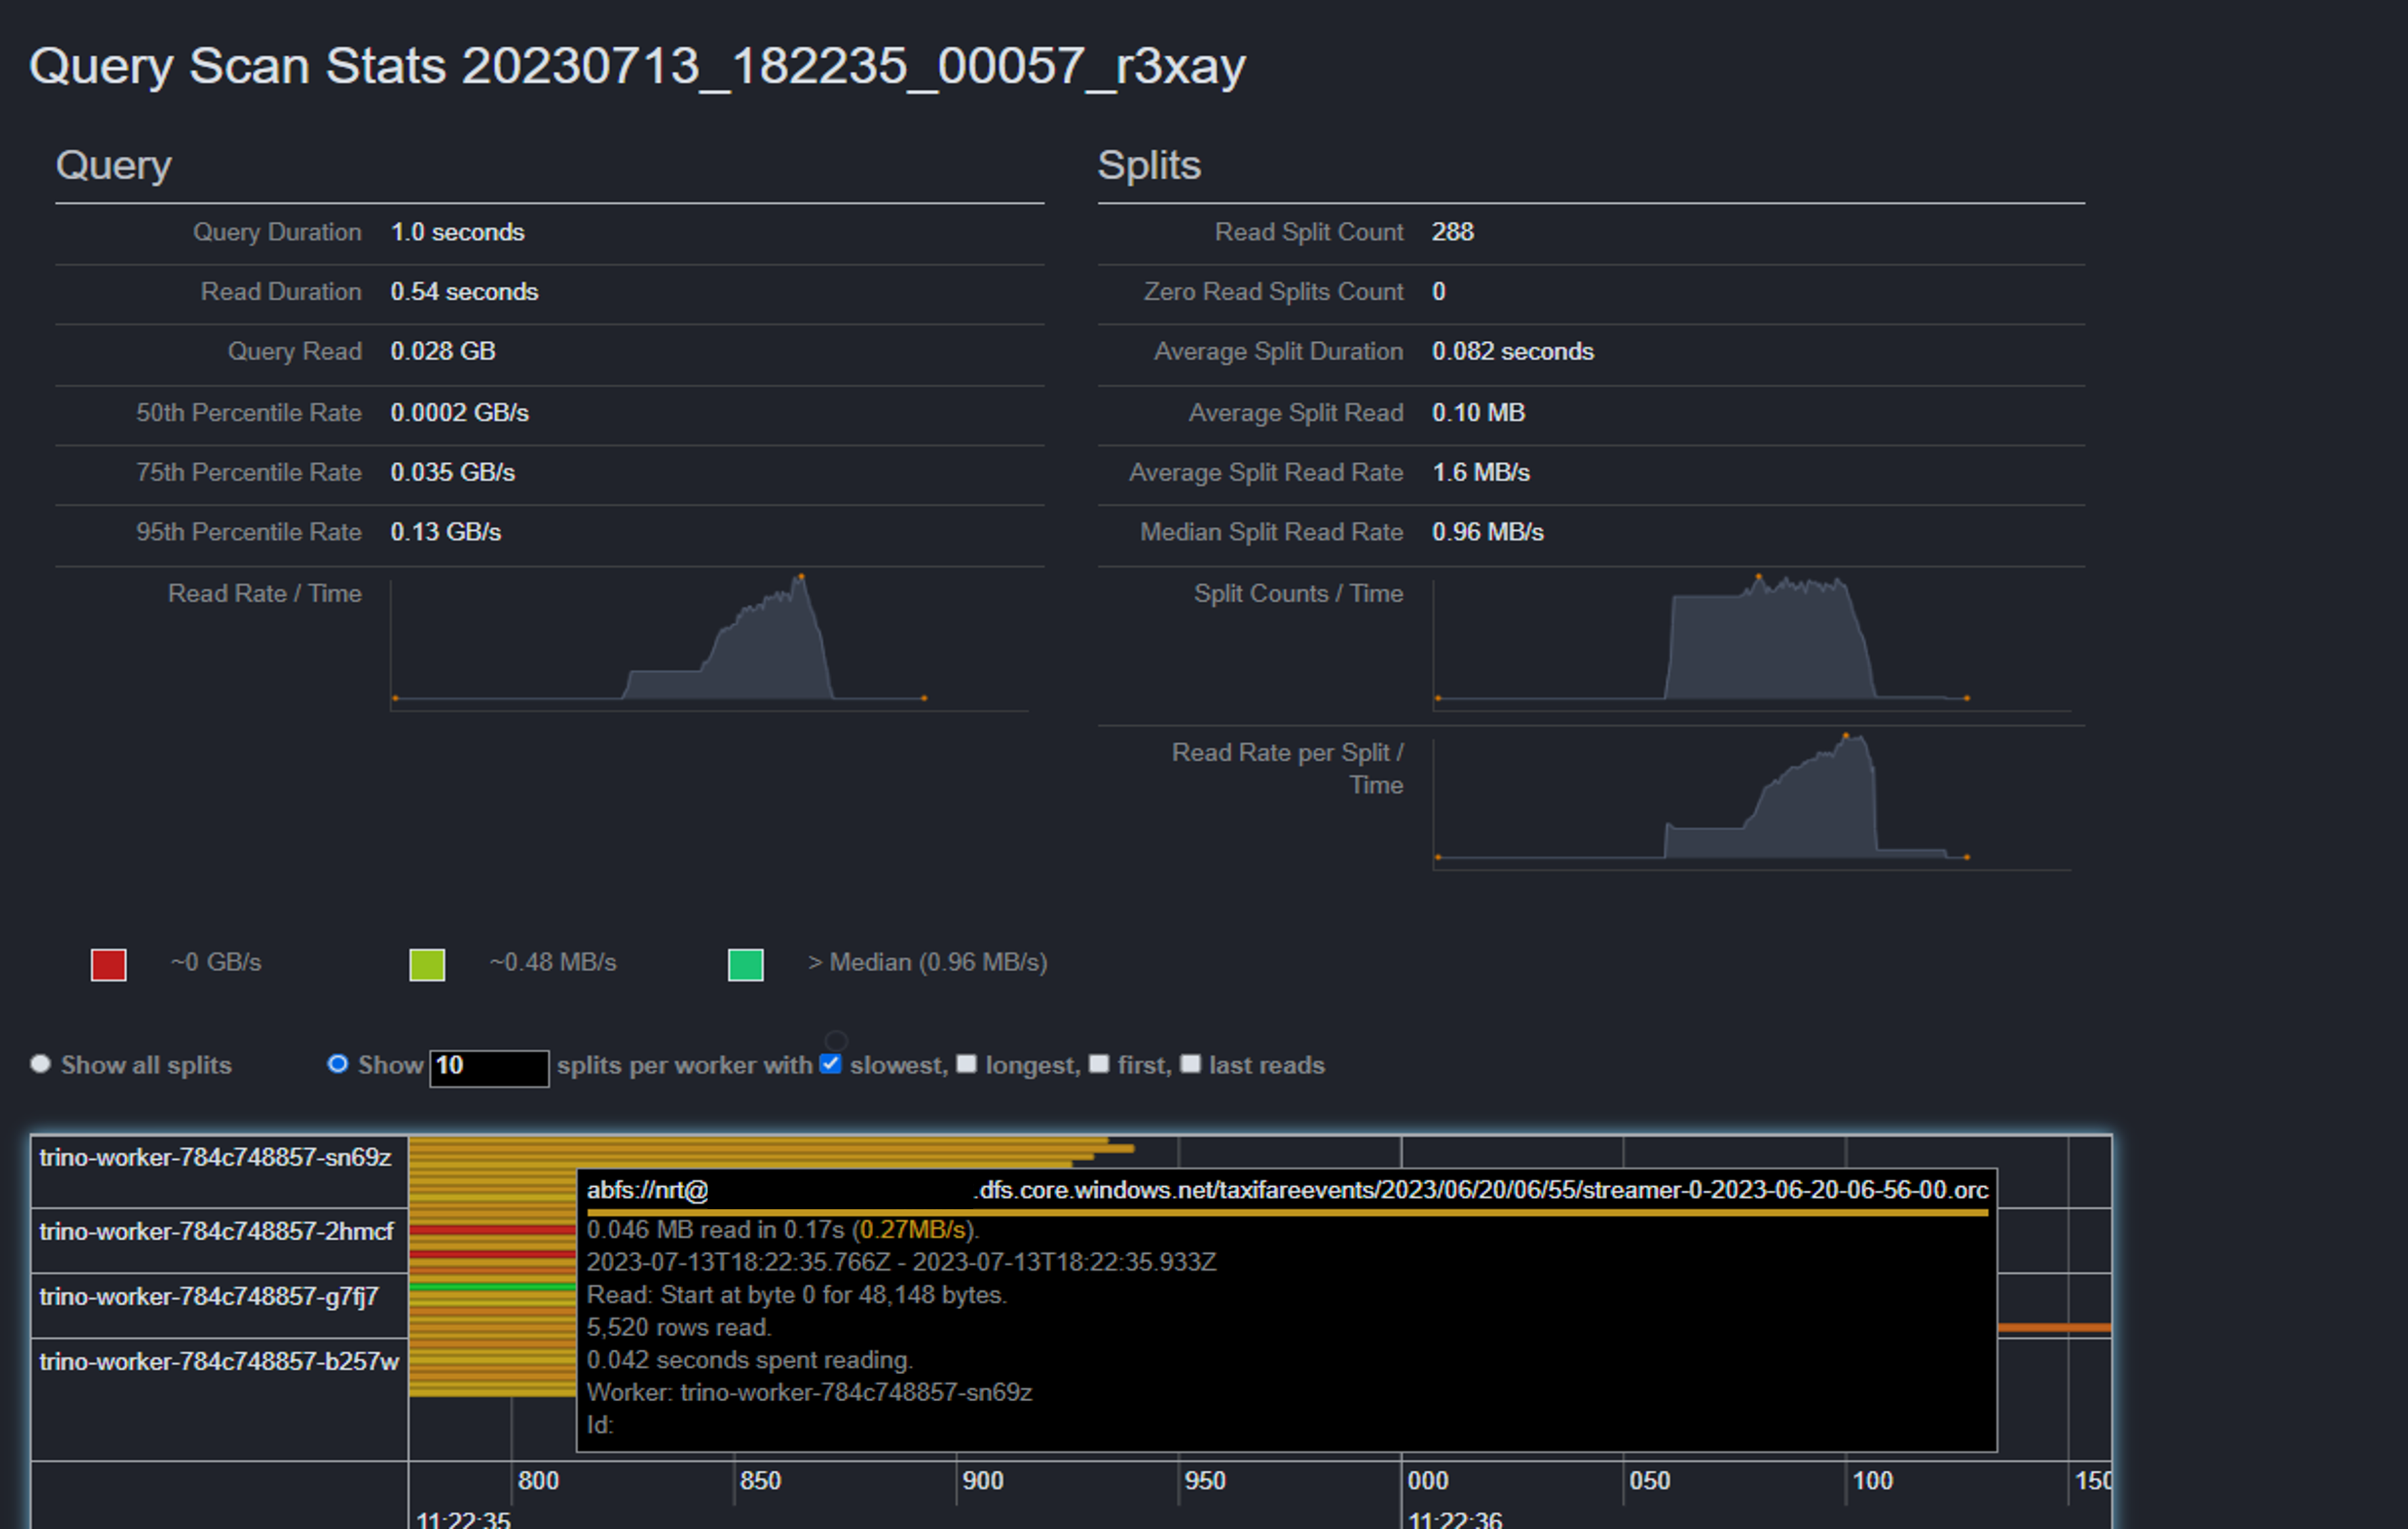
You can find a new tab called Scan Stats in Query details page that visualizes the statistics produced by this feature and provides insights in split grain performance of each worker. The page allows users to view trino's execution profile for the query with information like, concurrent reads over time and throughput.
The following example shows a page for a query with scan statistics enabled.
Using Microsoft Query logger**
Microsoft Query logger has builtin support for this feature. When enabled with this feature, the query logger plugin populates a table called operatorstats along with the query events table, this table is denormalized so that every operator instance is one row for each query.


