Query history
Note
If your workspace is enabled for serverless compute, your query history also contains all SQL and Python queries run on serverless compute for notebooks and jobs. See Connect to serverless compute.
If your workspace has Query History & Profile for DLT enabled (Public Preview), your query history shows CREATE and REFRESH statements run on a SQL warehouse or through a Delta Live Tables pipeline.
You can use the information available through this screen to help you debug issues with queries.
This section describes how to work with query history using the UI. To work with query history using the API, see Query History.
View query history
To view previous runs for a query:
- Click
 Query History in the sidebar.
 - Optionally, use the filters near the top of the page to filter the list by user, date range, compute, duration, query status, statement type, and statement ID.
For Databricks SQL queries, non-admin users without at least CAN MONITOR permissions can only view their own queries in Query History.
Note
Databricks SQL queries shared by a user with Run as Owner permissions to another user with CAN RUN permissions appear in the query history of the user executing the query and not the user that shared the query.
View query details
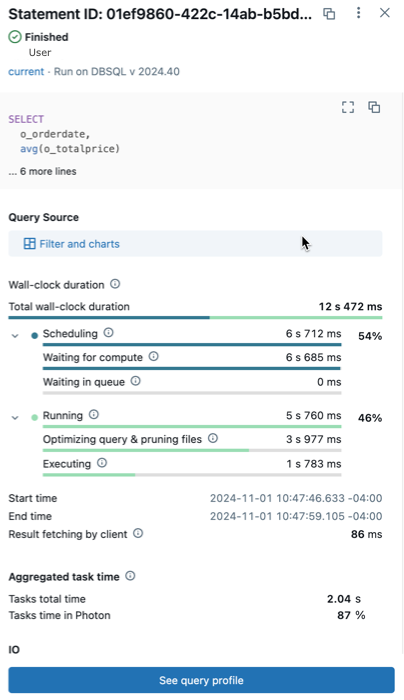
To view details about a query, such as the complete query statement, query source, duration, number of rows returned, and I/O performance, or execution details.
View query history.
Click the name of a query.

- Statement ID: This is the universally unique identifier (UUID) associated with the given query object.
- Query status: The query is tagged with its current status: Queued, Running, Finished, Failed, or Cancelled.
- Compute type: This field shows the compute type used for the query.
- Query statement: This section includes the complete query statement. If the query is too long to be shown in the preview, click the
 Expand query icon to see the full text.
 - Query source: This field shows where the query originated. Queries can come from a variety of sources, including AI/BI dashboards, query objects, the Databricks SQL editor, notebooks, and Delta Live Tables pipelines (Public Preview).
- Wall-clock duration: Shows the elapsed wall-clock time between the start of scheduling and the end of query execution. The total is automatically displayed as the sum of scheduling time and running time. To learn more, each of those fields can be expanded into sub-categories.
- Summary details: The bottom of the panel includes summary details about the query’s performance, including aggregated task time, rows read and returned, files and partitions, and any spilling that might have occurred.
For more detailed information about the query’s performance, including its execution plan, click View Query Profile near the bottom of the page. For more details, see Query profile.
Terminate an executing query
To terminate a long-running query started by you or another user:
View query history.
Click the name of a query.
Next to Status, click Cancel.
Note
Cancel only appears when a query is running.
The query is terminated, and its status changes to Canceled.
Note
Statements that use Delta Live Tables compute can only be canceled from the Pipelines UI.
Access the query history system table
Azure Databricks system tables include a query history table (system.query.history) where privileged users can view tabular query history records from across your account. By default, only admins have access to your account’s system tables. For information on enabling and accessing the query history system table, see Query history system table reference.