Monitor served models using AI Gateway-enabled inference tables
Important
This feature is in Public Preview.
Important
This article describes topics that apply to inference tables for external models, provisioned throughput workloads, or agent models. For custom models, see Inference tables for monitoring and debugging models.
This article describes AI Gateway-enabled inference tables for monitoring served models. The inference table automatically captures incoming requests and outgoing responses for an endpoint and logs them as a Unity Catalog Delta table. You can use the data in this table to monitor, evaluate, compare, and fine-tune machine learning models.
What are AI Gateway-enabled inference tables?
AI Gateway-enabled inference tables simplify monitoring and diagnostics for models by continuously logging serving request inputs and responses (predictions) from Mosaic AI Model Serving endpoints and saving them into a Delta table in Unity Catalog. You can then use all of the capabilities of the Databricks platform, such as Databricks SQL queries and notebooks to monitor, debug, and optimize your models.
You can enable inference tables on existing or newly created model serving endpoint, and requests to that endpoint are then automatically logged to a table in Unity Catalog.
Some common applications for inference tables are the following:
- Create a training corpus. By joining inference tables with ground truth labels, you can create a training corpus that you can use to retrain or fine-tune and improve your model. Using Databricks Jobs, you can set up a continuous feedback loop and automate re-training.
- Monitor data and model quality. You can continuously monitor your model performance and data drift using Lakehouse Monitoring. Lakehouse Monitoring automatically generates data and model quality dashboards that you can share with stakeholders. Additionally, you can enable alerts to know when you need to retrain your model based on shifts in incoming data or reductions in model performance.
- Debug production issues. Inference tables log data like HTTP status codes, request and response JSON code, model run times, and traces output during model run times. You can use this performance data for debugging purposes. You can also use the historical data in inference tables to compare model performance on historical requests.
- Monitor deployed AI agents. Inference tables can also store MLflow traces for AI agents helping you debug issues and monitor performance.
Requirements
- AI Gateway-enabled inference tables are only supported for endpoints that use provisioned throughput, serve external models, or serve a deployed AI agent.
- A Databricks workspace in either:
- For workspaces that have private connectivity configured on the Unity Catalog storage account, follow the steps in Configure private connectivity from serverless compute.
- Databricks recommends that you enable predictive optimization for optimized performance of your inference tables.
- Your workspace must have Unity Catalog enabled.
- Both the creator of the endpoint and the modifier must have Can Manage permission on the endpoint. See Access control lists.
- Both the creator of the endpoint and the modifier must have the following permissions in Unity Catalog:
USE CATALOGpermissions on the specified catalog.USE SCHEMApermissions on the specified schema.CREATE TABLEpermissions in the schema.
Warning
The inference table could stop logging data or become corrupted if you do any of the following:
- Change the table schema.
- Change the table name.
- Delete the table.
- Lose permissions to the Unity Catalog catalog or schema.
Enable and disable inference tables
This section shows you how to enable or disable inference tables using the Serving UI. The owner of the inference tables is the user who created the endpoint. All access control lists (ACLs) on the table follow the standard Unity Catalog permissions and can be modified by the table owner.
To enable inference tables during endpoint creation use the following steps:
- Click Serving in the Databricks Mosaic AI UI.
- Click Create serving endpoint.
- In the AI Gateway section, select Enable inference tables.
You can also enable inference tables on an existing endpoint. To edit an existing endpoint configuration do the following:
- In the AI Gateway section, click Edit AI Gateway.
- Select Enable inference tables.
Follow these instructions to disable inference tables:
- Navigate to your endpoint page.
- Click Edit AI Gateway.
- Click Enable inference table to remove the checkmark.
- After you are satisfied with the AI Gateway specifications, click Update.
Enable inference tables for AI agents
You can also enable inference tables for deployed AI agents, these inference tables store payload and request details as well as MLflow Trace logs.
Enable inference tables for AI agents using the following methods:
- Agents deployed using the
mlflow.deploy()API have inference tables automatically enabled. See Deploy an agent for generative AI application. - For programmatic deployments, set the
ENABLE_MLFLOW_TRACINGenvironment variable toTruein the endpoint configuration. See Add plain text environment variables.
To learn more about MLflow agent tracing, see Monitor deployed agents with inference tables.
Query and analyze results in the inference table
After your served models are ready, all requests made to your models are logged automatically to the inference table, along with the responses. You can view the table in the UI, query the table from Databricks SQL or a notebook, or query the table using the REST API.
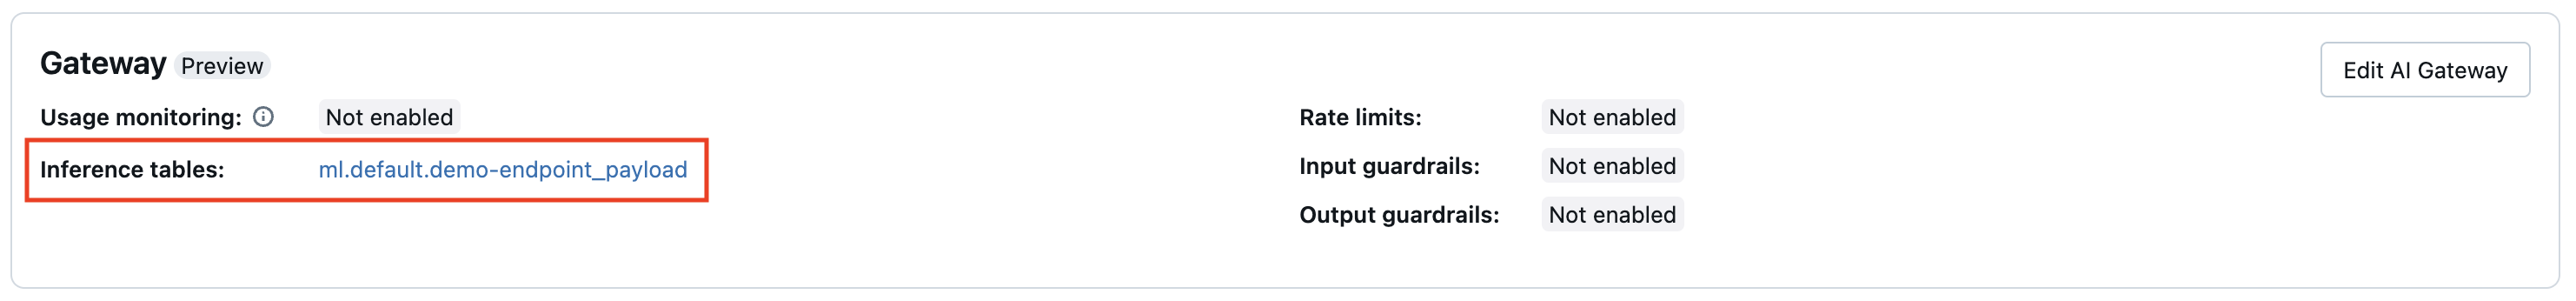
To view the table in the UI: On the endpoint page, click the name of the inference table to open the table in Catalog Explorer.
To query the table from Databricks SQL or a Databricks notebook: You can run code similar to the following to query the inference table.
SELECT * FROM <catalog>.<schema>.<payload_table>
To join your inference table data with details about the underlying foundation model served on your endpoint: Foundation model details are captured in the system.serving.served_entities system table.
SELECT * FROM <catalog>.<schema>.<payload_table> payload
JOIN system.serving.served_entities se on payload.served_entity_id = se.served_entity_id
AI Gateway-enabled inference table schema
Inference tables enabled using AI Gateway have the following schema:
| Column name | Description | Type |
|---|---|---|
request_date |
The UTC date on which the model serving request was received. | DATE |
databricks_request_id |
A Azure Databricks generated request identifier attached to all model serving requests. | STRING |
client_request_id |
The user-provided request identifier that can be specified in the model serving request body. | STRING |
request_time |
The timestamp at which the request is received. | TIMESTAMP |
status_code |
The HTTP status code that was returned from the model. | INT |
sampling_fraction |
The sampling fraction used in the event that the request was down-sampled. This value is between 0 and 1, where 1 represents that 100% of incoming requests were included. | DOUBLE |
execution_duration_ms |
The time in milliseconds for which the model performed inference. This does not include overhead network latencies and only represents the time it took for the model to generate predictions. | BIGINT |
request |
The raw request JSON body that was sent to the model serving endpoint. | STRING |
response |
The raw response JSON body that was returned by the model serving endpoint. | STRING |
served_entity_id |
The unique ID of the served entity. | STRING |
logging_error_codes |
The errors that occurred when the data could not be logged. Error codes include MAX_REQUEST_SIZE_EXCEEDED and MAX_RESPONSE_SIZE_EXCEEDED. |
ARRAY |
requester |
The ID of the user or service principal whose permissions are used for the invocation request of the serving endpoint. | STRING |
AI agent inference table schemas
For AI agents, Databricks creates three inference tables for each deployment to log requests and responses to and from the model serving endpoint:
| Inference table | Example Azure Databricks table name | Table contents |
|---|---|---|
| Payload | {catalog_name}.{schema_name}.{model_name}_payload |
Raw JSON request and response payloads |
| Payload request logs | {catalog_name}.{schema_name}.{model_name}_payload_request_logs |
Formatted request and responses, MLflow traces |
| Payload assessment logs | {catalog_name}.{schema_name}.{model_name}_payload_assessment_logs |
Formatted feedback, as provided in the Review App, for each request |
Users can expect the data in payload tables within one hour of interacting with the serving endpoint. Payload request logs and assessment logs might take longer to populate, and are derived from the raw payload table. You can extract request and assessment logs from the payload table yourself. Deletions and updates to the payload table are not reflected in the payload request logs or the payload assessment logs.
Note
If you have Azure Storage Firewall enabled, reach out to your Databricks account team to enable inference tables for your endpoints.
The following shows the schema for the Payload request logs table:
| Column name | Description | Type |
|---|---|---|
databricks_request_id |
A Azure Databricks generated request identifier attached to all model serving requests. | STRING |
client_request_id |
An optional client generated request identifier that can be specified in the model serving request body. | STRING |
date |
The UTC date on which the model serving request was received. | DATE |
timestamp_ms |
The timestamp in epoch milliseconds on when the model serving request was received. | LONG |
timestamp |
Timestamp of the request. | TIMESTAMP |
status_code |
The HTTP status code that was returned from the model. | INT |
sampling_fraction |
The sampling fraction used in the event that the request was down-sampled. This value is between 0 and 1, where 1 represents that 100% of incoming requests were included. | DOUBLE |
execution_time_ms |
The execution time in milliseconds for which the model performed inference. This does not include overhead network latencies and only represents the time it took for the model to generate predictions. | LONG |
conversation_id |
The conversation id extracted from request logs. | STRING |
request |
The last user query from the user’s conversation. | STRING |
response |
The last response to the user. | STRING |
request_raw |
The string representation of request. | STRING |
response_raw |
String representation of response. | STRING |
trace |
String representation of trace extracted from the databricks_options of response Struct. |
STRING |
request_metadata |
A map of metadata related to the model serving endpoint associated with the request. This map contains the endpoint name, model name, and model version used for your endpoint. | MAP<STRING, STRING> |
schema_version |
The schema version. | STRING |
The following shows the schema for the Payload assessment logs table:
| Column name | Description | Type |
|---|---|---|
request_id |
A Databricks request ID. | STRING |
step_id |
The step ID, derived from retrieval assessment. | STRING |
source |
A struct field containing the information on who created the assessment. | STRUCT |
timestamp |
Timestamp of request. | TIMESTAMP |
text_assessment |
Thee data for any feedback on the agent’s responses from the review app. | STRING |
retrieval_assessment |
The data for any feedback on the documents retrieved for a response. | STRING |
Limitations
- Provisioned throughput workloads:
- If you create a new model serving endpoint that uses provisioned throughput, only AI Gateway-enabled inference tables are supported.
- If you have an existing model serving endpoint that uses provisioned throughput and it never had inference tables previously configured, you can update it to use AI Gateway-enabled inference tables.
- If you have an existing model serving endpoint that uses provisioned throughput and it has inference tables currently or previously configured, you can not update it to use AI Gateway-enabled inference tables.
- For streaming AI agent response logs, only ChatCompletion-compatible fields and traces are aggregated.
- Inference tables log delivery is currently best effort, but you can expect logs to be available within 1 hour of a request. Reach out to your Databricks account team for more information.
- The maximum request and response size that are logged is 1 MiB (1,048,576 bytes). Request and response payloads that exceed this are logged as
nullandlogging_error_codesare populated withMAX_REQUEST_SIZE_EXCEEDEDorMAX_RESPONSE_SIZE_EXCEEDED.
For limitations specific to AI Gateway, see Limitations. For general model serving endpoint limitations, see Model Serving limits and regions.