Check the health of an Azure Data Explorer cluster
There are several factors that impact the health of an Azure Data Explorer cluster, including CPU, memory, and the disk subsystem. This article shows some basic steps you can take to gauge the health of a cluster.
Sign in to https://dataexplorer.azure.com.
In the left pane, select your cluster, and run the following command.
.show diagnostics
| project IsHealthy, NotHealthyReason, IsAttentionRequired, AttentionRequiredReason, IsScaleOutRequired
Output
Output parameter Description IsHealthy An output of 1 indicates that the cluster is healthy. An output of 0 indicates that the cluster is unhealthy. NotHealthyReason The reason that the cluster is unhealthy. This field is only relevant when the output of IsHealthy is 0. IsAttentionRequired An output of 1 indicates that the cluster requires attention. AttentionRequiredReason The reason that the cluster requires attention. This field is only relevant when the output of IsAttentionRequired is 1. IsScaleOutRequired An output of 1 indicates it is recommended to scale out the cluster. Sign into the Azure portal, and navigate to your cluster.
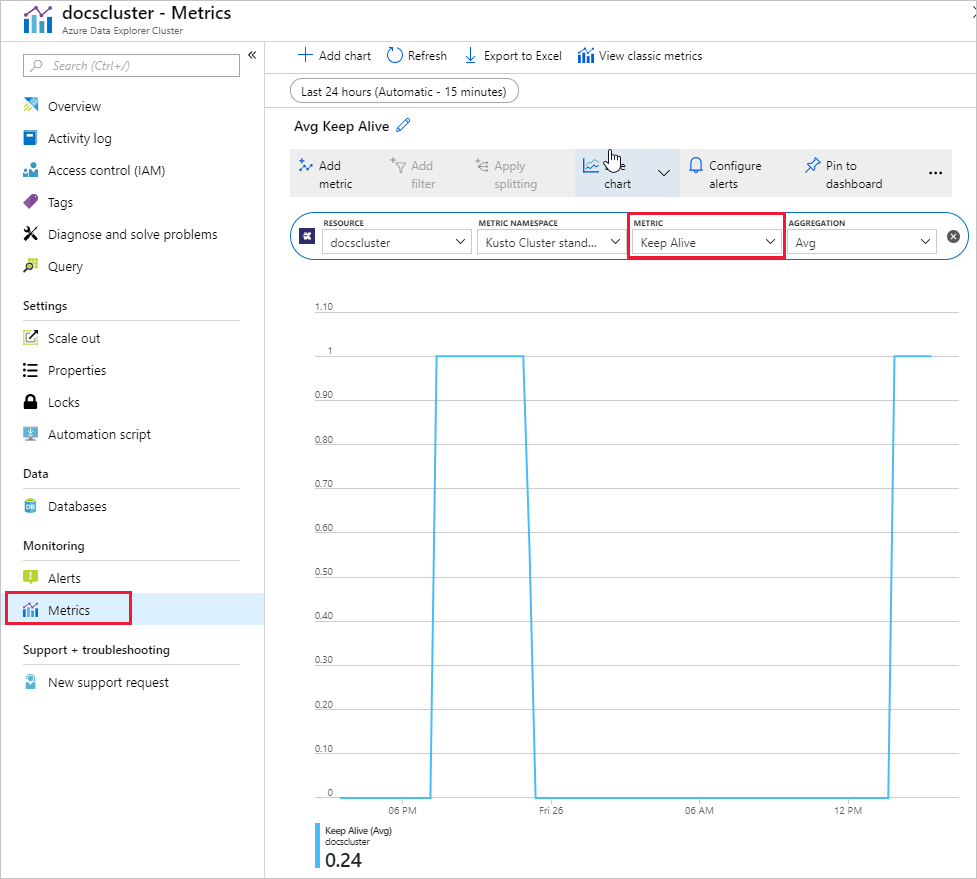
Under Monitoring, select Metrics, then select Keep Alive, as shown in the following image. An output close to 1 means a healthy cluster.

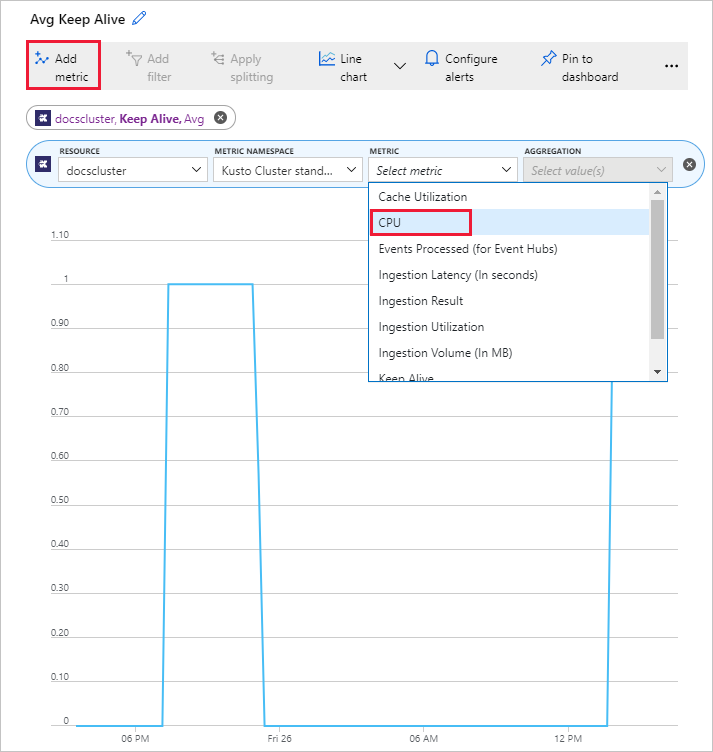
It's possible to add other metrics to the chart. Select the chart then Add metric. Select another metric - this example shows CPU.

Review the resource and ingestion metrics listed in cluster metrics and review the recommendations in the metric description column.
If you need assistance diagnosing issues with the health of a cluster, please open a support request in the Azure portal.