View out-of-box reports for Azure Backup
This article describes how to view reports for all backup operations.
Out-of-box reports
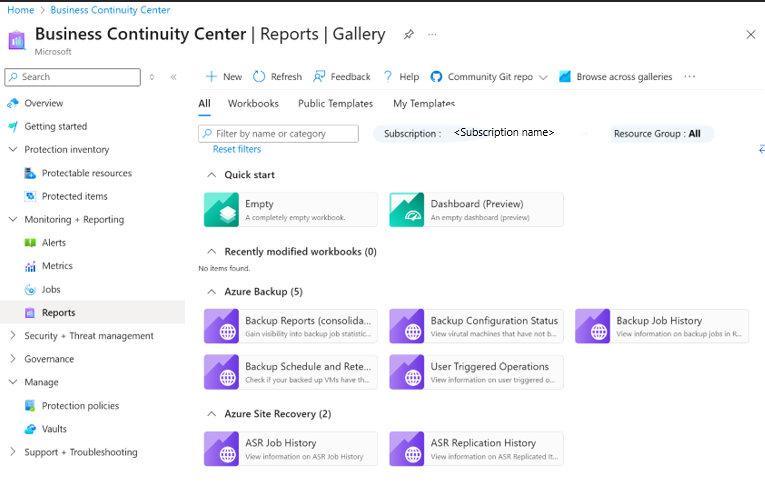
Out-of-box reports are targeted reports available in Business Continuity Center to help you audit requirements primarily. These reports are simplified and fully customizable right from the columns to the filters and the data format. These out of box reports are curated for Backup Configuration Status, Backup Job History, Backup Schedule and Retention and User Triggered Operations.
View reports in the Azure portal
After you've configured your vaults to send data to Log Analytics, view your Backup reports.
To view the reports, follow these steps:
- Go to Business Continuity Center > Reports.
- Select Backup Reports.
- Select the relevant workspace(s) on the Get started tab.
The following sections detail the tabs available for report.
Summary
Use this tab to get a high-level overview of your backup estate. You can get a quick glance of the total number of backup items, total cloud storage consumed, the number of protected instances, and the job success rate per workload type. For more detailed information about a specific backup artifact type, go to the respective tabs.
Backup Items
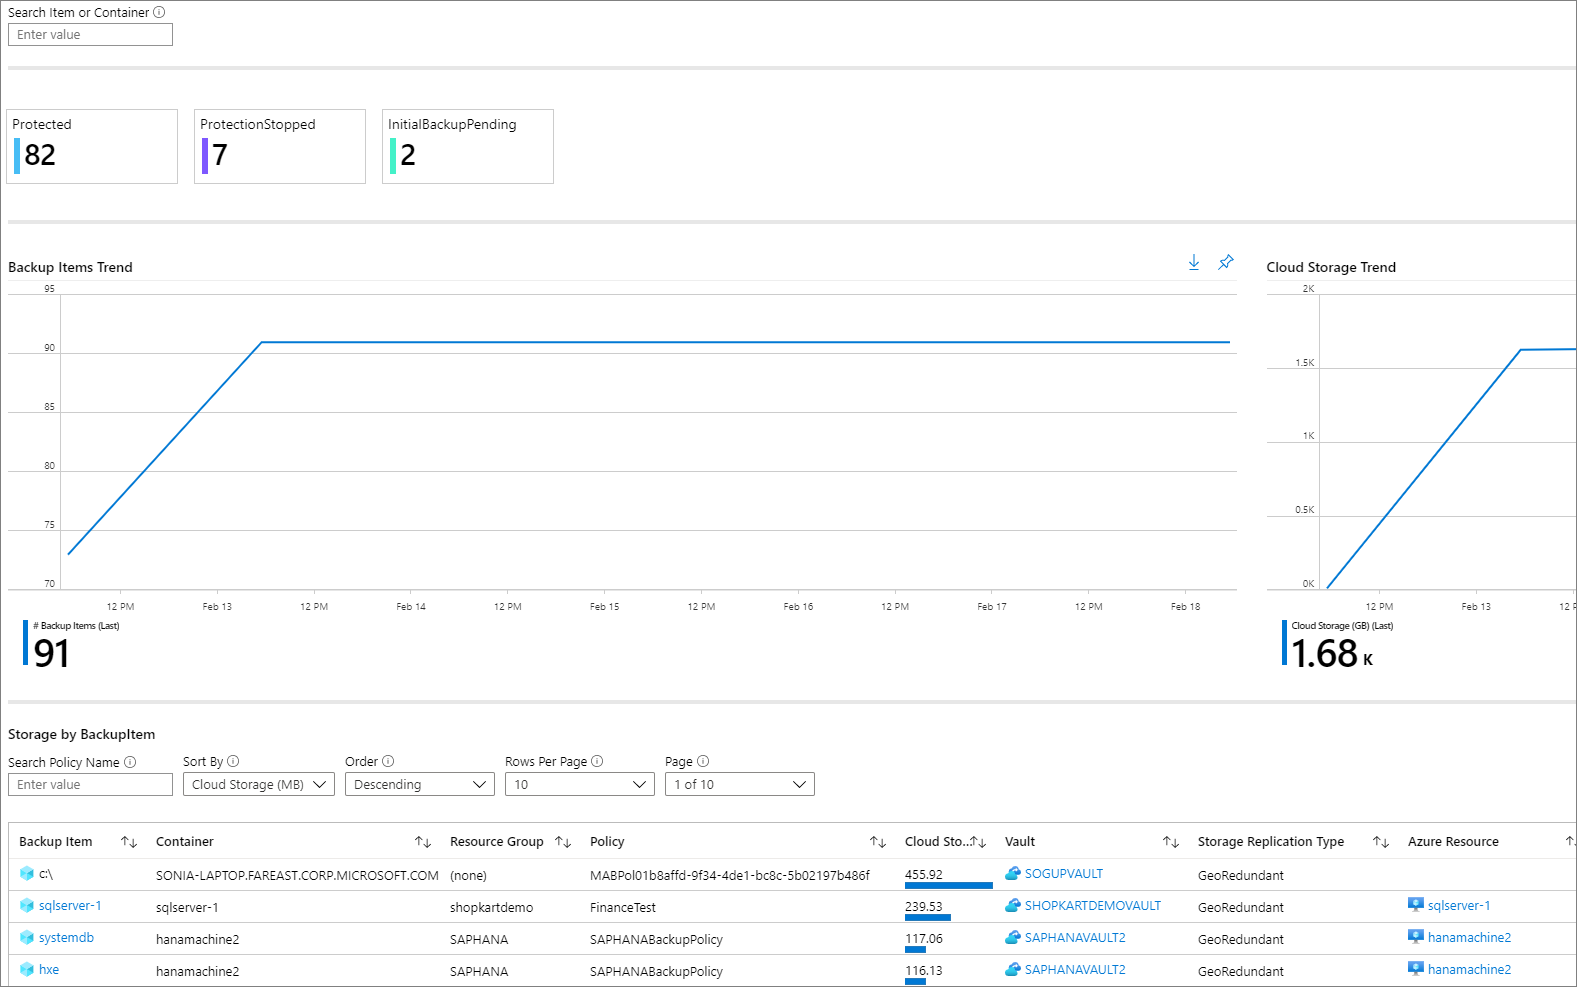
Use this tab to see information and trends on cloud storage consumed at a Backup-item level. For example, if you use SQL in an Azure VM backup, you can see the cloud storage consumed for each SQL database that's being backed up. You can also choose to see data for backup items of a particular protection status. For example, selecting the Protection Stopped tile at the top of the tab filters all the widgets underneath to show data only for Backup items in the Protection Stopped state.
Usage
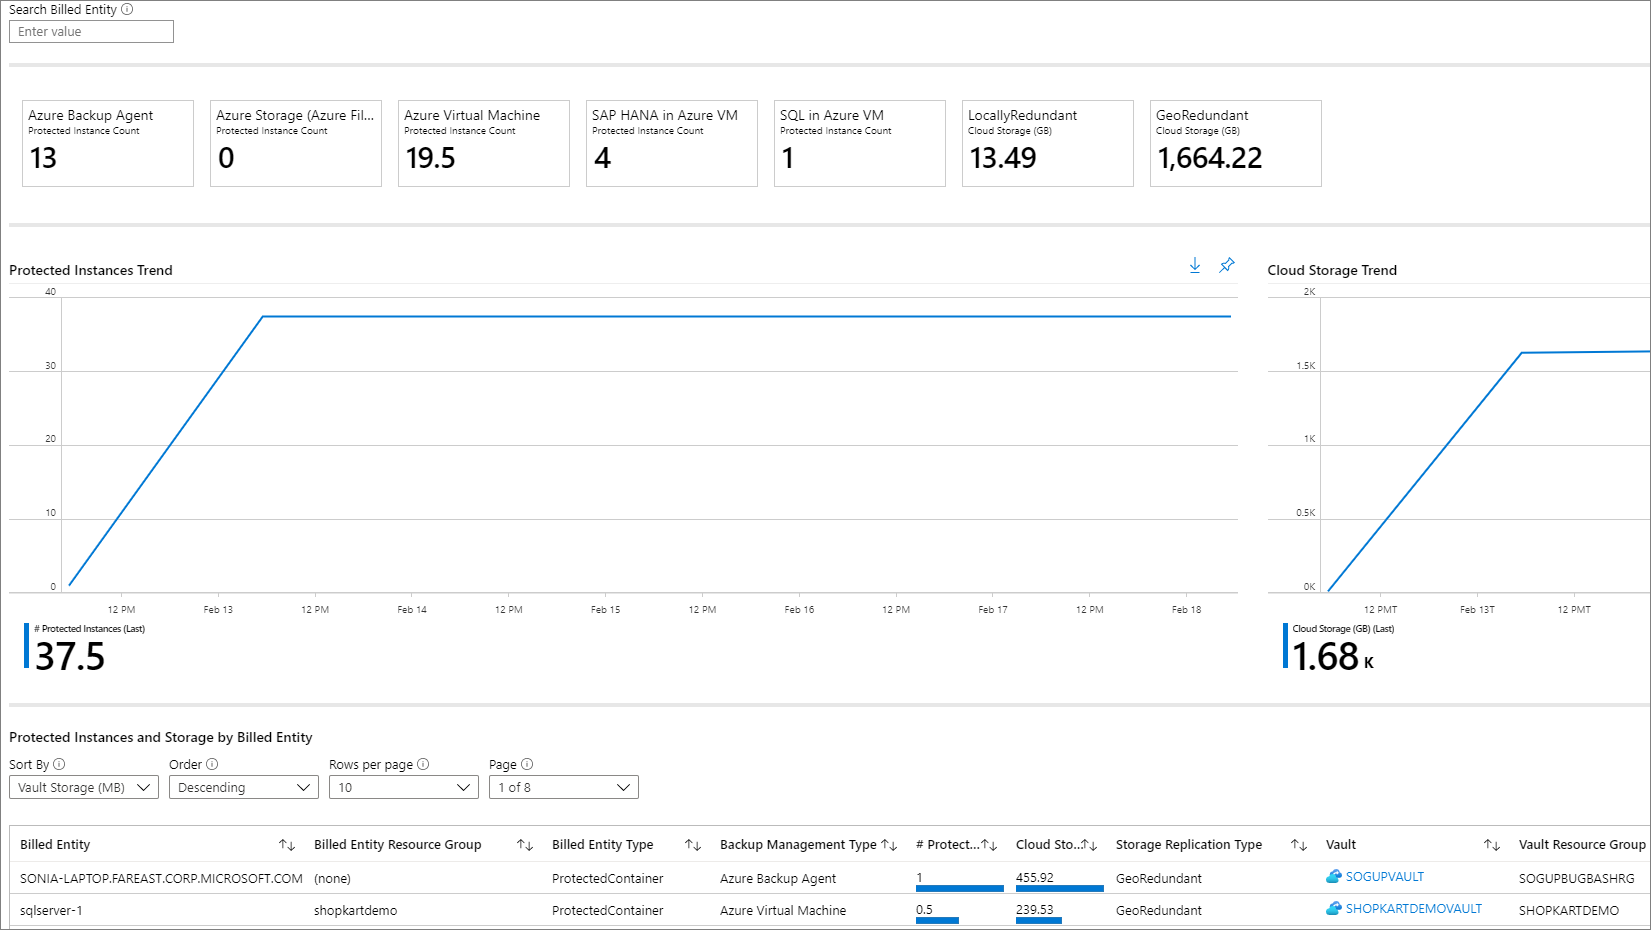
Use this tab to view key billing parameters for your backups. The information shown on this tab is at a billing entity (protected container) level. For example, if a DPM server is being backed up to Azure, you can view the trend of protected instances and cloud storage consumed for the DPM server. Similarly, if you use SQL in Azure Backup or SAP HANA in Azure Backup, this tab gives you usage-related information at the level of the virtual machine in which these databases are contained.
Note
- For Azure File, Azure Blob and Azure Disk workloads, storage consumed shows as zero. This is because field refers to the storage consumed in the vault, and for Azure File, Azure Blob, and Azure Disk; only the snapshot-based backup solution is currently supported in the reports.
- For DPM workloads, users might see a slight difference (of the order of 20 MB per DPM server) between the usage values shown in the reports as compared to the aggregate usage value as shown on the Recovery Services vault Overview tab. This difference is accounted for by the fact that every DPM server being registered for backup has an associated 'metadata' datasource, which isn't surfaced as an artifact for reporting.
Jobs
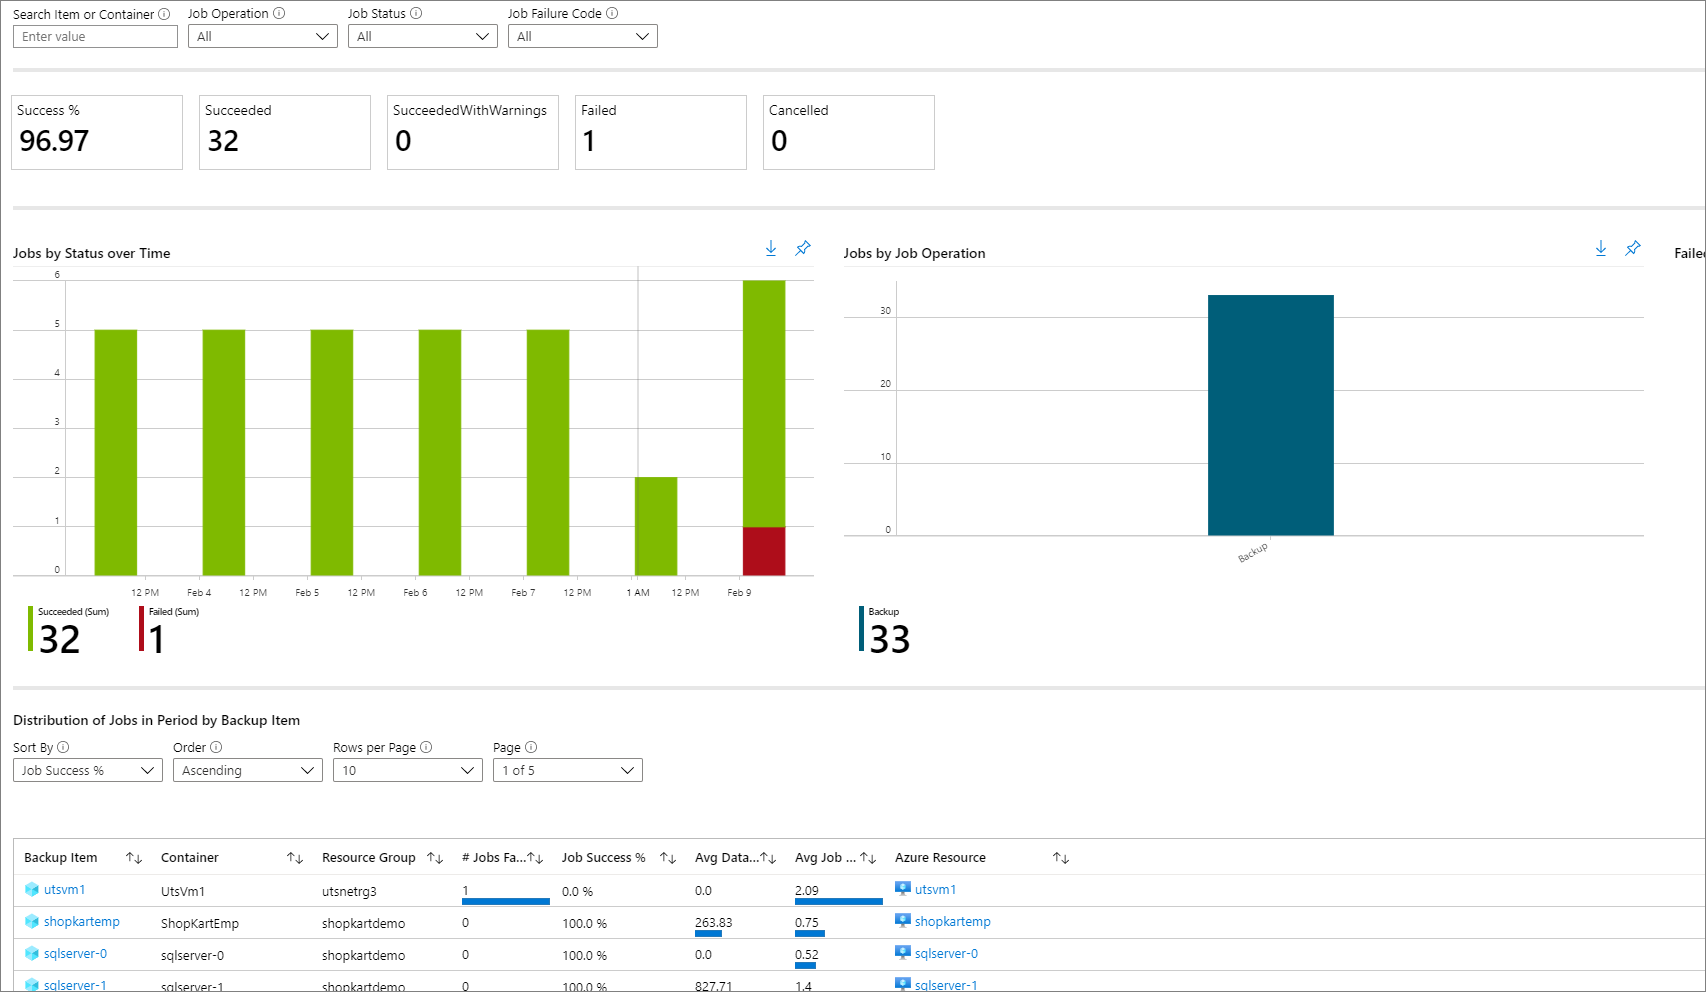
Use this tab to view long-running trends on jobs, such as the number of failed jobs per day and the top causes of job failure. You can view this information at both an aggregate level and at a Backup-item level. Select a particular Backup item in a grid to view detailed information on each job that was triggered on that Backup item in the selected time range.
Note
For Azure Database for PostgreSQL, Azure Blob, and Azure Disk workloads, data transferred field is currently not available in the Jobs table.
Policies
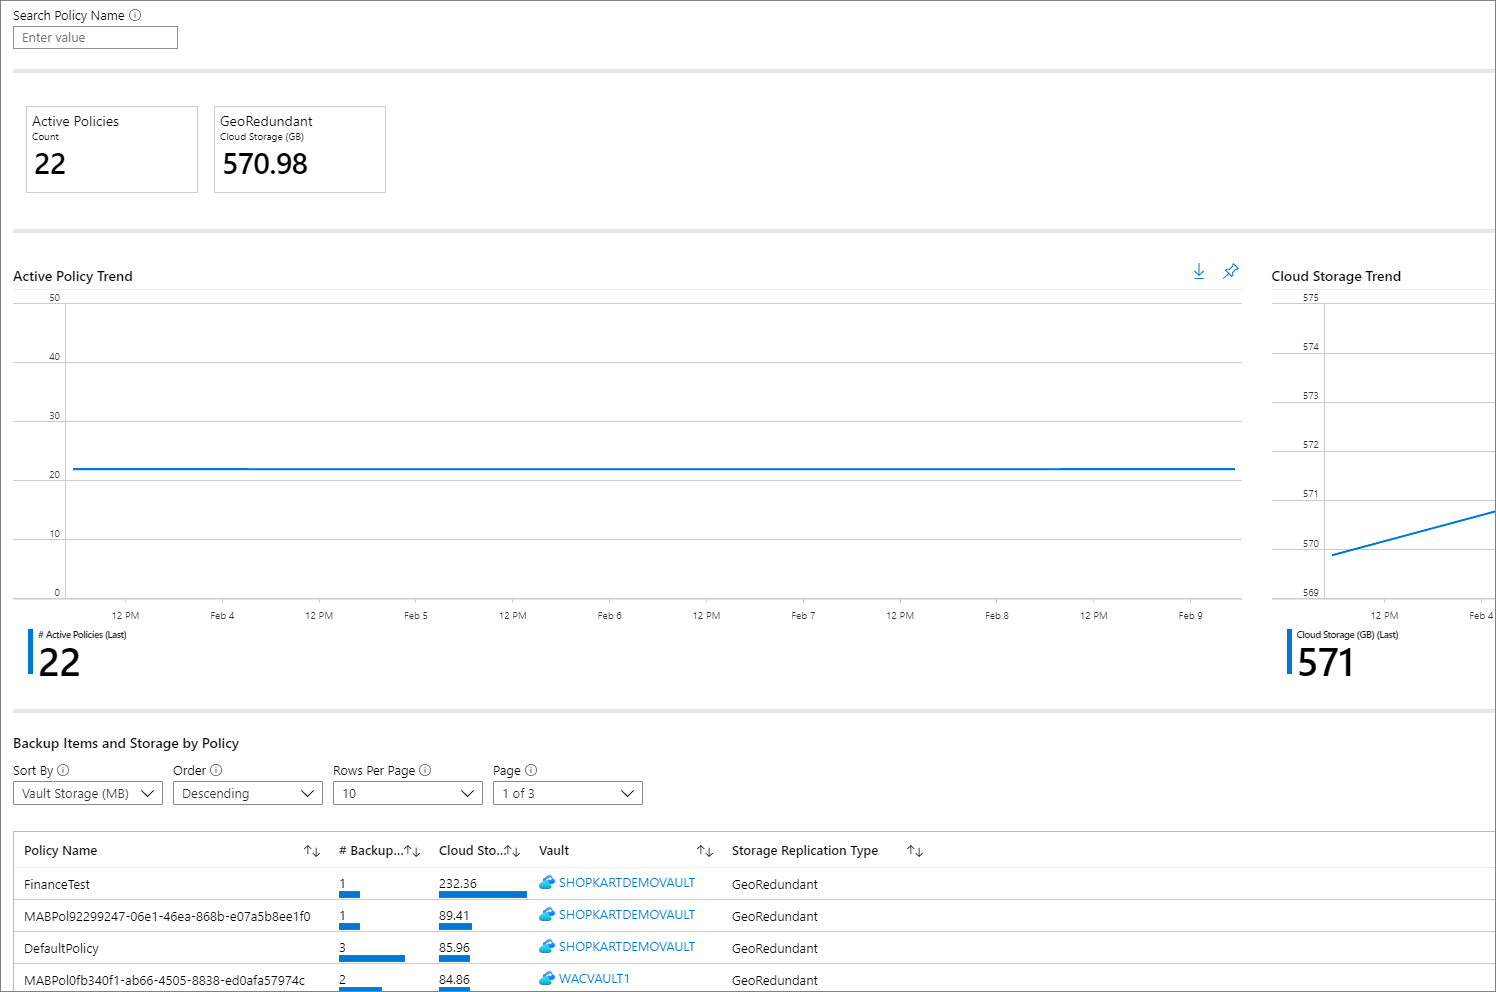
Use this tab to view information on all of your active policies, such as the number of associated items and the total cloud storage consumed by items backed up under a given policy. Select a particular policy to view information on each of its associated Backup items.
Optimize
Use this tab to gain visibility into potential cost-optimization opportunities for your backups. The Optimize tab currently provides insights for the following scenarios:
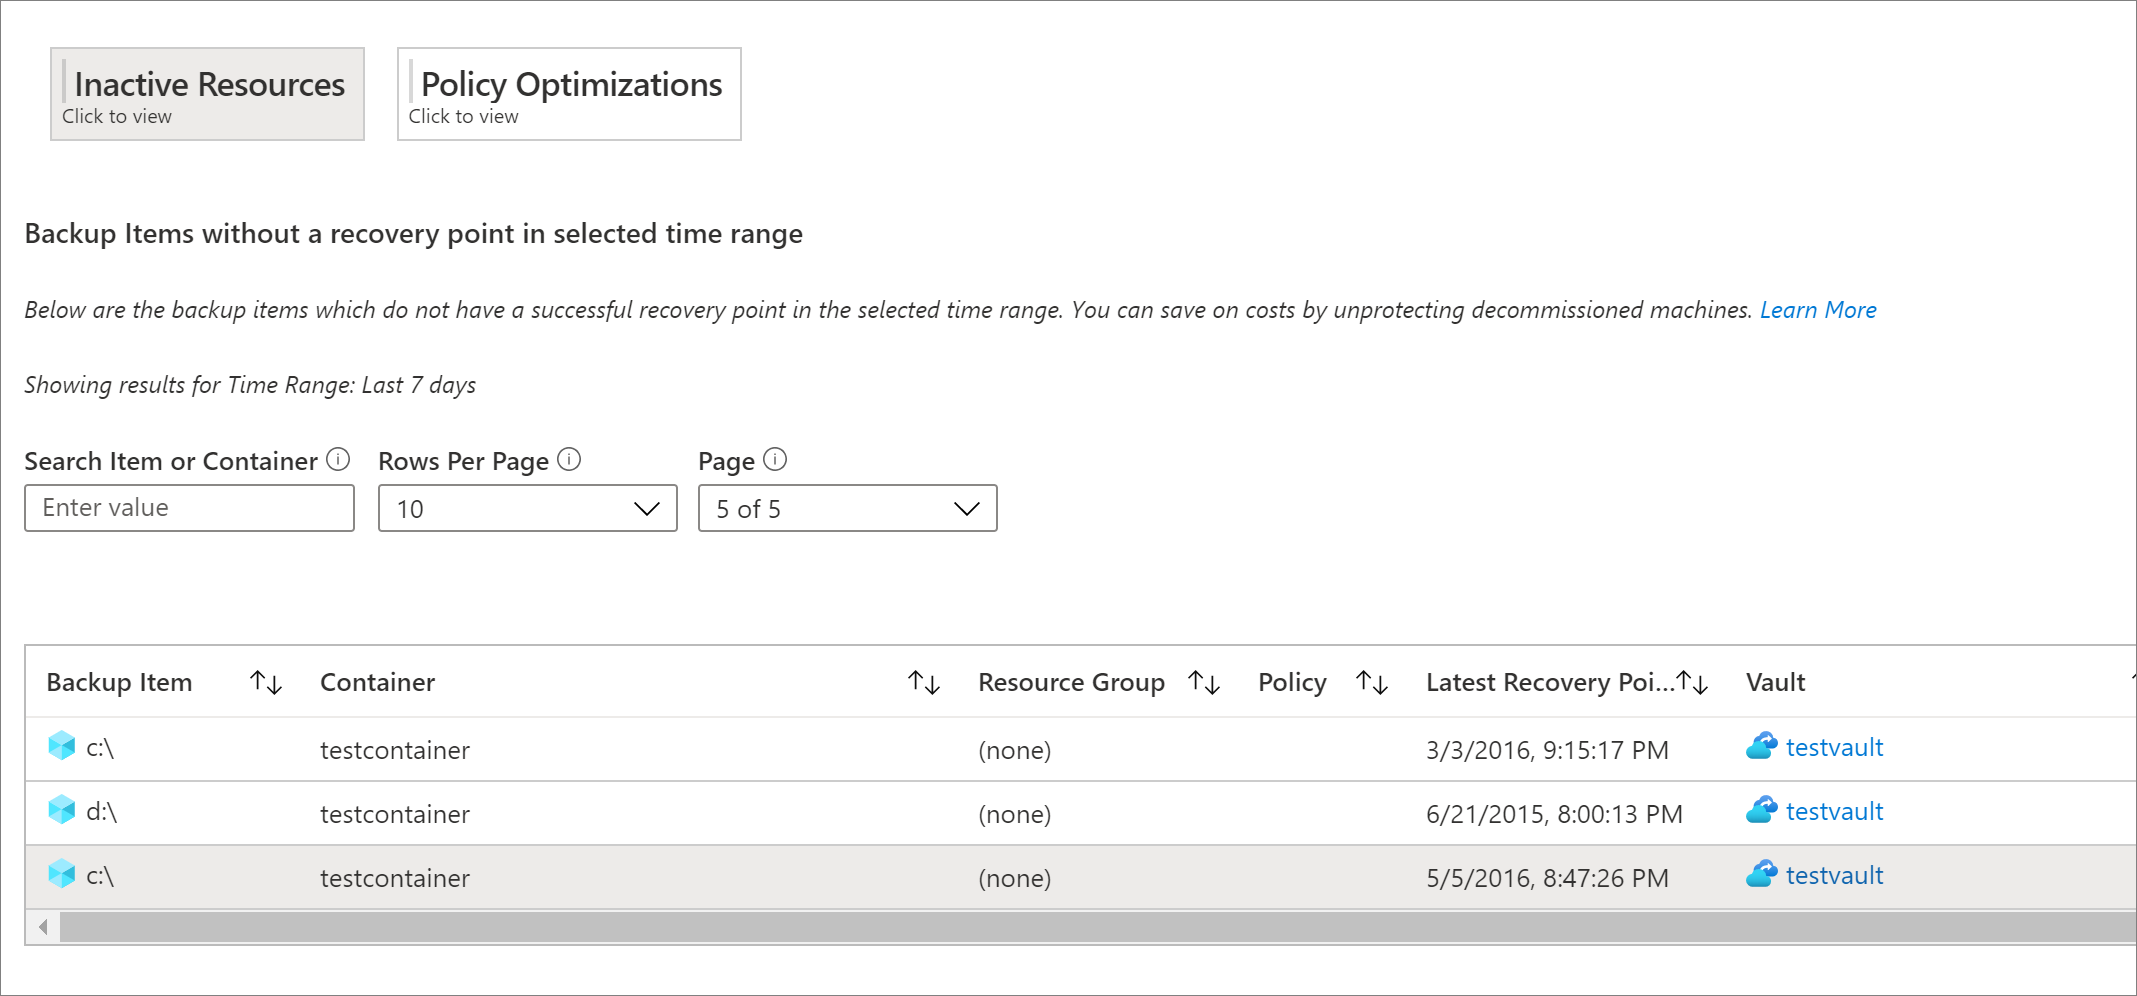
Inactive resources: Using this view, you can identify those backup items that haven't had a successful backup for a significant duration of time. This could either mean that the underlying machine that's being backed up doesn't exist anymore (and so is resulting in failed backups), or there's some issue with the machine that's preventing backups from being taken reliably.
To view inactive resources, go to the Optimize tab, and select the Inactive Resources tile. Select this tile displays a grid that contains details of all the inactive resources that exist in the selected scope. By default, the grid shows items that don't have a recovery point in the last seven days. To find inactive resources for a different time range, you can adjust the Time Range filter at the top of the tab.
Once you've identified an inactive resource, you can investigate the issue further by navigating to the backup item dashboard or the Azure resource pane for that resource (wherever applicable). Depending on your scenario, you can choose to either stop backup for the machine (if it doesn't exist anymore) and delete unnecessary backups, which save costs, or you can fix issues in the machine to ensure that backups are taken reliably.
Note
For Azure Database for PostgreSQL, Azure Blob, and Azure Disk workloads, Inactive Resources view is currently not supported.
Backup Items with a large retention duration: Using this view, you can identify those items that have backups retained for a longer duration than required by your organization.
Selecting the Policy Optimizations tile followed by the Retention Optimizations tile displays a grid containing all backup items for which the retention of either the daily, weekly, monthly, or yearly retention point (RP) is greater than a specified value. By default, the grid displays all backup items in the selected scope. You can use the filters for daily, weekly, monthly, and yearly RP retention to filter the grid further and identify those items for which retention could potentially be reduced to save on backup storage costs.
For database workloads like SQL and SAP HANA, the retention periods shown in the grid correspond to the retention periods of the full backup points and not the differential backup points. The same applies for the retention filters as well.
Note
For backup instances that are using the vault-standard tier, the Retention Optimizations grid takes into consideration the retention duration in the vault-standard tier. For backup instances that aren't using the vault tier (for example, items protected by Azure Disk Backup solution), the grid takes into consideration the snapshot tier retention.
Databases configured for daily full backup: Using this view, you can identify database workloads that have been configured for daily full backup. Often, using daily differential backup along with weekly full backup is more cost-effective.
Selecting the Policy Optimizations tile followed by the Backup Schedule Optimizations tile displays a grid containing all databases with a daily full backup policy. You can choose to navigate to a particular backup item and modify the policy to use daily differential backup with weekly full backup.
The Backup Management Type filter at the top of the tab should have the items SQL in Azure VM and SAP HANA in Azure VM selected, for the grid to be able to display database workloads as expected.
Policy adherence: Using this tab, you can identify whether all of your backup instances have had at least one successful backup every day. For items with weekly backup policy, you can use this tab to determine whether all backup instances have had at least one successful backup a week.
There are two types of policy adherence views available:
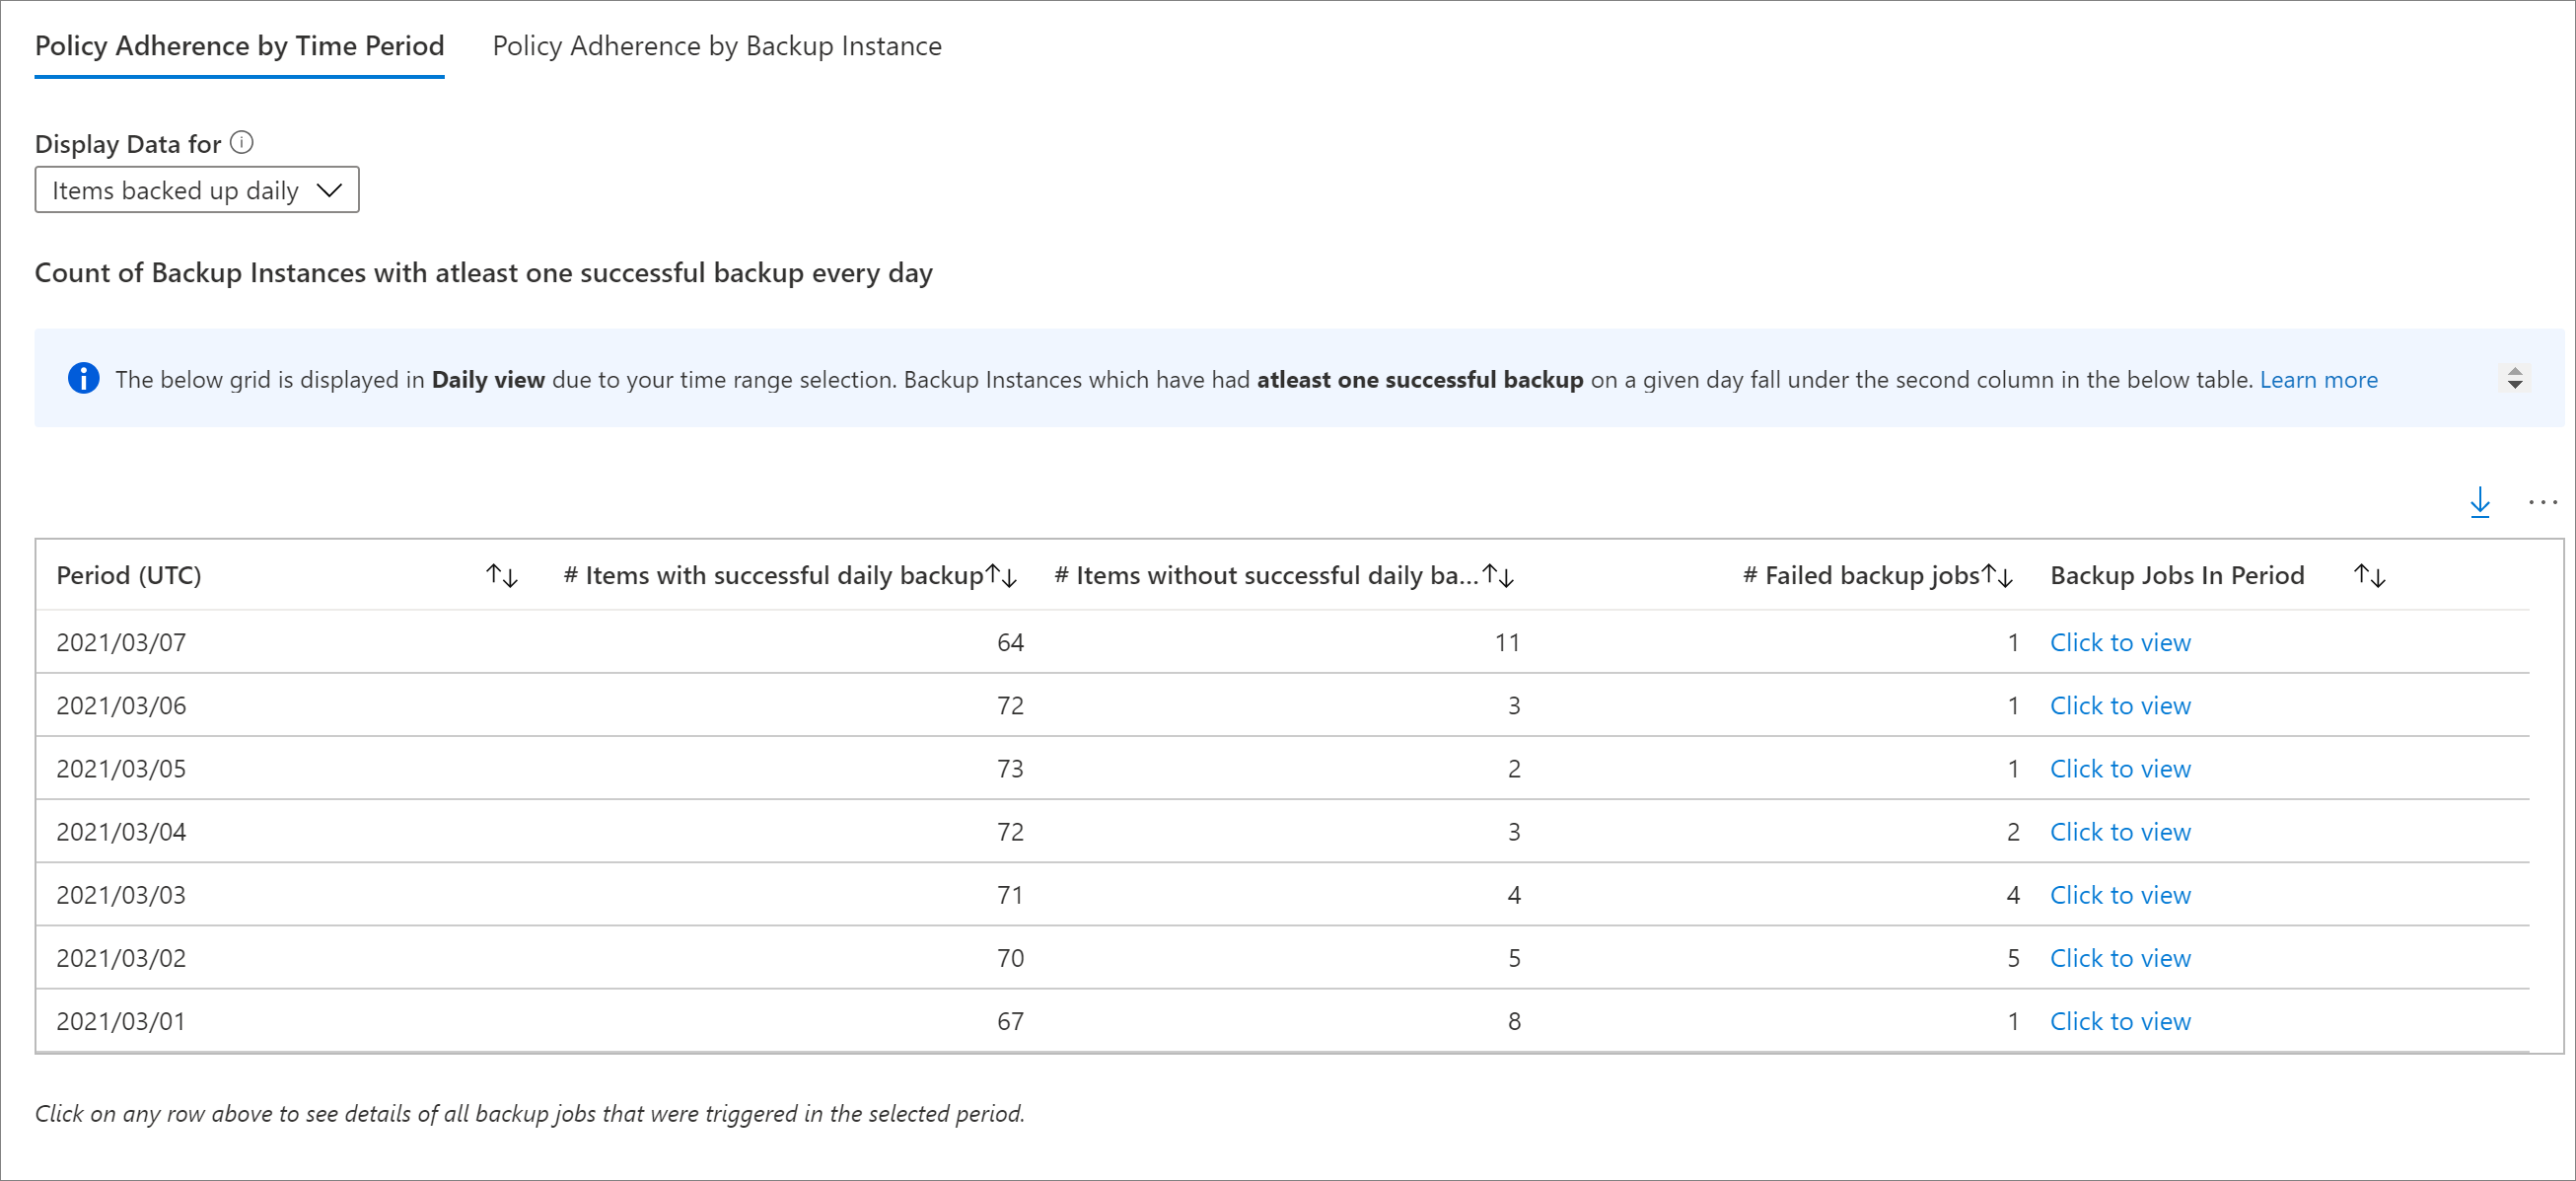
Policy Adherence by Time Period: Using this view, you can identify how many items have had at least one successful backup in a given day and how many have not had a successful backup in that day. You can click on a row to see details of all backup jobs that have been triggered on the selected day. Note that if you increase the time range to a larger value, such as the last 60 days, the grid is rendered in weekly view, and displays the count of all items that have had at least one successful backup on every day in the given week. Similarly, there is a monthly view for larger time ranges.
For the items backed up weekly, this grid helps you identify all items that have had at least one successful backup in the given week. For a larger time range, such as the last 120 days, the grid is rendered in monthly view, and displays the count of all items that have had at least one successful backup in every week in the given month. Refer Conventions used in Backup Reports for more details around daily, weekly and monthly views.
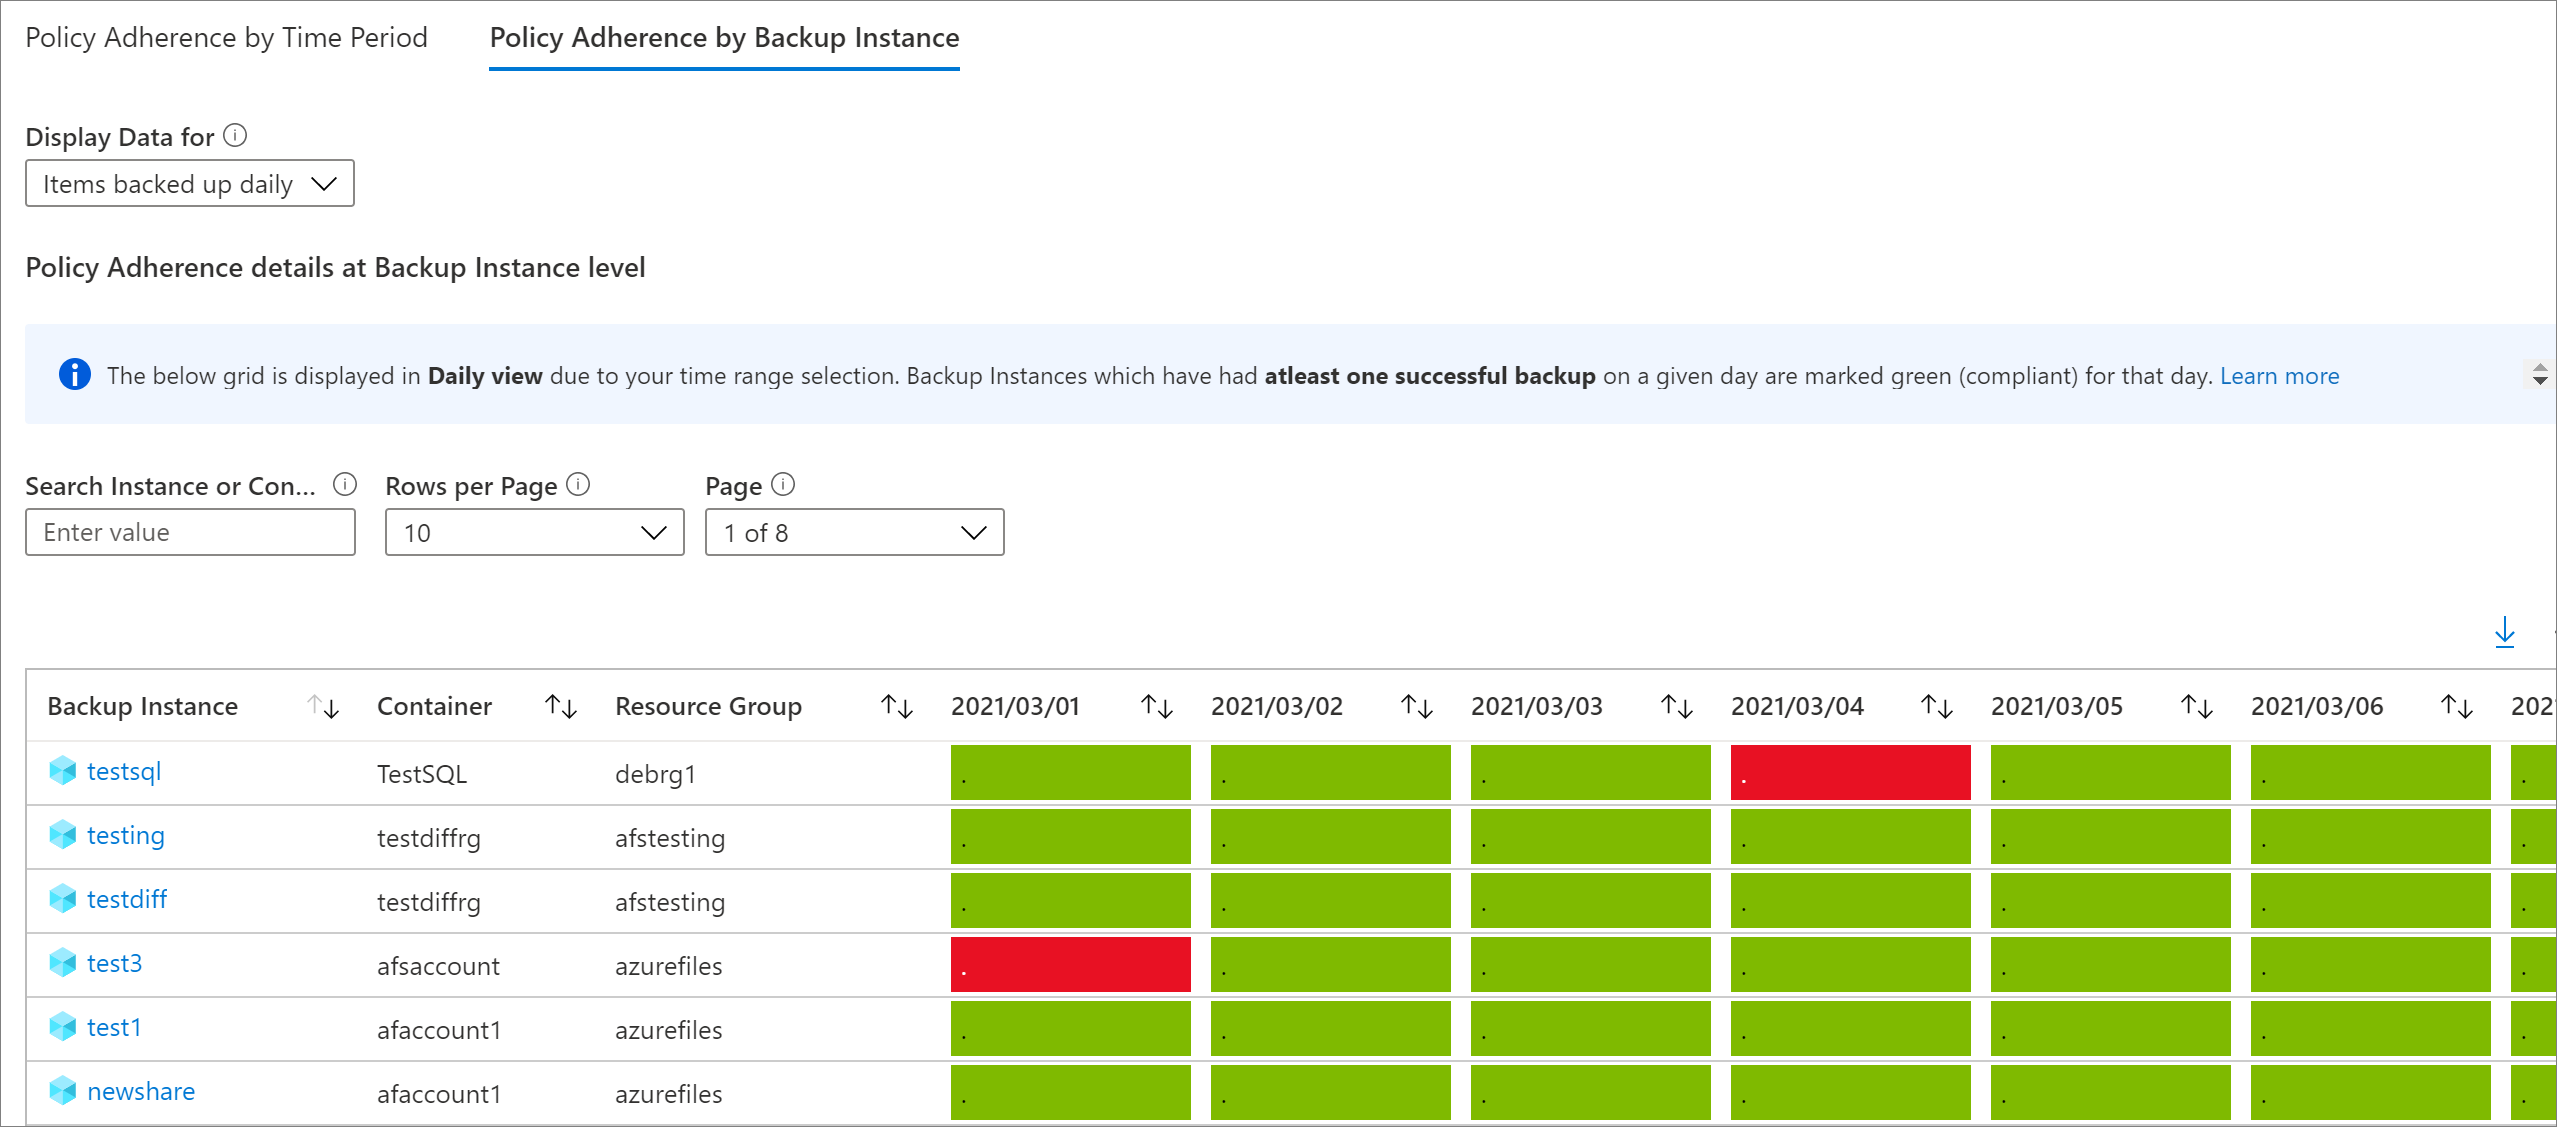
Policy Adherence by Backup Instance: Using this view, you can view policy adherence details at a backup instance level. A cell which is green denotes that the backup instance had at least one successful backup on the given day. A cell which is red denotes that the backup instance did not have even one successful backup on the given day. Daily, weekly and monthly aggregations follow the same behavior as the Policy Adherence by Time Period view. You can click on any row to view all backup jobs on the given backup instance in the selected time range.
Email Azure Backup reports: Using the Email Report feature available in Backup Reports, you can create automated tasks to receive periodic reports via email. This feature works by deploying a logic app in your Azure environment that queries data from your selected Log Analytics (LA) workspaces, based on the inputs that you provide.
Once the logic app is created, you'll need to authorize connections to Azure Monitor Logs and Office 365. To do this, go to Logic Apps in the Azure portal and search for the name of the task you've created. Selecting the API connections menu item opens up the list of API connections that you need to authorize. Learn how to configure emails and troubleshoot issues.
Other reporting capabilities
This section lists the other available reports.
Customize Azure Backup reports
Backup Reports uses system functions on Azure Monitor logs. These functions operate on data in the raw Azure Backup tables, in the Log Analytics, and return formatted data that helps you retrieve information of all your backup-related entities using simple queries.
To create your own reporting workbooks using Backup Reports as a base, you can go to Backup Reports, click Edit at the top of the report, and view/edit the queries being used in the reports. Refer to Azure workbooks documentation to learn more about how to create custom reports.
Export to Excel
Select the down arrow button in the upper right of any widget, like a table or chart, to export the contents of that widget as an Excel sheet as-is with existing filters applied. To export more rows of a table to Excel, you can increase the number of rows displayed on the page by using the Rows Per Page drop-down arrow at the top of each grid.
Pin to dashboard
Select the pin button at the top of each widget to pin the widget to your Azure portal dashboard. This feature helps you create customized dashboards tailored to display the most important information that you need.
Cross-tenant reports
If you use Azure Lighthouse with delegated access to subscriptions across multiple tenant environments, you can use the default subscription filter. Select the filter button in the upper-right corner of the Azure portal to choose all the subscriptions for which you want to see data. Doing so lets you select Log Analytics workspaces across your tenants to view multi-tenanted reports.
