Evaluate AKS cluster health
This article is part of a series. Start with the overview.
To begin your triage practice, evaluate the overall health of the cluster and networking.
Tools
There are many tools and features that you can use to diagnose and solve problems in your Azure Kubernetes Service (AKS) cluster.
In the Azure portal, select your AKS cluster resource. These tools and features are in the navigation pane.
Diagnose and solve problems: You can use this tool to help identify and resolve issues within your cluster.
Resource health: You can use this tool to help diagnose and obtain support for service problems that might affect your Azure resources. This tool provides information about your resources' current and past health status.
Advisor recommendations: Azure Advisor acts as a personalized cloud consultant, guiding you to follow best practices for optimizing your Azure deployments. You can use Advisor to analyze your resource configuration and usage telemetry. Advisor suggests solutions so you can enhance cost-effectiveness, performance, reliability, and security.
Logs: Use this feature to access the cluster logs and metrics that are stored in the Log Analytics workspace. You can monitor and analyze your cluster's logs and metrics to provide insight and improve troubleshooting.
Use these tools and features so you can effectively diagnose and resolve issues, optimize your AKS cluster deployment, and monitor the health and performance of your Azure resources.
Diagnose and solve problems
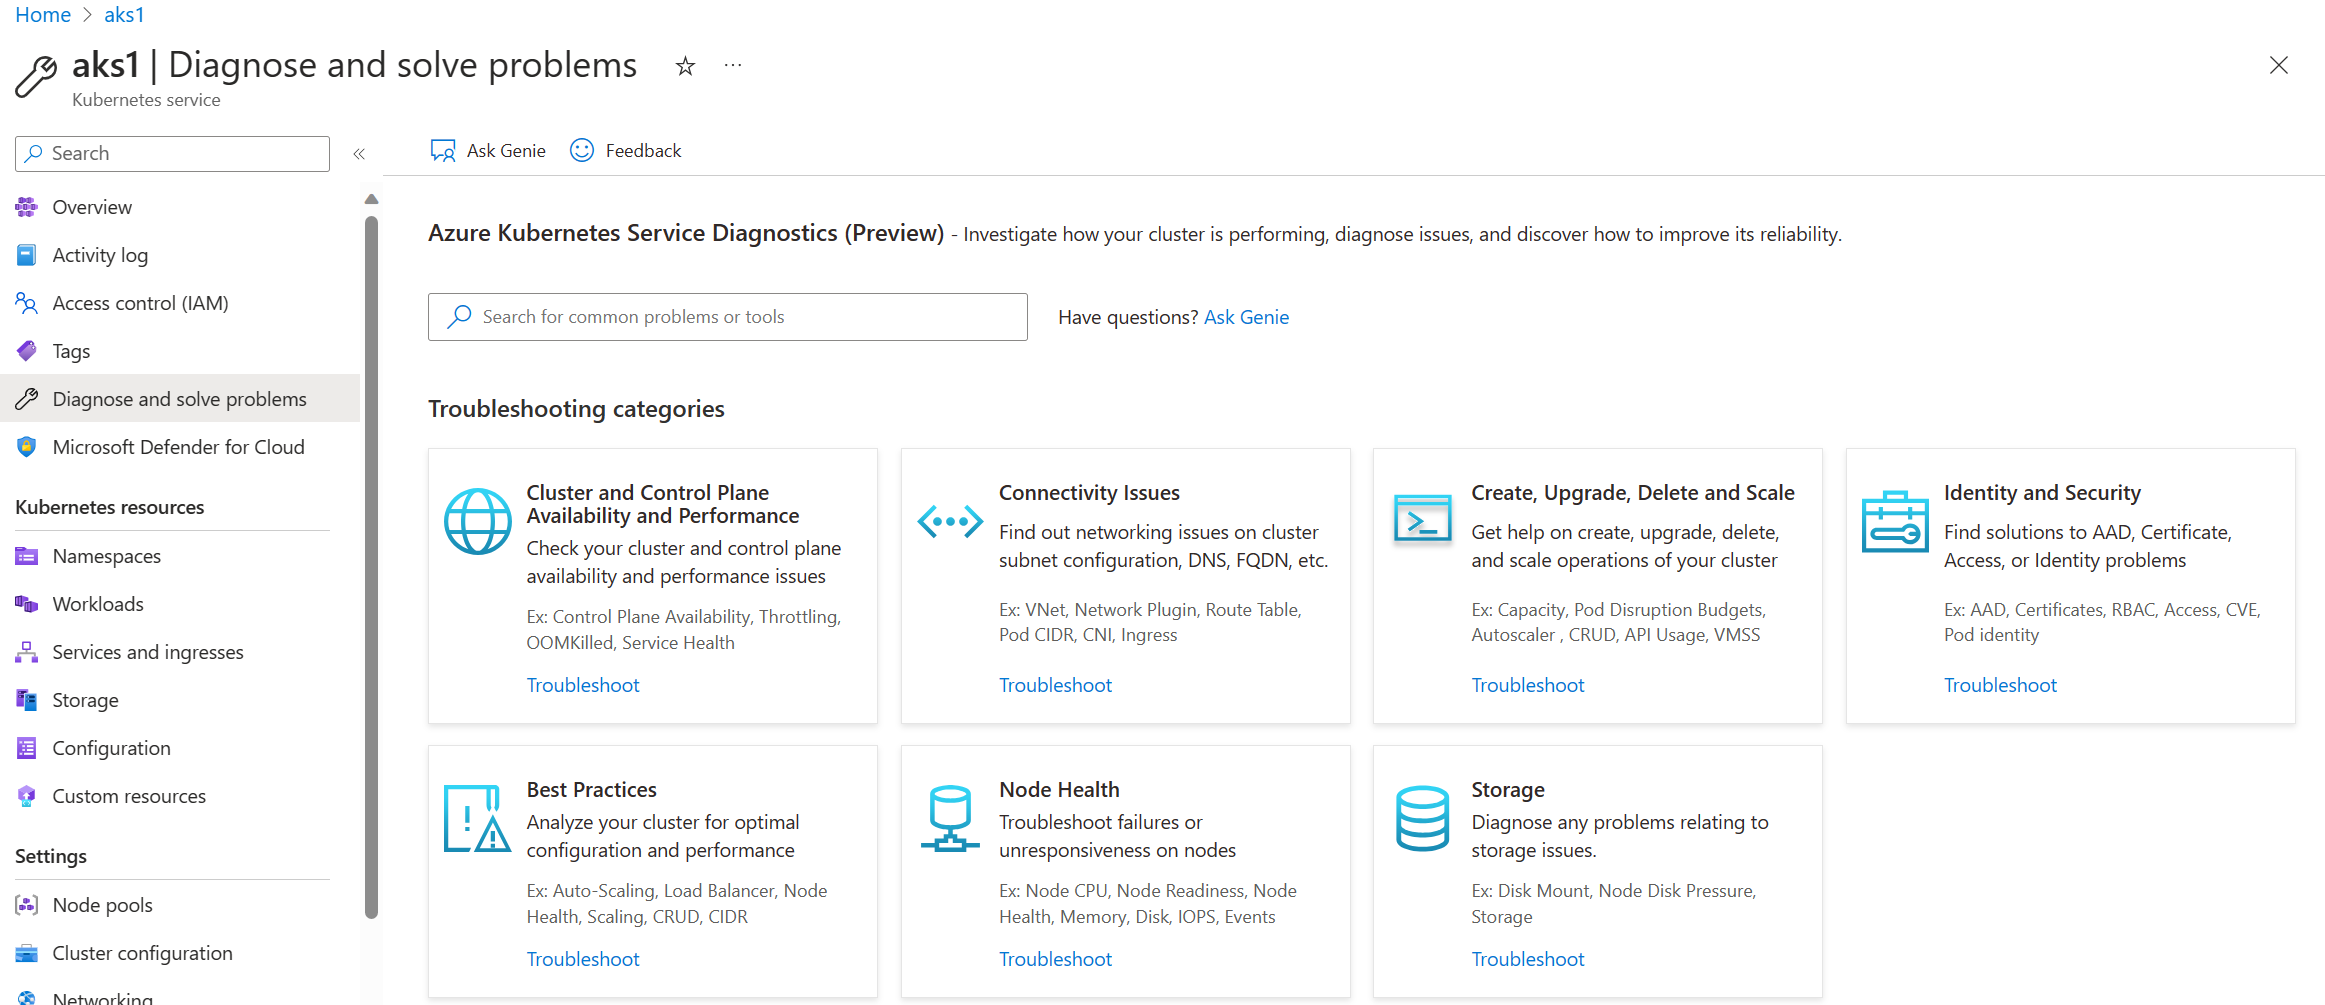
The diagnose and solve problems feature provides a comprehensive suite of tools to aid in the identification and resolution of various issues related to your cluster. Select the troubleshooting category that's the most relevant to your problem.
To check the cluster health, you might choose:
- Cluster and control plane availability and performance: Check if there are any service availability or throttling issues affecting the health of the cluster.
- Connectivity issues: Check if there are errors with cluster Domain Name System (DNS) resolution or if the outbound communication route has connectivity issues.
Resource health
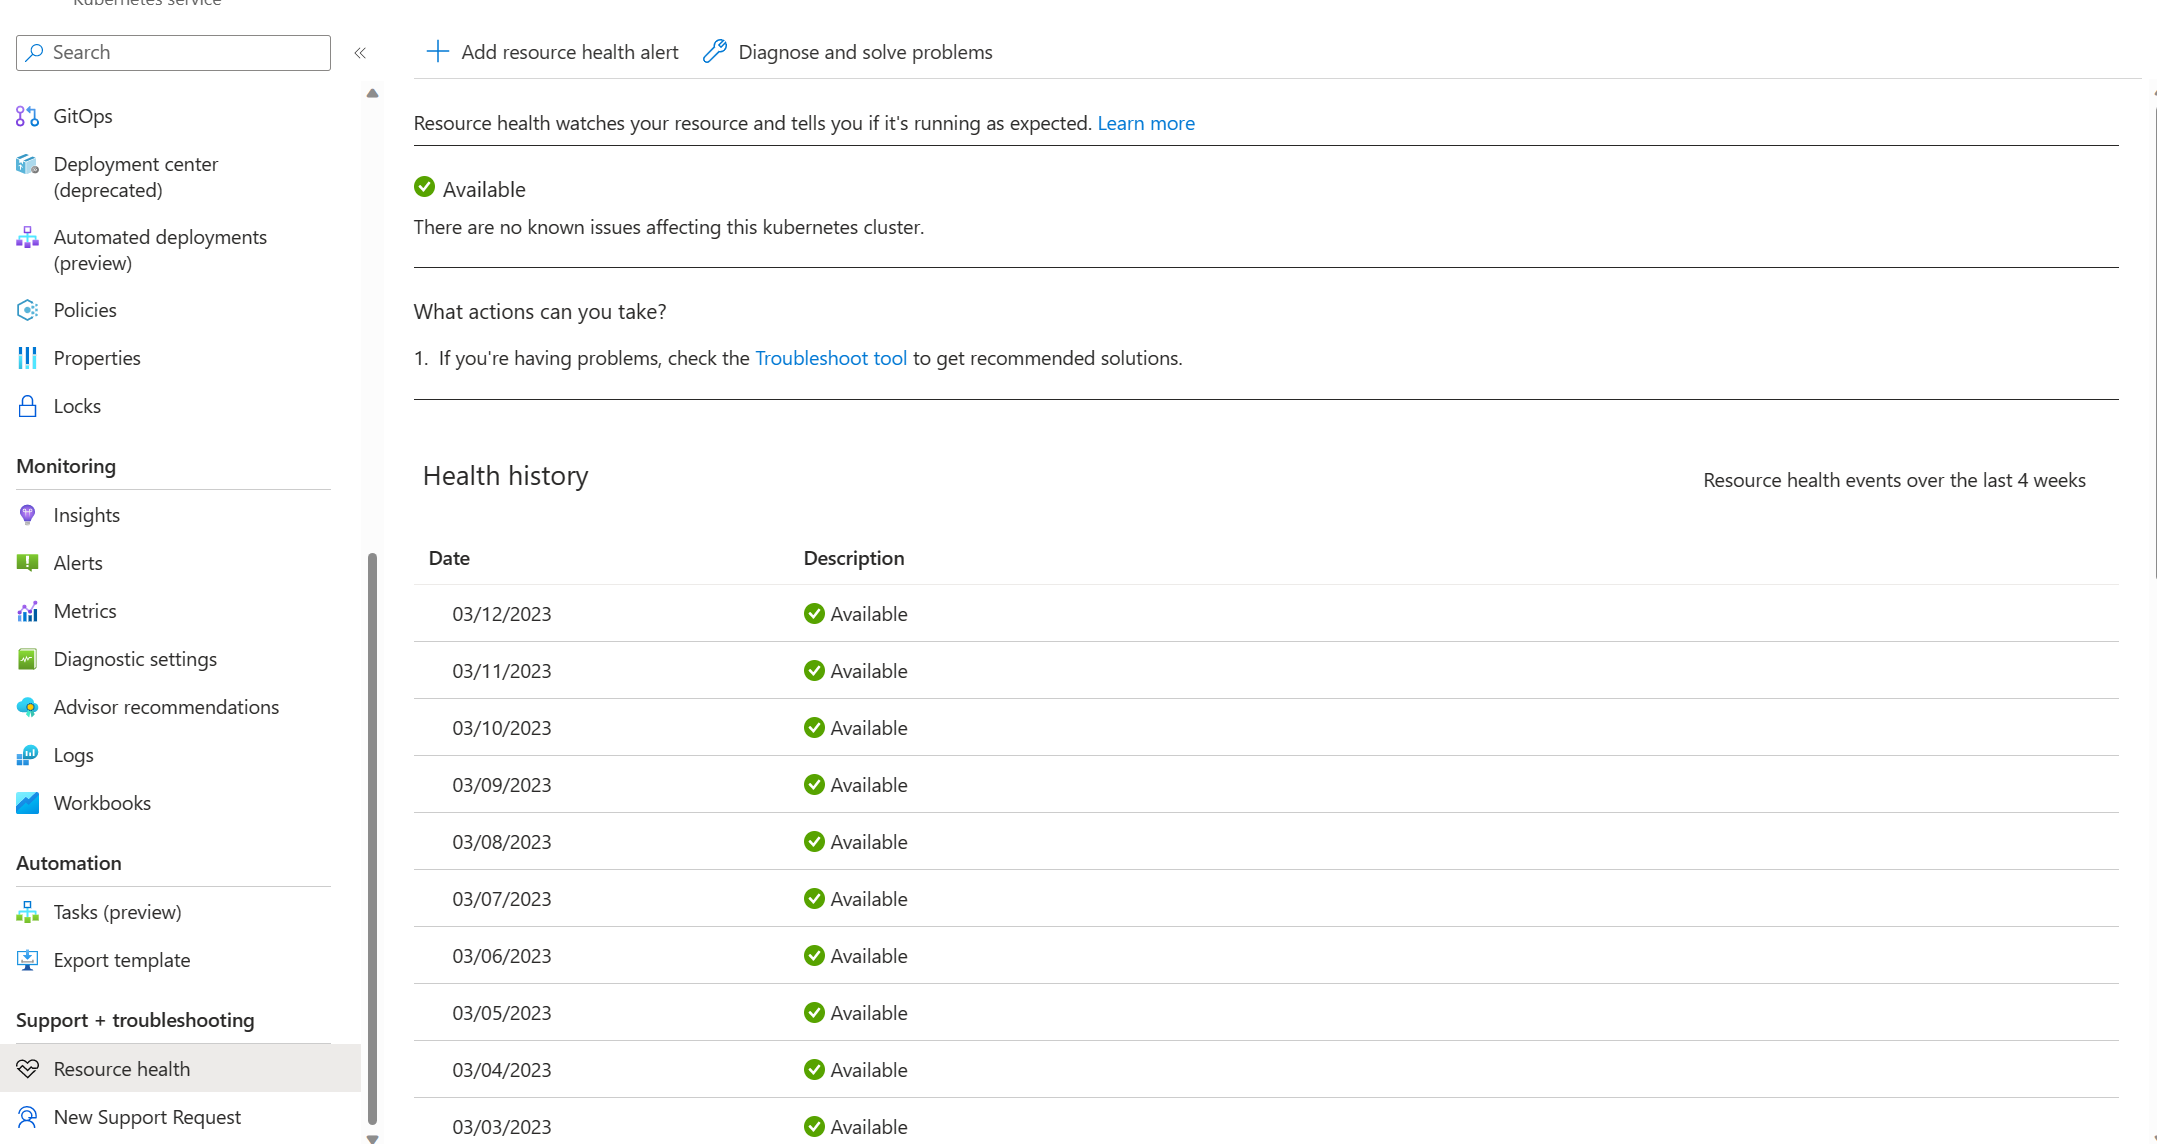
Use the resource health feature to identify and get support for cluster issues and service problems that can affect your cluster's health. Set up a resource alert so you can easily monitor the health of your cluster. The resource health feature provides a report on the current and past health of your cluster. There are four health statuses:
Available: This status indicates that there are no events detected that affect the health of the cluster. If the cluster has recovered from unplanned downtime within the last 24 hours, a recently resolved notification appears.
Unavailable: This status indicates that an ongoing platform or nonplatform event that affects the health of the cluster has been detected.
Unknown: This status indicates that the feature hasn't received any information about the resource for over 10 minutes. This status usually appears when a virtual machine is deallocated. This status isn't a definitive indication of the resource's state, but it can be a useful data point for troubleshooting.
Degraded: This status indicates that there's a loss in performance for your cluster, but the cluster is still available for use.
The following screenshot shows the resource health overview.
For more information, see Azure resource health overview.
Advisor
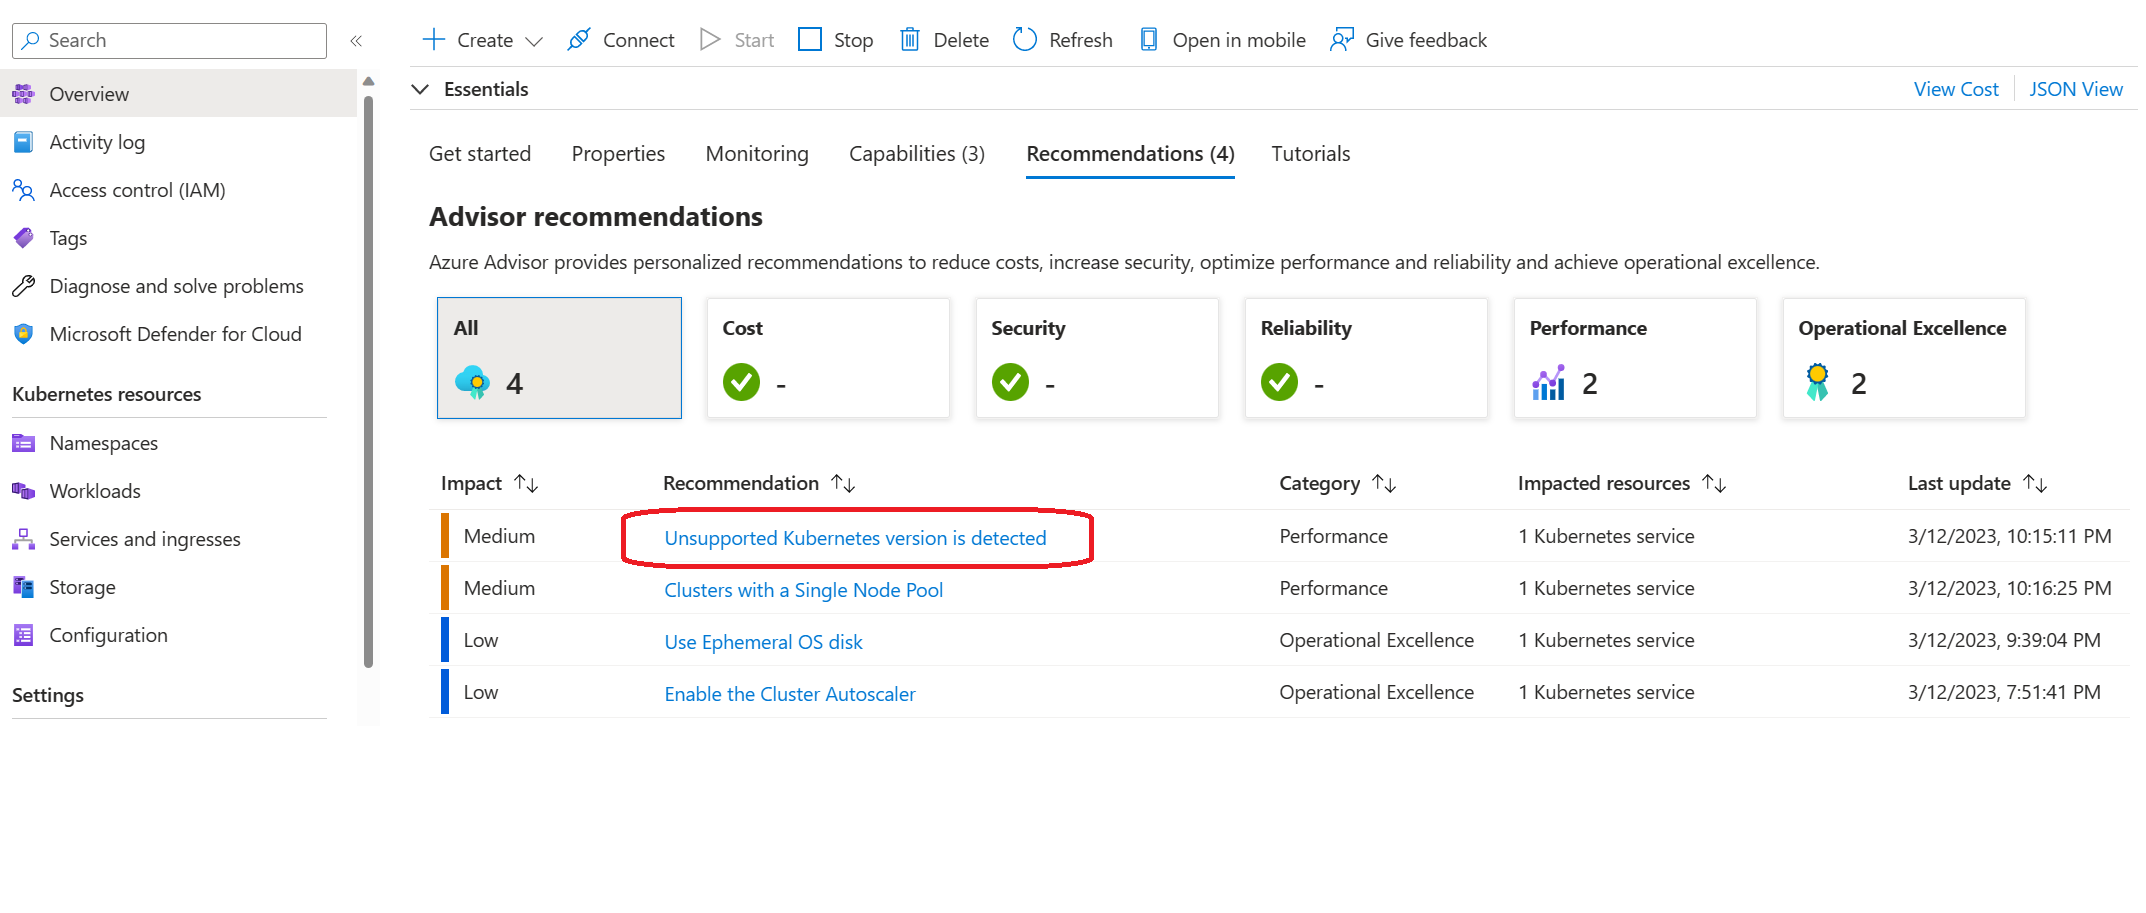
Advisor provides actionable recommendations to help you optimize your AKS clusters for reliability, security, operational excellence, and performance efficiency. You can use Advisor to proactively improve your cluster's performance and avoid potential issues. Select a recommendation for detailed information about how to optimize your cluster.
The following screenshot shows the resources for the selected recommendation.
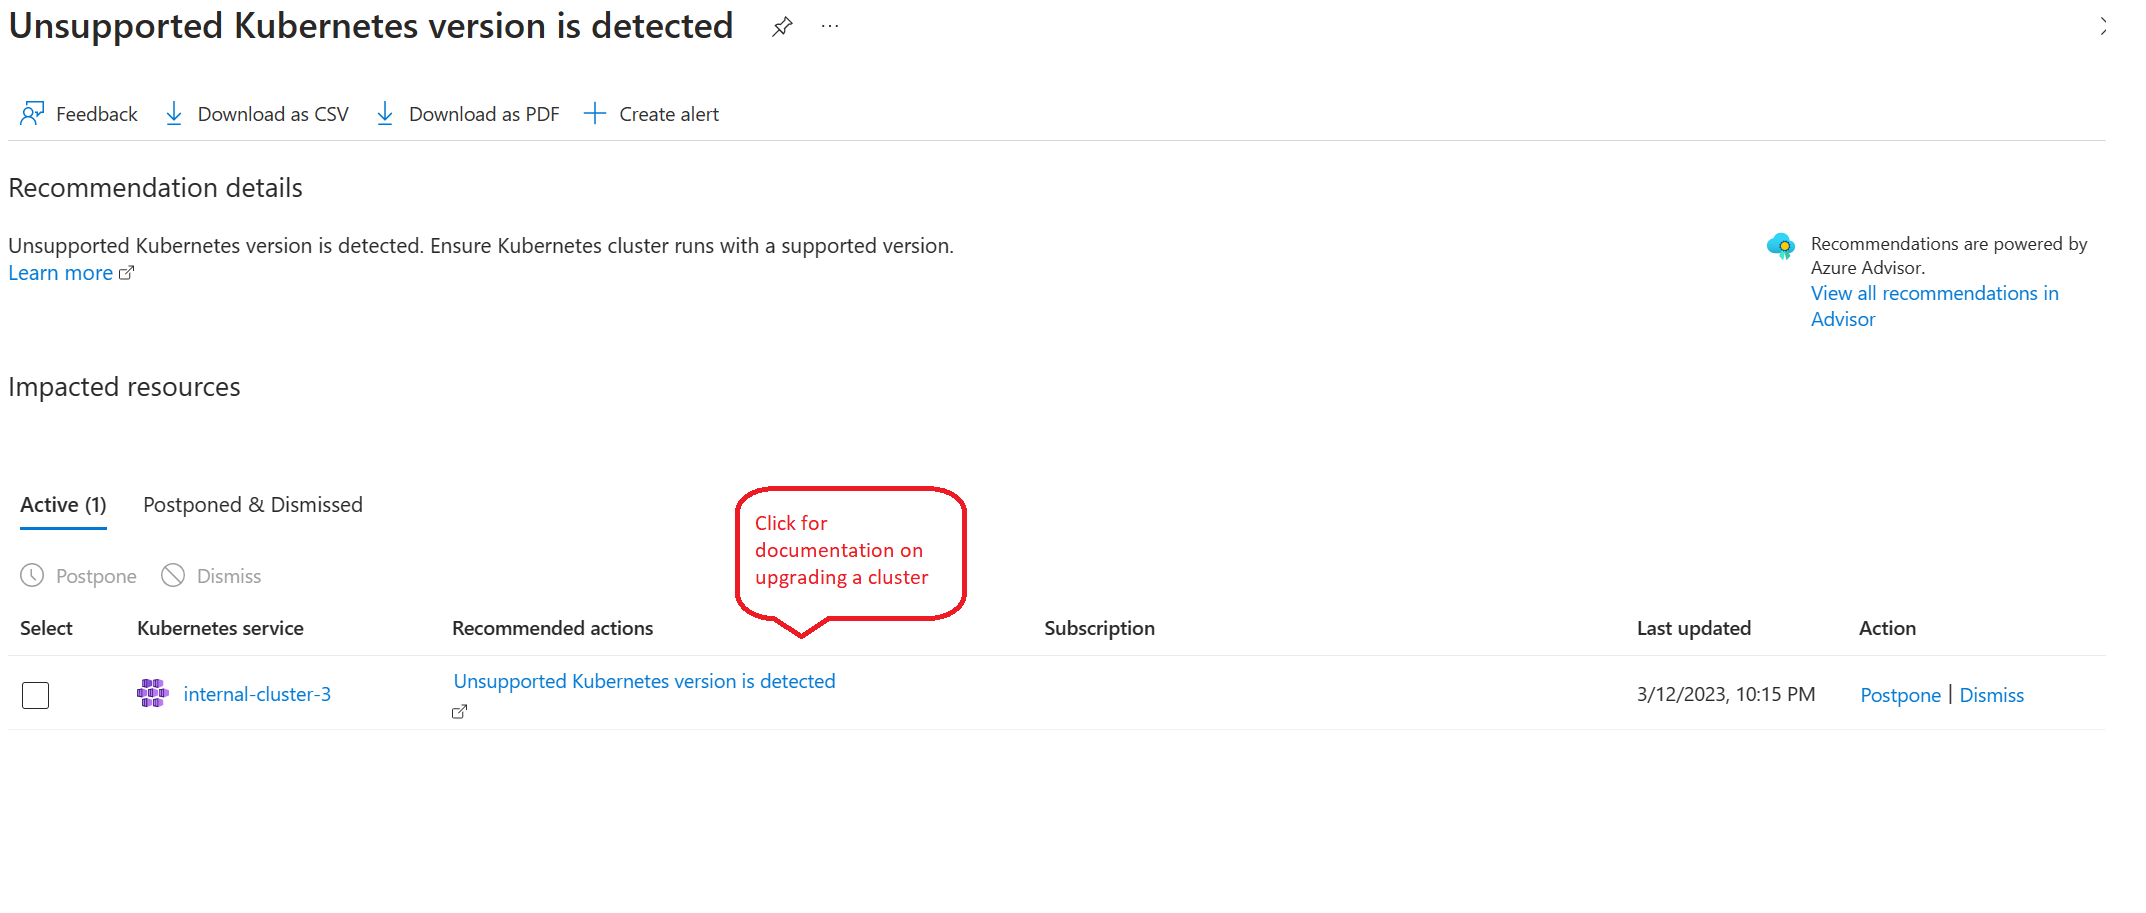 For more information, see Advisor overview.
Log Analytics
Log Analytics provides insights into the cluster's health. To access the Log Analytics workspace, go to your AKS cluster and select Logs in the navigation pane.
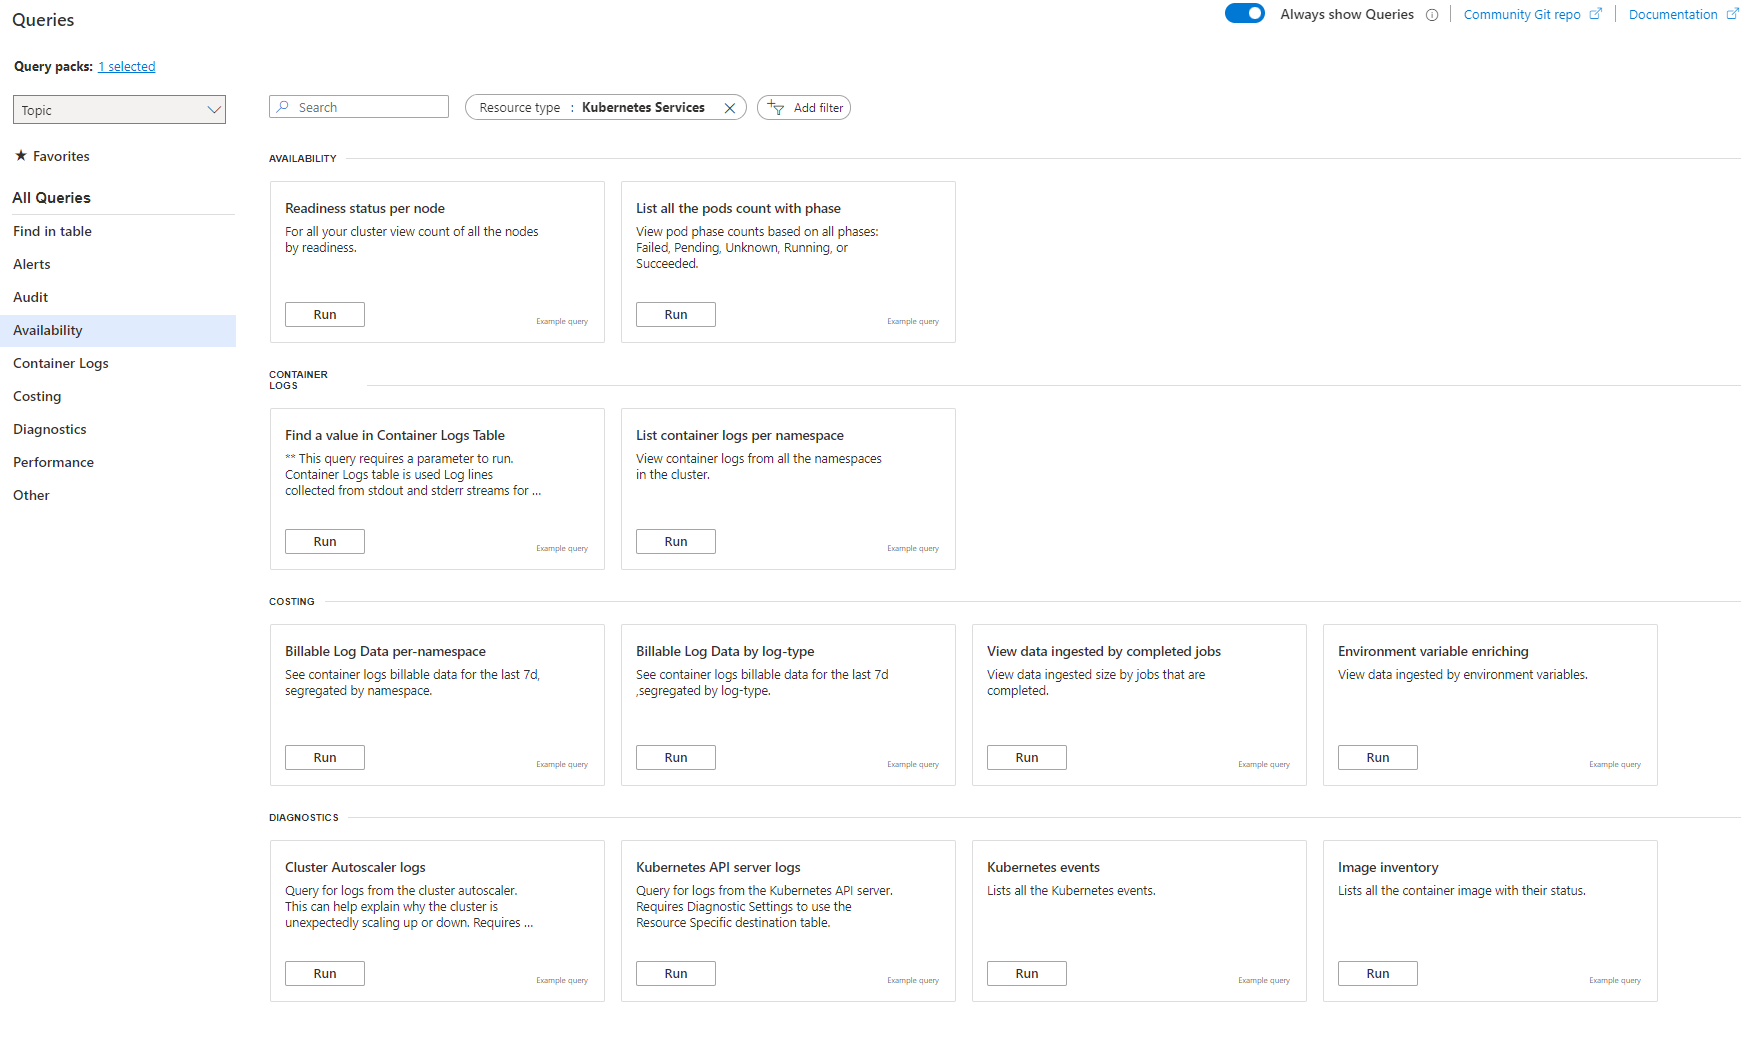
You can choose predefined queries to analyze cluster health.
Use built-in queries to query logs and metrics collected in the Log Analytics workspace. The following list describes the functions of some of the queries in the availability, container logs, and diagnostics categories.
Availability
Readiness status per node query: View the count of all nodes in the cluster by the readiness status.
List all the pods count with phase query: View the count of all pods by the phase, such as failed, pending, unknown, running, or succeeded.
Container logs
Find a value in Container Logs Table query: Find rows in the ContainerLogs table where LogEntry has a specified string parameter.
List container logs per namespace query: View container logs from the namespaces in the cluster.
Diagnostics
Cluster Autoscaler logs query: Query for logs from the cluster autoscaler. This query can provide information about why the cluster unexpectedly scales up or down.
Kubernetes API server logs query: Query for logs from the Kubernetes API server.
Image inventory query: List all container images and their status.
Prometheus disk read per second per node query: View Prometheus disk read metrics from the default Kubernetes namespace as a timechart.
Instances Avg CPU usage growth from last week query: Show the average CPU growth by instance in the past week, in descending order.
Contributors
This article is maintained by Microsoft. It was originally written by the following contributors.
Principal authors:
- Paolo Salvatori | Principal Customer Engineer
- Francis Simy Nazareth | Senior Technical Specialist
Other contributor:
- Rong Zhang | Senior Product Manager
To see non-public LinkedIn profiles, sign in to LinkedIn.
