Submit a batch run and evaluate a flow
Important
Items marked (preview) in this article are currently in public preview. This preview is provided without a service-level agreement, and we don't recommend it for production workloads. Certain features might not be supported or might have constrained capabilities. For more information, see Supplemental Terms of Use for Microsoft Azure Previews.
To evaluate how well your flow performs with a large dataset, you can submit batch run and use an evaluation method in prompt flow.
In this article you learn to:
- Submit a batch run and use an evaluation method
- View the evaluation result and metrics
- Start a new round of evaluation
- Check batch run history and compare metrics
- Understand the built-in evaluation methods
- Ways to improve flow performance
Prerequisites
For a batch run and to use an evaluation method, you need to have the following ready:
- A test dataset for batch run. Your dataset should be in one of these formats:
.csv,.tsv, or.jsonl. Your data should also include headers that match the input names of your flow. If your flow inputs include a complex structure like a list or dictionary, usejsonlformat to represent your data. - An available compute session to run your batch run. A compute session is a cloud-based resource that executes your flow and generates outputs. To learn more about compute sessions, see compute session.
Submit a batch run and use an evaluation method
A batch run allows you to run your flow with a large dataset and generate outputs for each data row. You can also choose an evaluation method to compare the output of your flow with certain criteria and goals. An evaluation method is a special type of flow that calculates metrics for your flow output based on different aspects. An evaluation run is executed to calculate the metrics when submitted with the batch run.
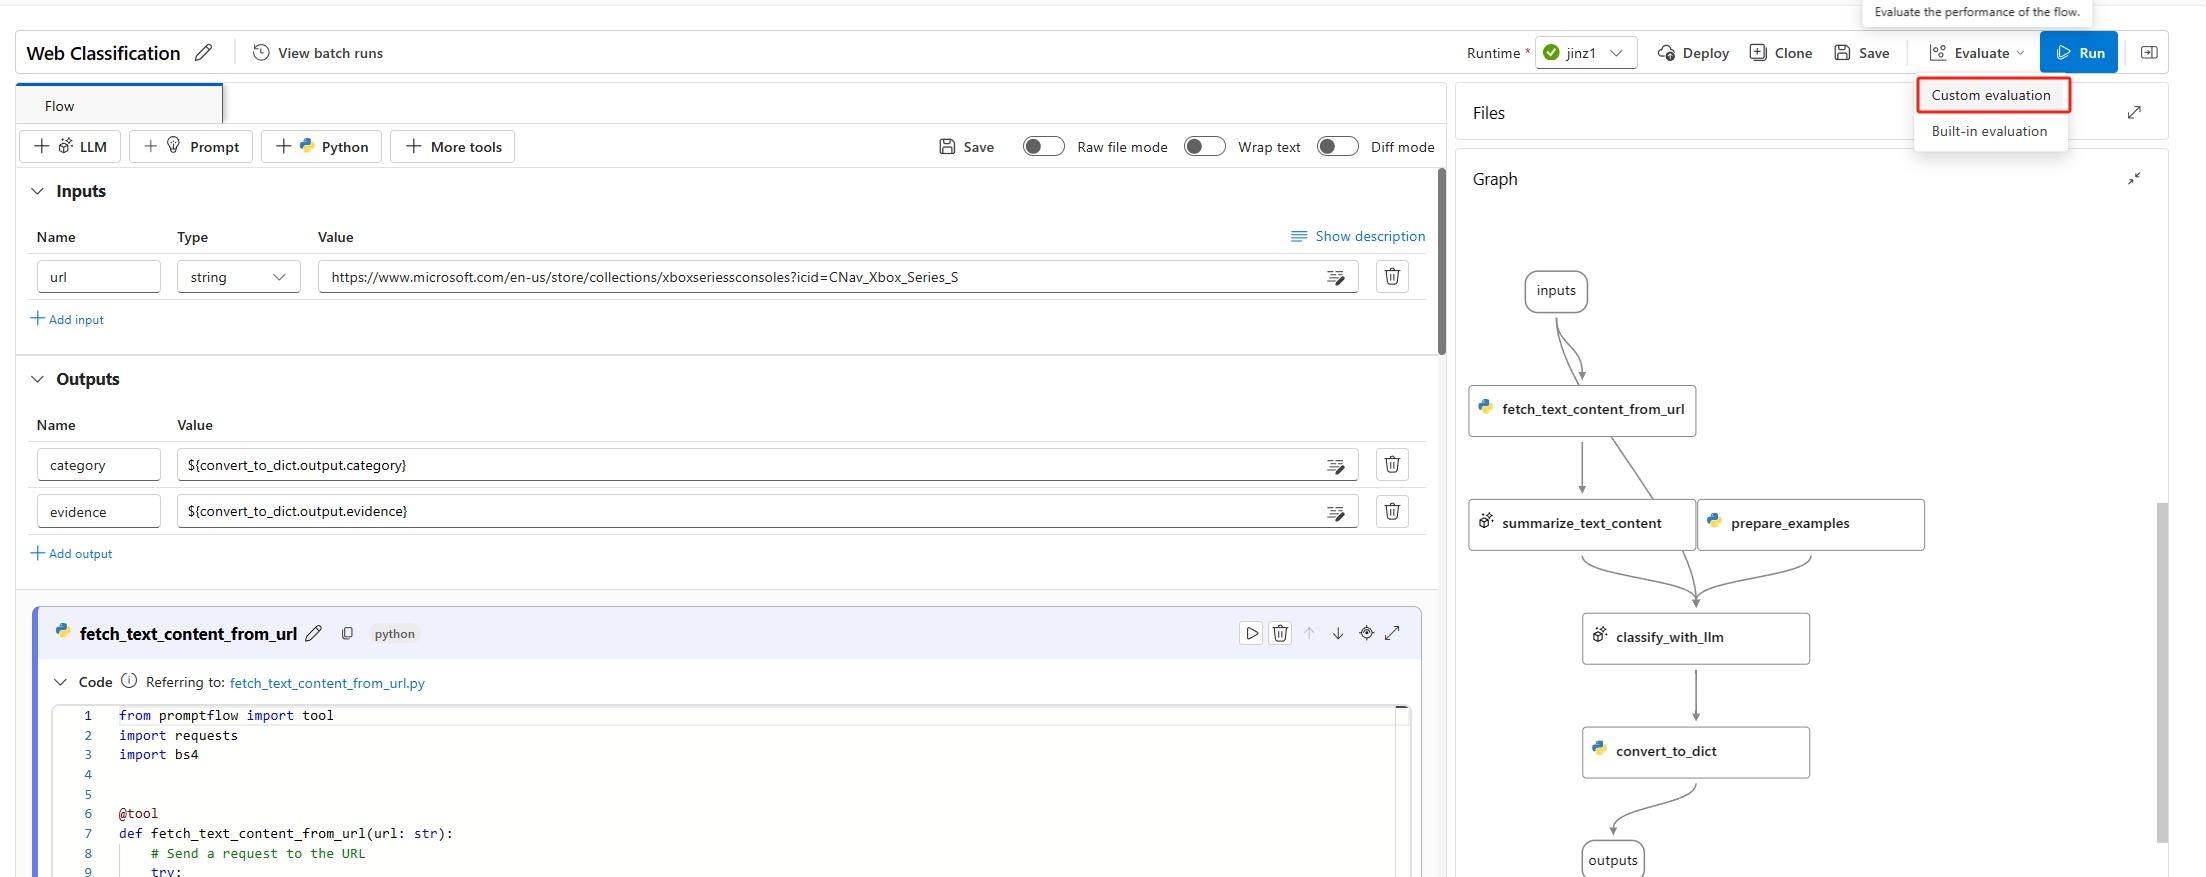
To start a batch run with evaluation, you can select on the Evaluate button - Custom evaluation. By selecting Custom evaluation, you can submit either a batch run with evaluation methods or submit a batch run without evaluation for your flow.
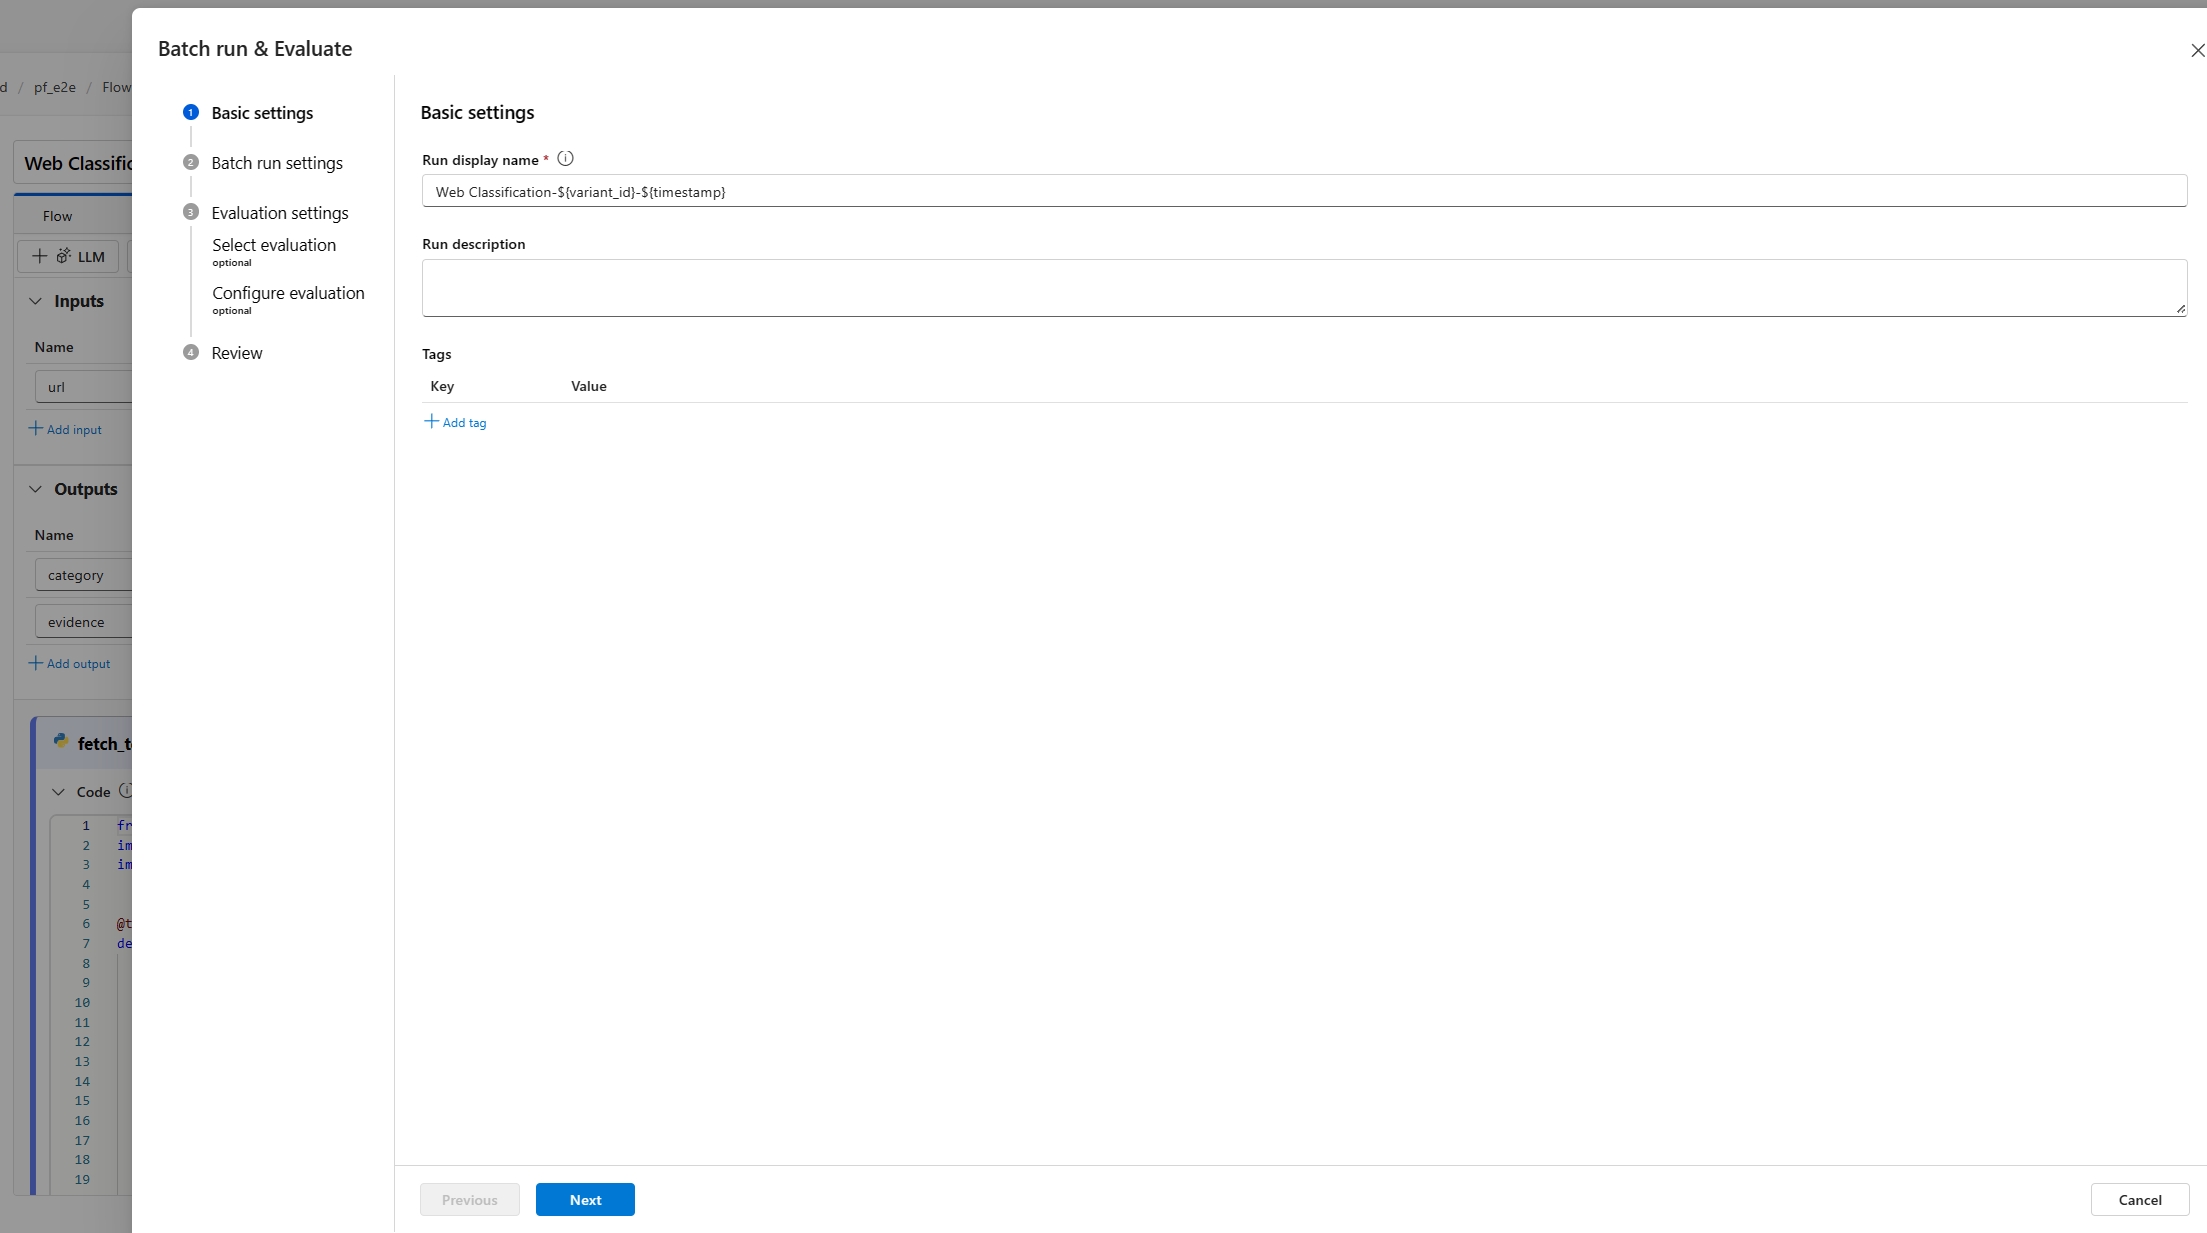
First, you're asked to give your batch run a descriptive and recognizable name. You can also write a description and add tags (key-value pairs) to your batch run. After you finish the configuration, select Next to continue.
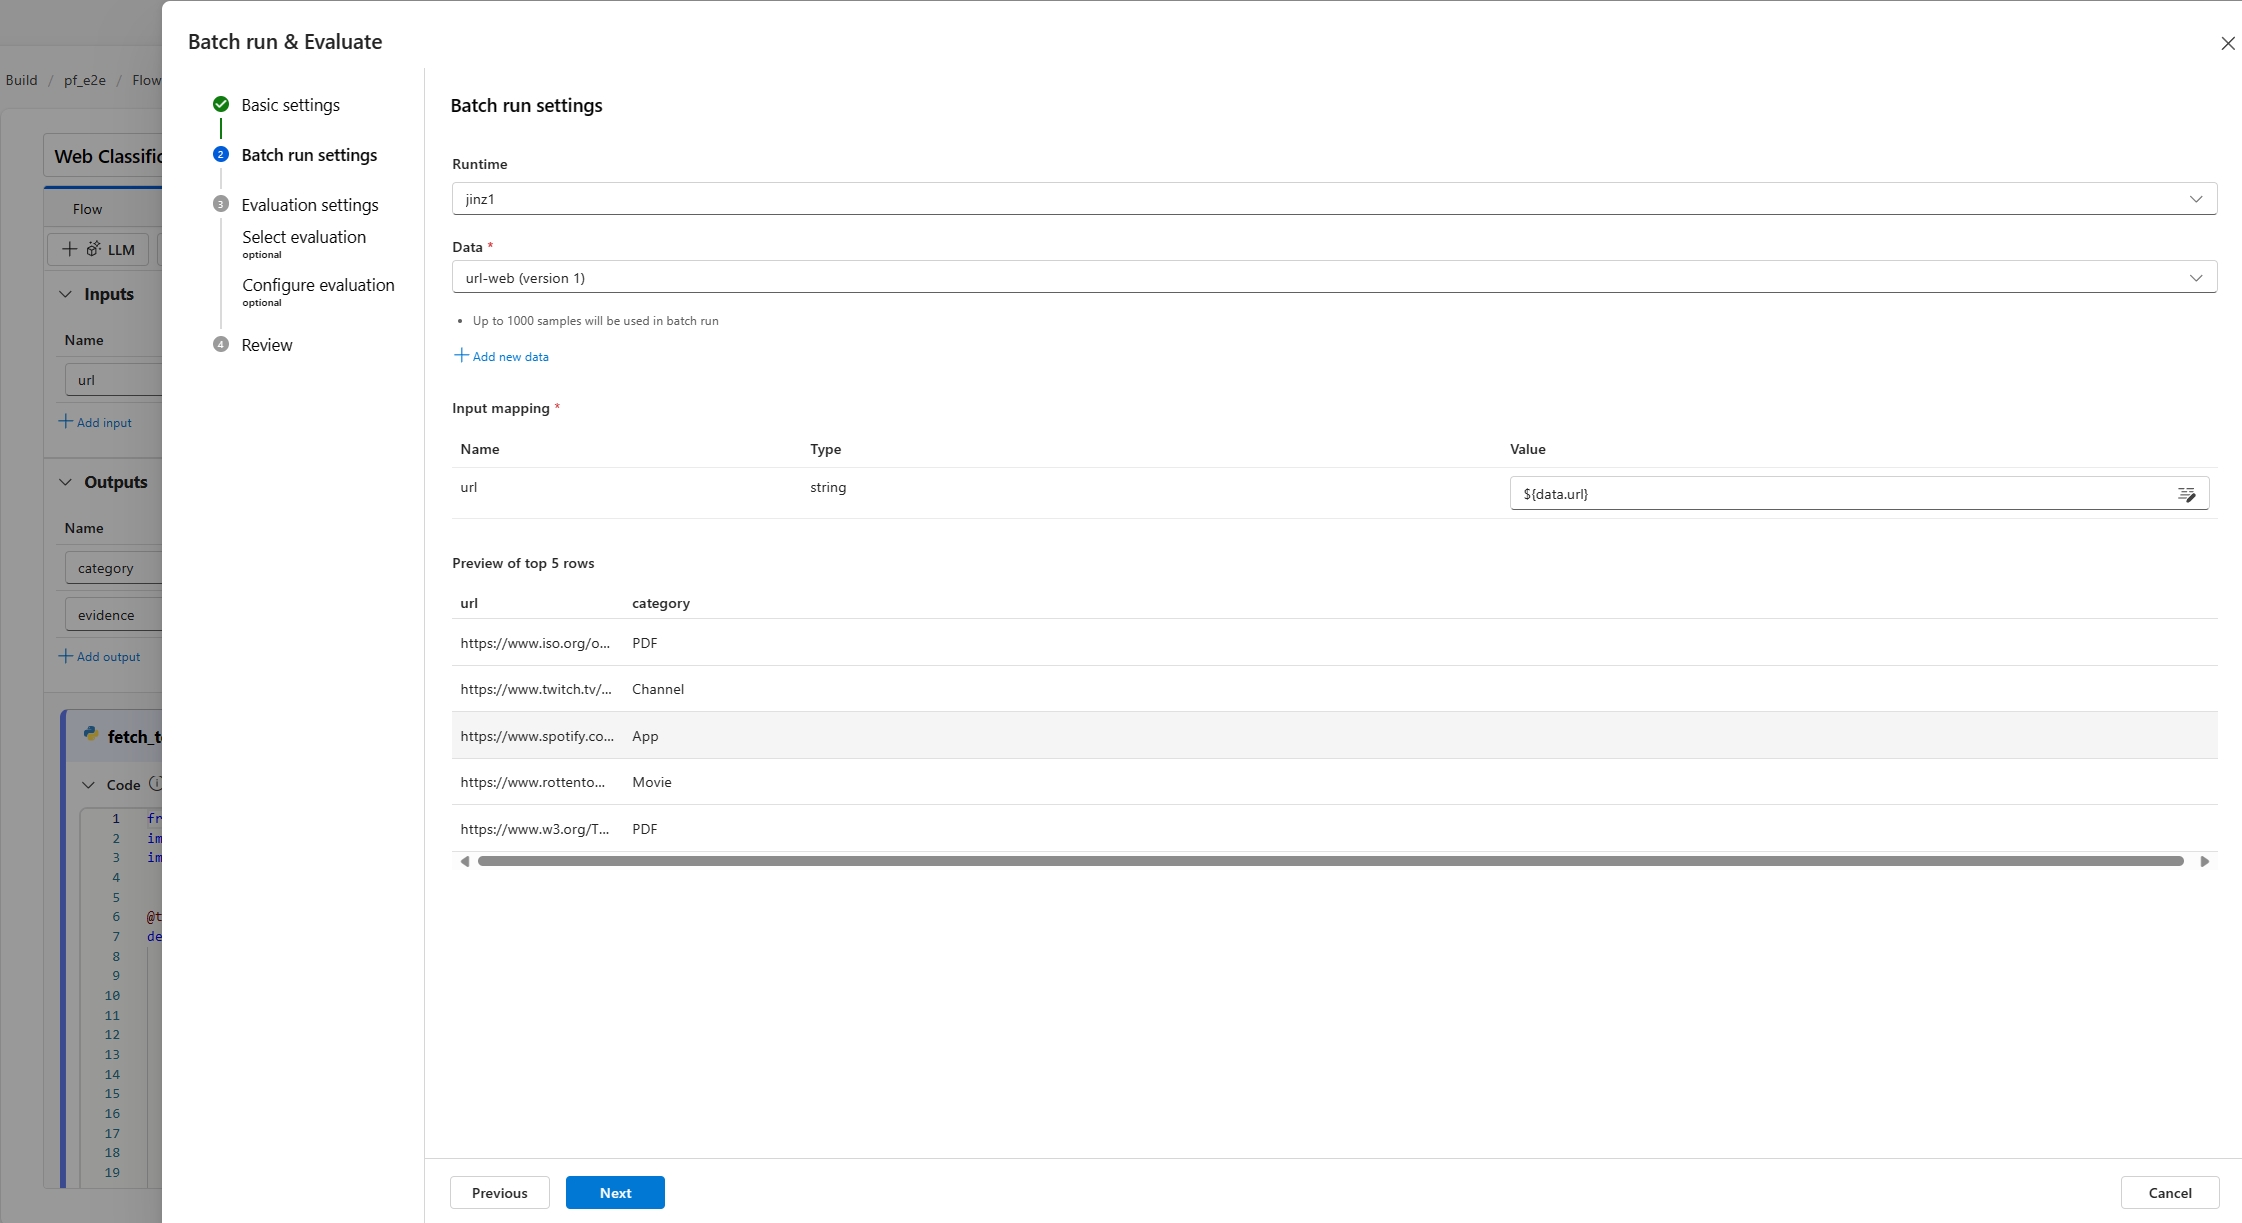
Second, you need to select or upload a dataset that you want to test your flow with. You also need to select an available compute session to execute this batch run.
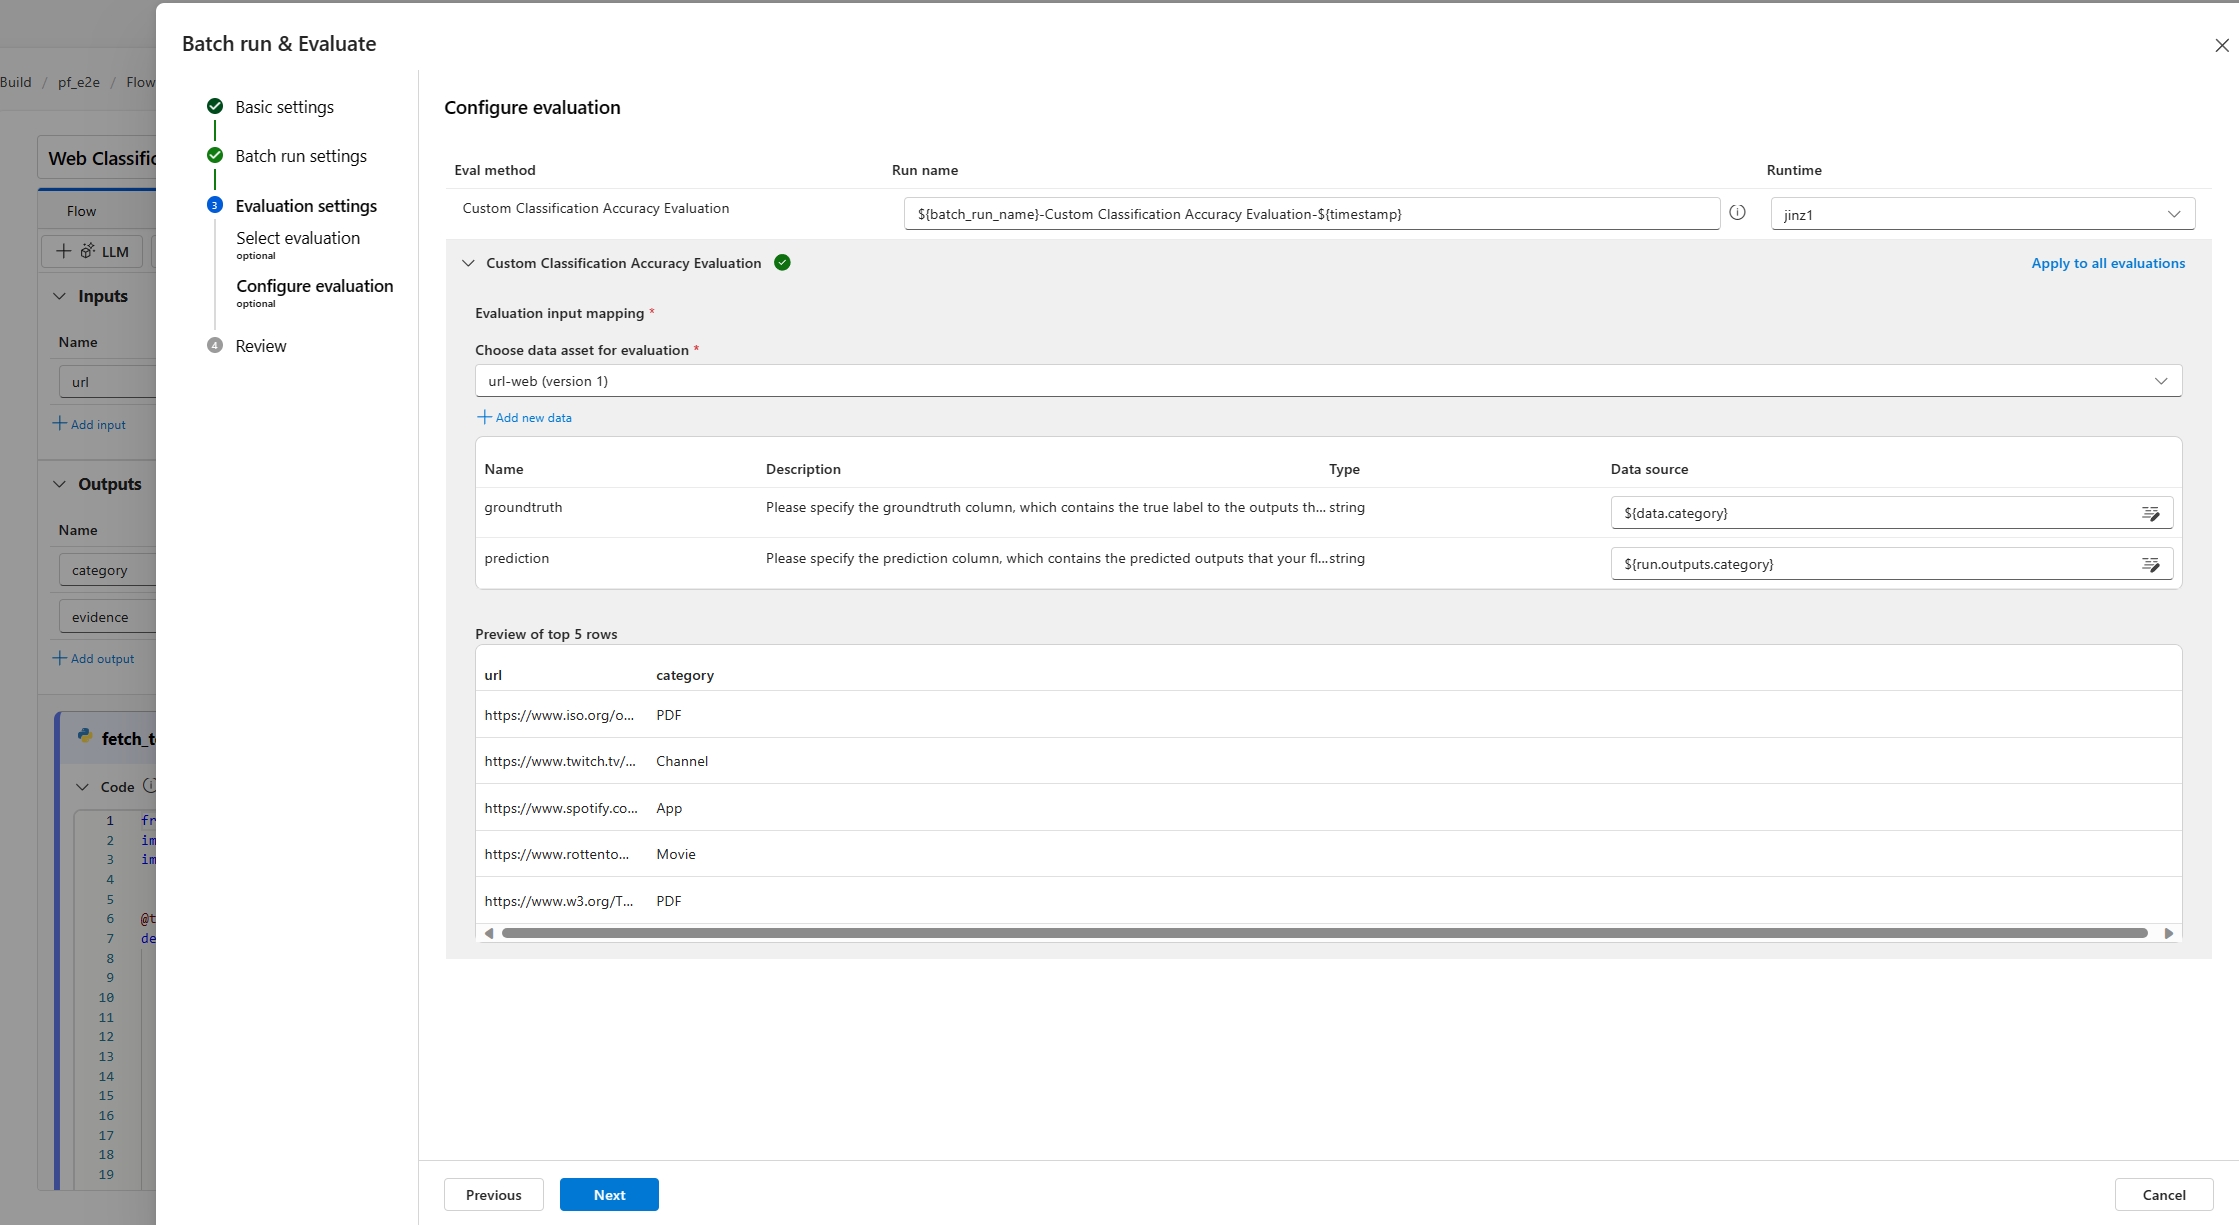
Prompt flow also supports mapping your flow input to a specific data column in your dataset. This means that you can assign a column to a certain input. You can assign a column to an input by referencing with ${data.XXX} format. If you want to assign a constant value to an input, you can directly type in that value.
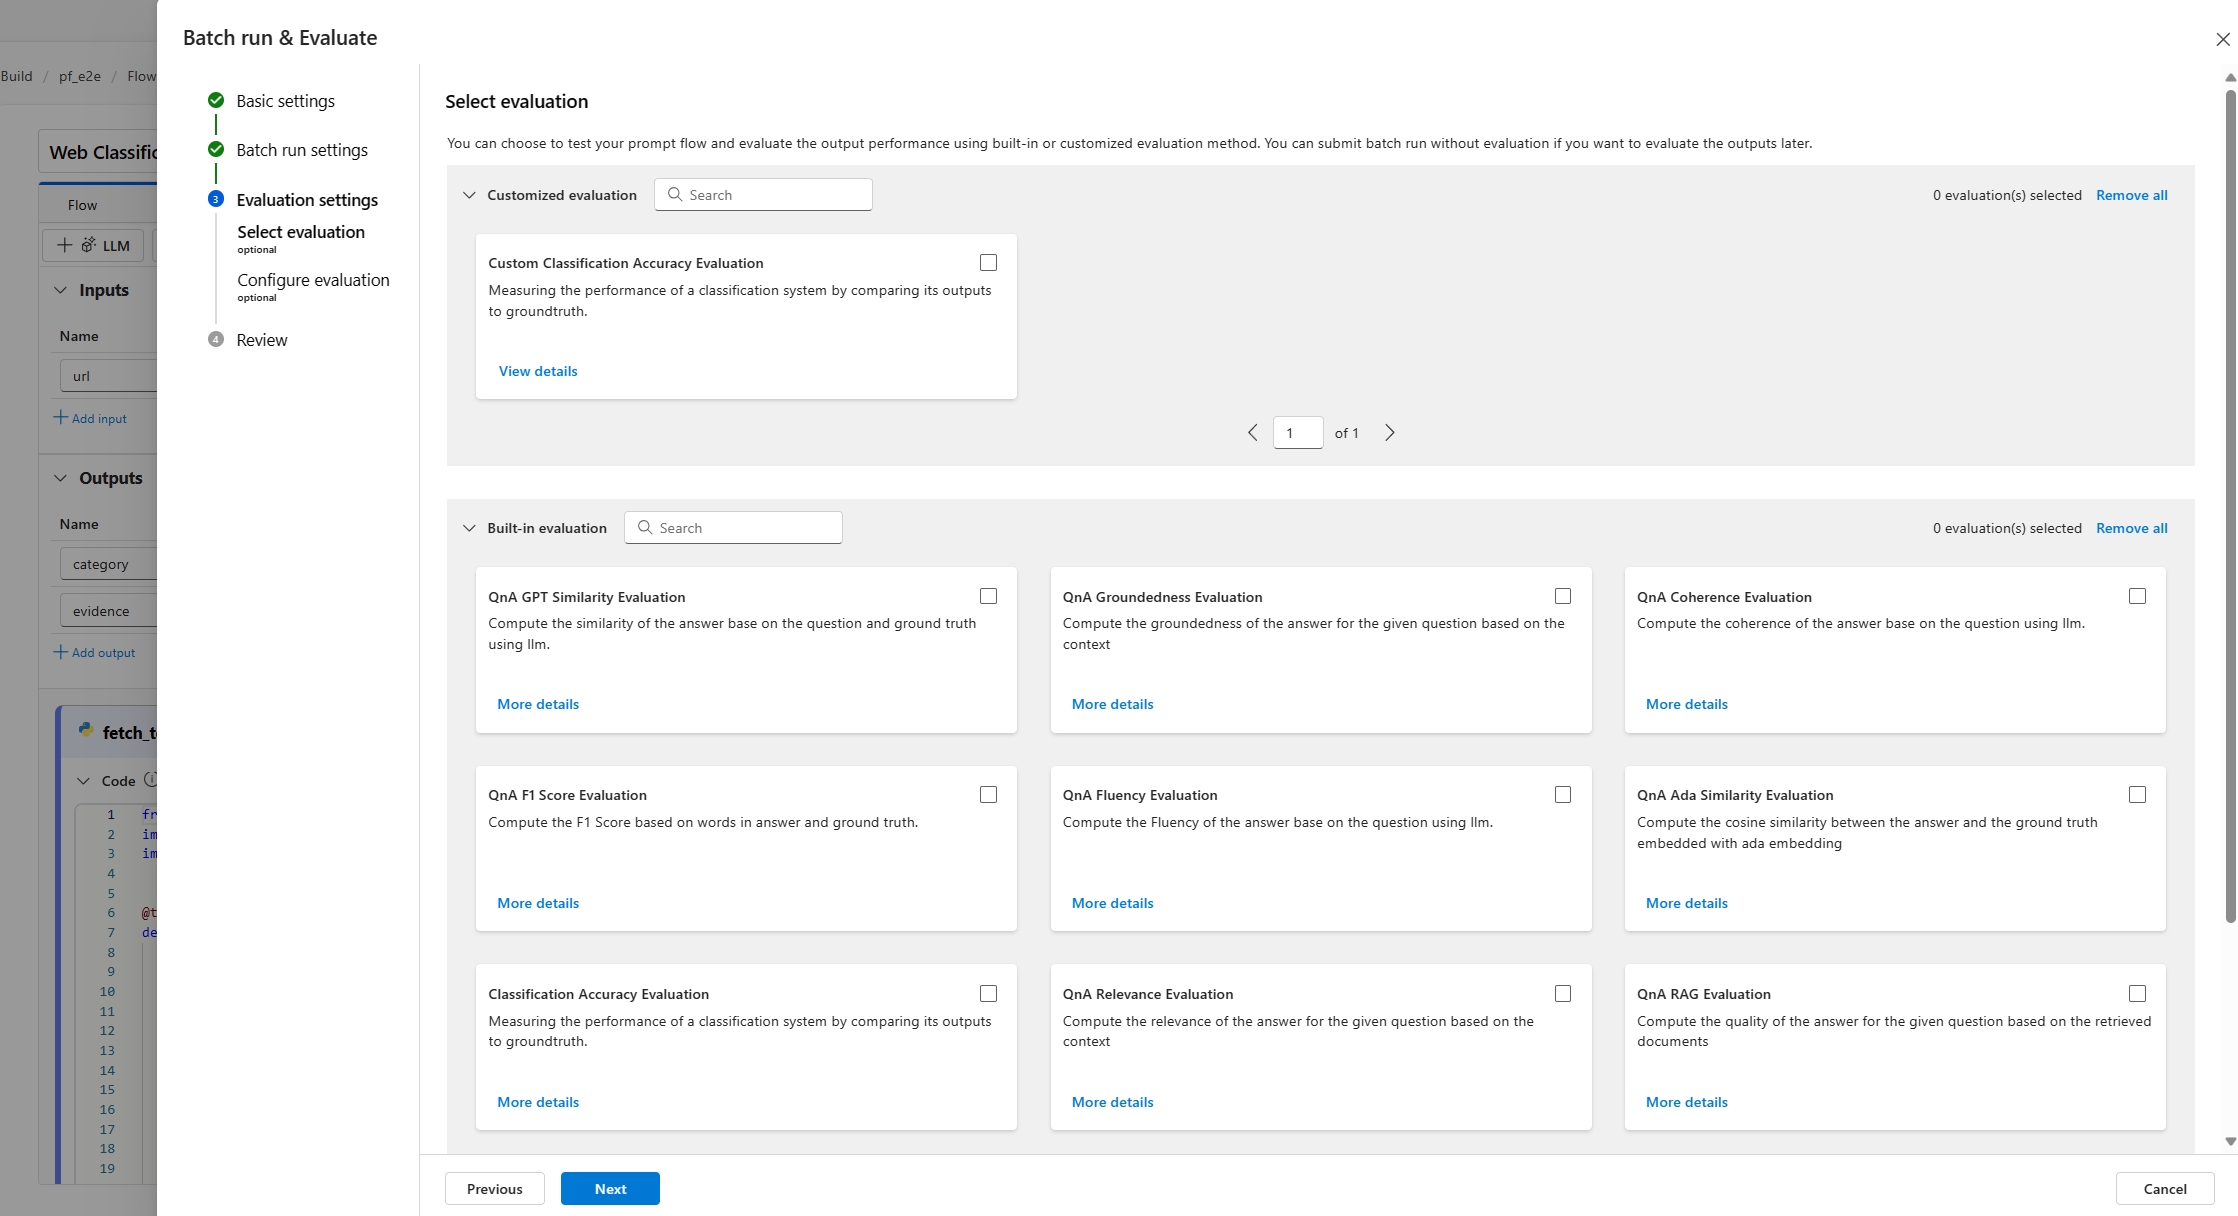
Then, in the next step, you can decide to use an evaluation method to validate the performance of this flow. You can directly select the Next button to skip this step if you don't want to apply any evaluation method or calculate any metrics. Otherwise, if you want to run batch run with evaluation now, you can select one or more evaluation methods. The evaluation starts after the batch run is completed. You can also start another round of evaluation after the batch run is completed. To learn more about how to start a new round of evaluation, see Start a new round of evaluation.
In the next step input mapping section, you need to specify the sources of the input data that are needed for the evaluation method. For example, ground truth column can come from a dataset. By default, evaluation uses the same dataset as the test dataset provided to the tested run. However, if the corresponding labels or target ground truth values are in a different dataset, you can easily switch to that one.
- If the data source is from your run output, the source is indicated as ${run.output.[OutputName]}
- If the data source is from your test dataset, the source is indicated as ${data.[ColumnName]}
Note
If your evaluation doesn't require data from the dataset, you do not need to reference any dataset columns in the input mapping section, indicating the dataset selection is an optional configuration. Dataset selection won't affect evaluation result.
If an evaluation method uses Large Language Models (LLMs) to measure the performance of the flow response, you're also required to set connections for the LLM nodes in the evaluation methods.
Then you can select Next to review your settings and select on Submit to start the batch run with evaluation.
View the evaluation result and metrics
After submission, you can find the submitted batch run in the run list tab in prompt flow page. Select a run to navigate to the run result page.
In the run detail page, you can select Details to check the details of this batch run.
Output
Basic result and trace
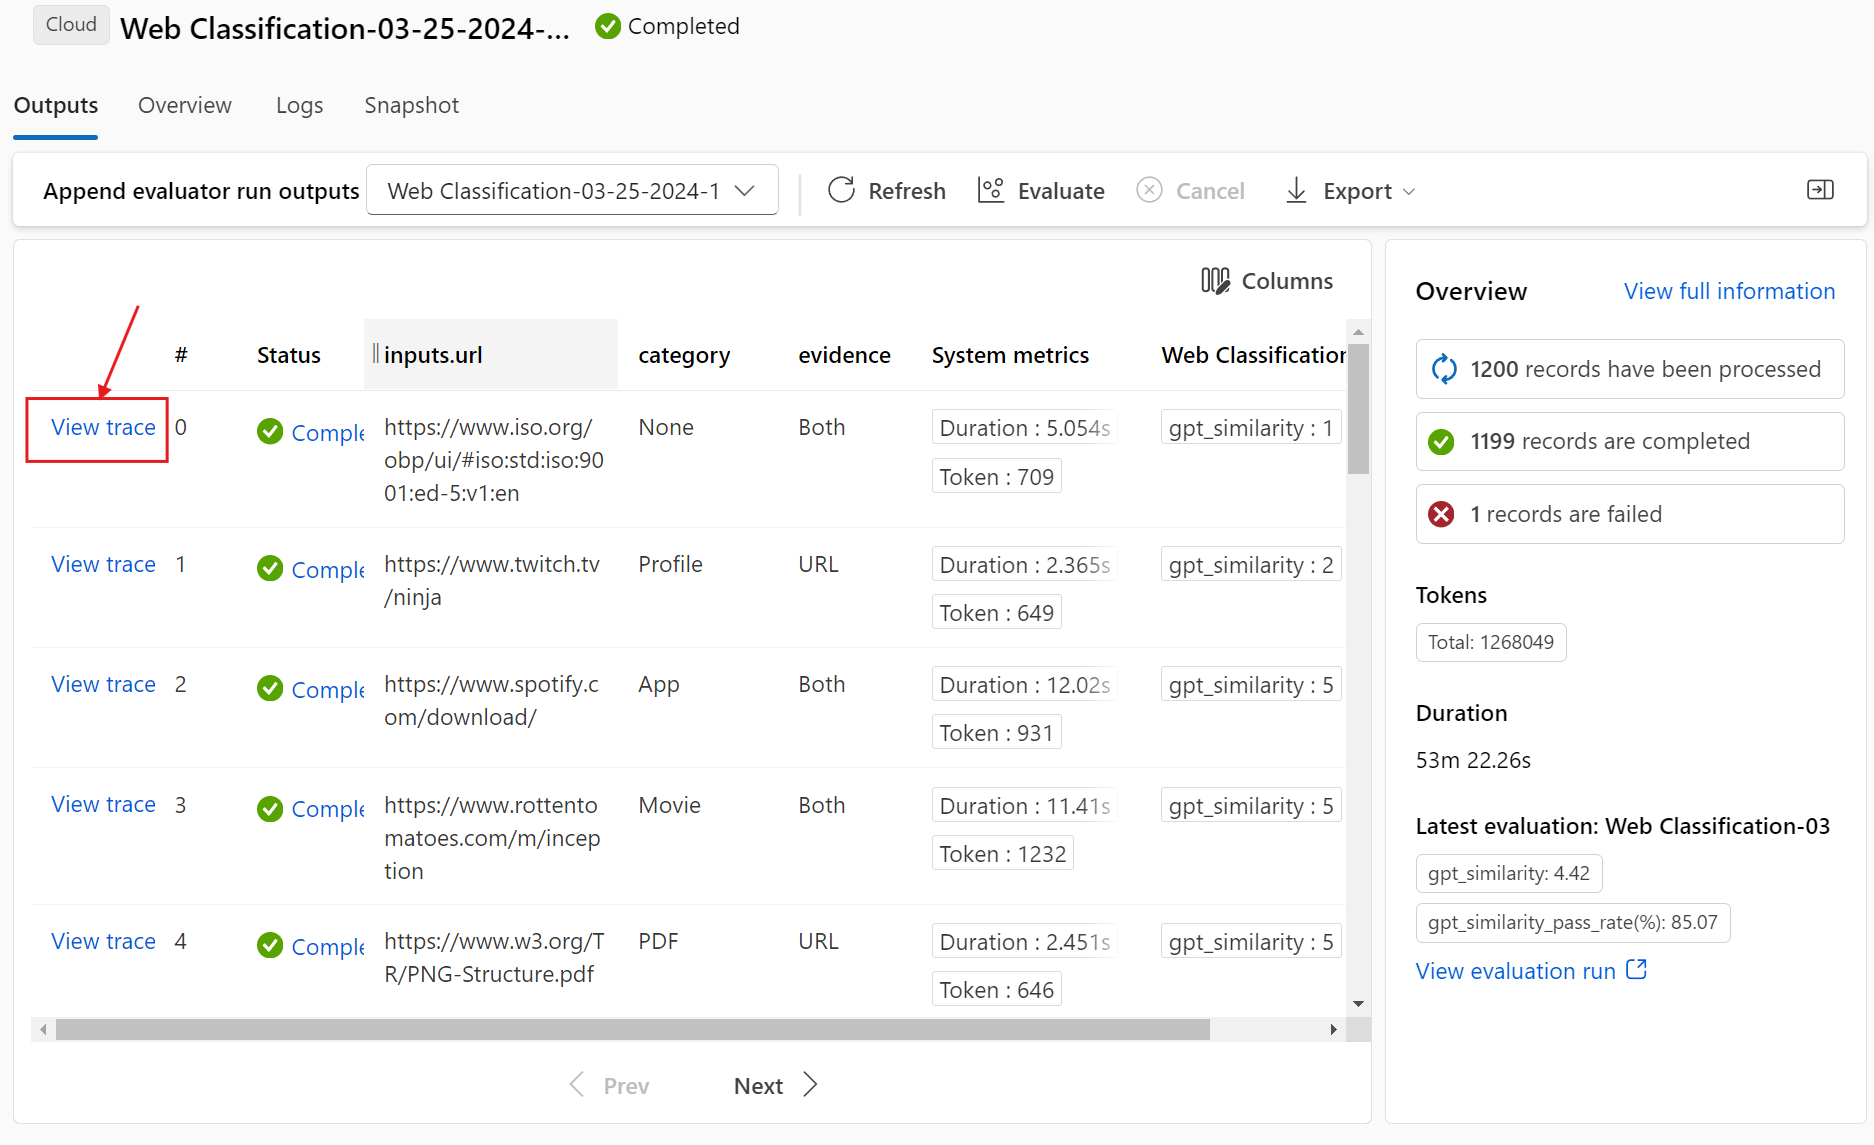
This will firstly direct you to the Output tab to view the inputs and outputs line by line. The output tab page displays a table list of results, including the line ID, input, output, status, system metrics, and created time.
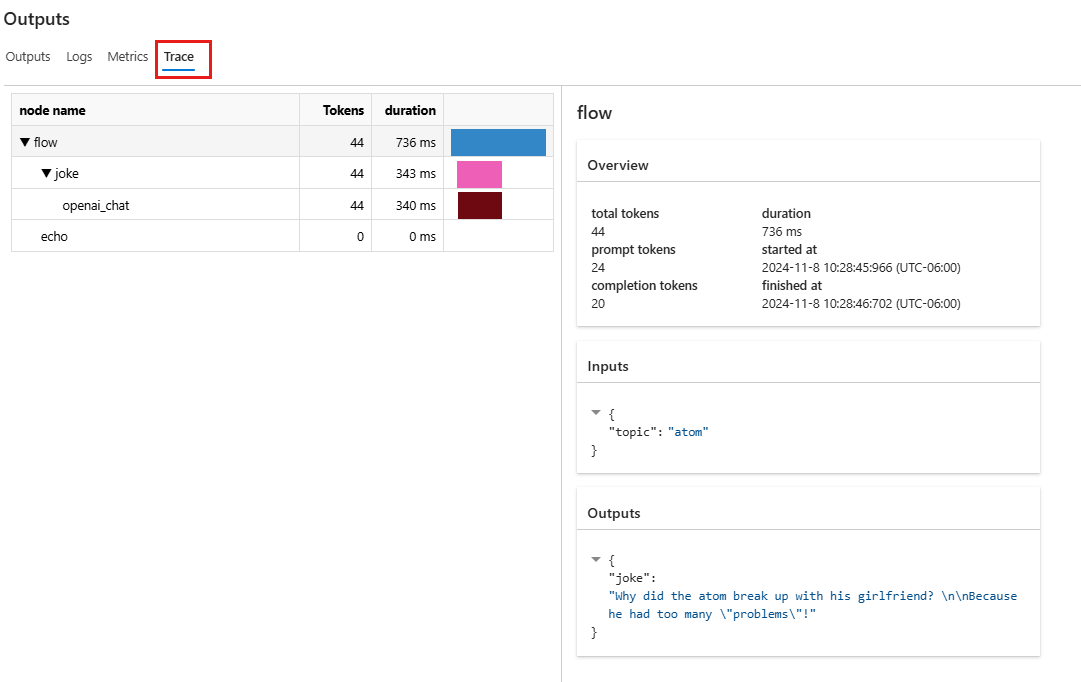
For each line, selecting View trace allows you to observe and debug that particular test case in its trace detailed page.
Append evaluation result and trace
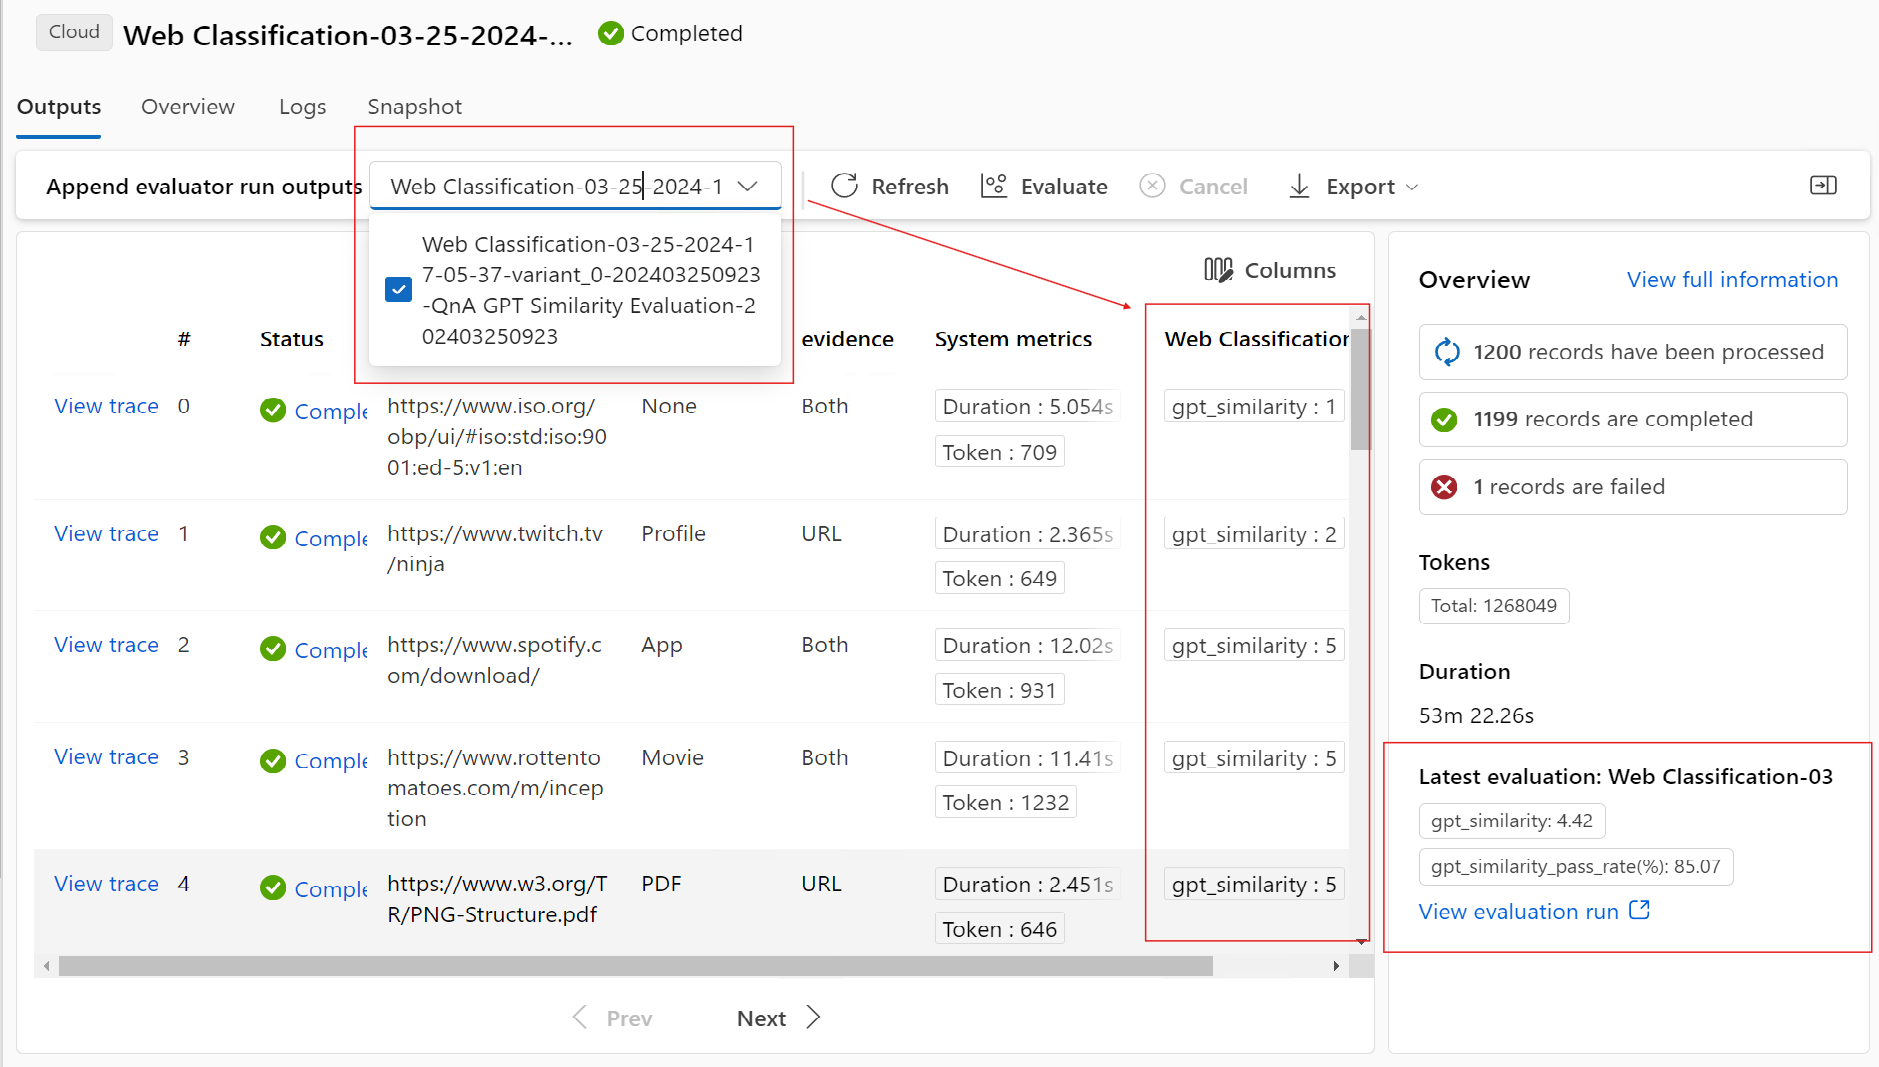
Selecting Append evaluation output allows you to select related evaluation runs and you see appended columns at the end of the table showing the evaluation result for each row of data. Multiple evaluation outputs can be appended for comparison.
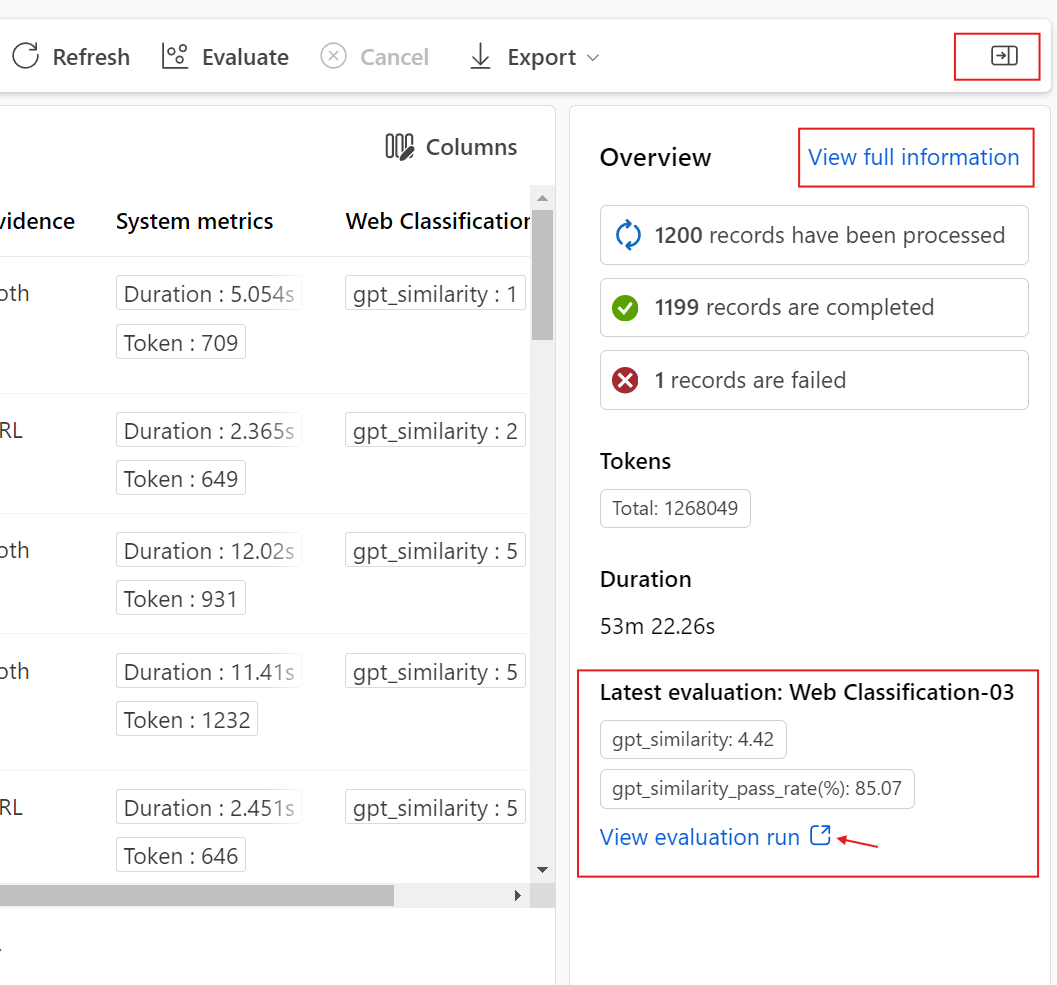
You can see the latest evaluation metrics in the left Overview panel.
Essential overview
On the right side, the Overview offers overall information about the run, such as the number of per data point execution, total tokens, and duration of the run.
The latest evaluation run aggregated metrics are shown here by default, you can select View evaluation run to jump to view the evaluation run itself.
The overview can be expanded and collapsed here, and you can select View full information which will direct you to the Overview tab beside the Output tab, where is containing more detailed information of this run.
Start a new round of evaluation
If you have already completed a batch run, you can start another round of evaluation to submit a new evaluation run to calculate metrics for the outputs without running your flow again. This is helpful and can save your cost to rerun your flow when:
- You didn't select an evaluation method to calculate the metrics when submitting the batch run, and decide to do it now.
- You have already used evaluation method to calculate a metric. You can start another round of evaluation to calculate another metric.
- Your evaluation run failed but your flow successfully generated outputs. You can submit your evaluation again.
You can go to the prompt flow Runs tab. Then go to the batch run detail page and select Evaluate to start another round of evaluation.
After setting up the configuration, you can select "Submit" for this new round of evaluation. After submission, you'll be able to see a new record in the prompt flow run list. After the evaluation run completed, similarly, you can check the result of evaluation in the "Outputs" tab of the batch run detail panel. You need to select the new evaluation run to view its result.
To learn more about the metrics calculated by the built-in evaluation methods, navigate to understand the built-in evaluation methods.
Overview
Selecting the Overview tab shows comprehensive information about the run, including run properties, input dataset, output dataset, tags, and description.
Logs
Selecting the Logs tab allows you to view the run logs, which can be useful for detailed debugging of execution errors. You can download the log files to your local machine.
Snapshot
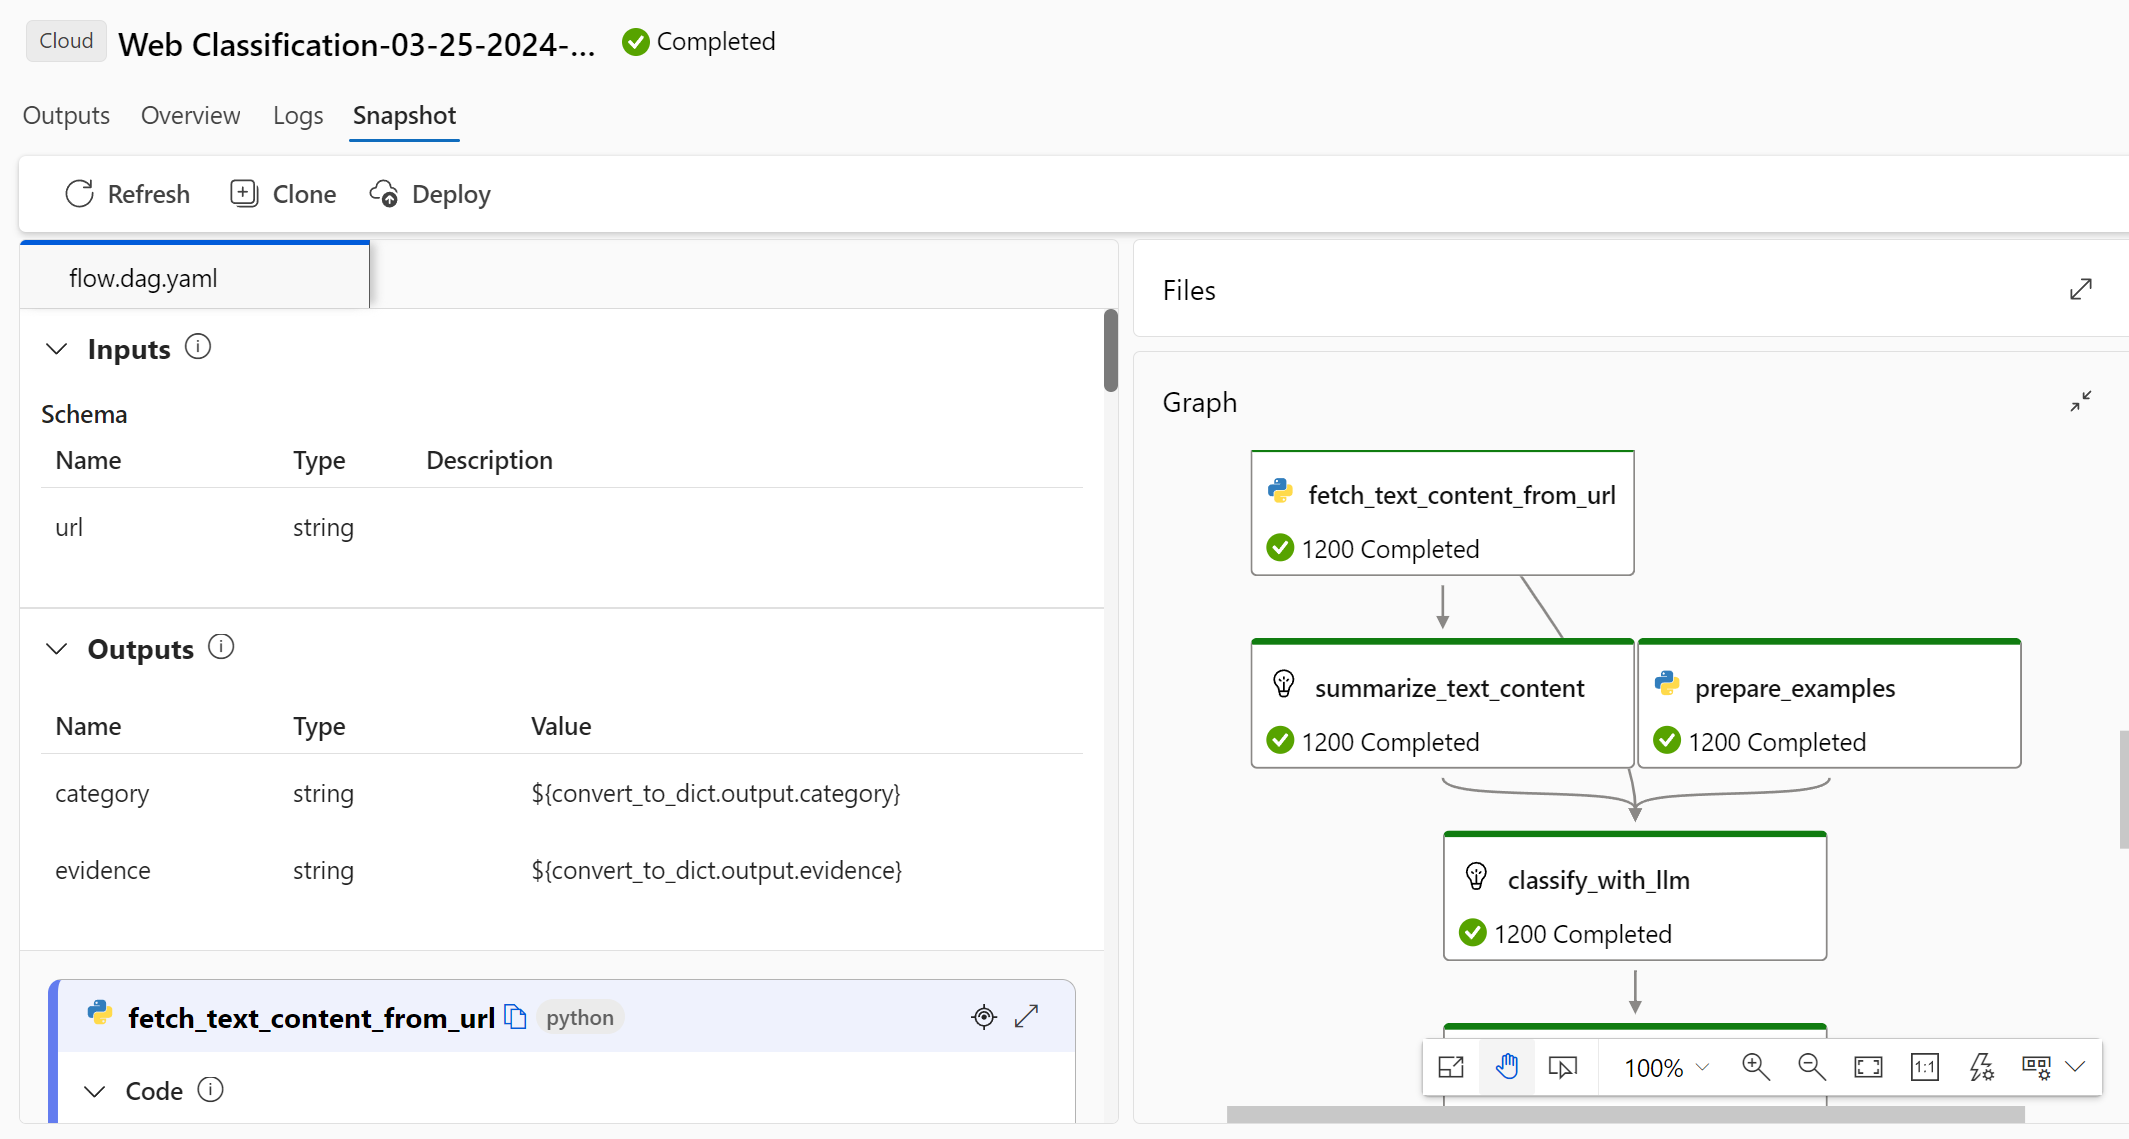
Selecting the Snapshot tab shows you the run snapshot. You can view the DAG of your flow. Additionally, you have the option to Clone it to create a new flow. You can also Deploy it as an online endpoint.
Check batch run history and compare metrics
In some scenarios, you modify your flow to improve its performance. You can submit more than one batch run to compare the performance of your flow with different versions. You can also compare the metrics calculated by different evaluation methods to see which one is more suitable for your flow.
To check the batch run history of your flow, you can select the View batch run button of your flow page. You see a list of batch runs that you have submitted for this flow.
You can select on each batch run to check the detail. You can also select multiple batch runs and select on the Visualize outputs to compare the metrics and the outputs of the batch runs.
In the "Visualize output" panel the Runs & metrics table shows the information of the selected runs with highlight. Other runs that take the outputs of the selected runs as input are also listed.
In the "Outputs" table, you can compare the selected batch runs by each line of sample. By selecting the "eye visualizing" icon in the "Runs & metrics" table, outputs of that run will be appended to the corresponding base run.
Understand the built-in evaluation methods
In prompt flow, we provide multiple built-in evaluation methods to help you measure the performance of your flow output. Each evaluation method calculates different metrics. See the following table for a list of built-in evaluation methods and their descriptions.
| Evaluation Method | Metrics | Description | Connection Required | Required Input | Score Value |
|---|---|---|---|---|---|
| Classification Accuracy Evaluation | Accuracy | Measures the performance of a classification system by comparing its outputs to ground truth. | No | prediction, ground truth | in the range [0, 1]. |
| QnA Relevance Scores Pairwise Evaluation | Score, win/lose | Assesses the quality of answers generated by a question answering system. It involves assigning relevance scores to each answer based on how well it matches the user question, comparing different answers to a baseline answer, and aggregating the results to produce metrics such as averaged win rates and relevance scores. | Yes | question, answer (no ground truth or context) | Score: 0-100, win/lose: 1/0 |
| QnA Groundedness Evaluation | Groundedness | Measures how grounded the model's predicted answers are in the input source. Even if LLM’s responses are true, if not verifiable against source, then is ungrounded. | Yes | question, answer, context (no ground truth) | 1 to 5, with 1 being the worst and 5 being the best. |
| QnA GPT Similarity Evaluation | GPT Similarity | Measures similarity between user-provided ground truth answers and the model predicted answer using GPT Model. | Yes | question, answer, ground truth (context not needed) | in the range [0, 1]. |
| QnA Relevance Evaluation | Relevance | Measures how relevant the model's predicted answers are to the questions asked. | Yes | question, answer, context (no ground truth) | 1 to 5, with 1 being the worst and 5 being the best. |
| QnA Coherence Evaluation | Coherence | Measures the quality of all sentences in a model's predicted answer and how they fit together naturally. | Yes | question, answer (no ground truth or context) | 1 to 5, with 1 being the worst and 5 being the best. |
| QnA Fluency Evaluation | Fluency | Measures how grammatically and linguistically correct the model's predicted answer is. | Yes | question, answer (no ground truth or context) | 1 to 5, with 1 being the worst and 5 being the best |
| QnA f1 scores Evaluation | F1 score | Measures the ratio of the number of shared words between the model prediction and the ground truth. | No | question, answer, ground truth (context not needed) | in the range [0, 1]. |
| QnA Ada Similarity Evaluation | Ada Similarity | Computes sentence (document) level embeddings using Ada embeddings API for both ground truth and prediction. Then computes cosine similarity between them (one floating point number) | Yes | question, answer, ground truth (context not needed) | in the range [0, 1]. |
Ways to improve flow performance
After checking the built-in methods from the evaluation, you can try to improve your flow performance by:
- Check the output data to debug any potential failure of your flow.
- Modify your flow to improve its performance. This includes but not limited to:
- Modify the prompt
- Modify the system message
- Modify parameters of the flow
- Modify the flow logic
To learn more about how to construct a prompt that can achieve your goal, see Introduction to prompt engineering, Prompt engineering techniques, and System message framework and template recommendations for Large Language Models(LLMs).
In this document, you learned how to submit a batch run and use a built-in evaluation method to measure the quality of your flow output. You also learned how to view the evaluation result and metrics, and how to start a new round of evaluation with a different method or subset of variants. We hope this document helps you improve your flow performance and achieve your goals with prompt flow.
