Monitor Analysis Services with SQL Server Extended Events
Applies to:  SQL Server Analysis Services
  Azure Analysis Services
  Fabric/Power BI Premium
Extended Events (xEvents) is a light-weight tracing and performance monitoring system that uses very few system resources, making it an ideal tool for diagnosing problems on both production and test servers. It's also highly scalable, configurable, and in SQL Server 2016, easier to use through new built-in tool support. In SQL Server Management Studio (SSMS), on connections to Analysis Services instances, you can configure, run, and monitor a live trace, similar to using SQL Server Profiler. The addition of better tooling should make xEvents a more reasonable replacement for SQL Server Profiler and creates more symmetry in how you diagnose issues in your database engine and Analysis Services workloads.
Besides SQL Server Management Studio, you can also configure SQL Server Analysis Services Extended Event sessions the old way, through XMLA scripting, as was supported in previous releases.
All Analysis Services events can be captured and targeted to specific consumers, as defined in Extended Events.
Use SSMS to configure Analysis Services
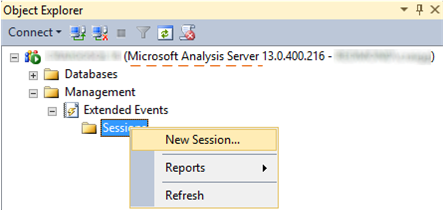
For both tabular and multidimensional instances, SSMS displays a Management folder that contains user-initiated xEvent sessions. You can run multiple sessions at once. However, in the current implementation, the SQL Server Analysis Services Extended Events user interface does not support updating or replaying an existing session.
The Management folder is not supported when using SSMS to connect to a Power BI Premium workspace.

Choose events
If you already know which events you want to capture, searching for them is the easiest way to add them to the trace. Otherwise, the following events are commonly used for monitoring operations:
CommandBegin and CommandEnd.
QueryBegin, QueryEnd, and QuerySubcubeVerbose (shows the entire MDX or DAX query sent to the server), plus ResourceUsage for stats on resources consumed by the query and how many rows are returned.
ProgressReportBegin and ProgressReportEnd (for processing operations).
AuditLogin and AuditLogout (captures the user identity under which a client application connects to Analysis Services).
Choose data storage
A session can be streamed live to a window in Management Studio or persisted to a file for subsequent analysis using Power Query or Excel.
event_file stores session data in an .xel file.
event_stream enables the Watch Live Data option in Management Studio.
ring_buffer stores session data in memory for as long as the server is running. On a server restart, the session data is thrown out
Add event fields
Be sure to configure the session to include event fields so that you can easily see information of interest.
Configure is an option on the far side of the dialog box.

In configuration, on the Event Fields tab, select TextData so that this field appears adjacent to the event, showing return values, including queries that are executing on the server.
After you configure a session for the desired events and data storage, you can click the script button to send your configuration to one of supported destinations including a file, a new query in SQL Server Management Studio, and the clipboard.
Refresh Sessions
Once you create the session, be sure to refresh the Sessions folder in Management Studio to see the session you just created. If you configured an event_stream, you can right-click the session name and choose Watch Live Data to monitor server activity in real time.
XMLA script to start
Extended Event tracing is enabled using a similar XMLA create object script command as shown below:
<Execute ...>
   <Command>
      <Batch ...>
         <Create ...>
            <ObjectDefinition>
               <Trace>
                  <ID>trace_id</ID>
                  <Name>trace_name</Name>
                  <ddl300_300:XEvent>
                     <event_session ...>
                        <event package="AS" name="AS_event">
                           <action package="PACKAGE0" .../>
                        </event>
                        <target package="PACKAGE0" name="asynchronous_file_target">
                           <parameter name="filename" value="data_filename.xel"/>
                           <parameter name="metadatafile" value="metadata_filename.xem"/>
                        </target>
                     </event_session>
                  </ddl300_300:XEvent>
               </Trace>
            </ObjectDefinition>
         </Create>
      </Batch>
   </Command>
   <Properties></Properties>
</Execute>
Where the following elements are to be defined by the user, depending on the tracing needs:
trace_id
Defines the unique identifier for this trace.
trace_name
The name given to this trace; usually a human readable definition of the trace. It is a common practice to use the trace_id value as the name.
AS_event
The Analysis Services event to be exposed. See Analysis Services Trace Events for names of the events.
data_filename
The name of the file that contains the events data. This name is suffixed with a time stamp to avoid data overwriting if the trace is sent over and over.
metadata_filename
The name of the file that contains the events metadata. This name is suffixed with a time stamp to avoid data overwriting if the trace is sent over and over.
XMLA script to stop
To stop the Extended Events tracing object you need to delete that object using a similar XMLA delete object script command as shown below:
<Execute xmlns="urn:schemas-microsoft-com:xml-analysis">
   <Command>
      <Batch ...>
         <Delete ...>
            <Object>
               <TraceID>trace_id</TraceID>
            </Object>
         </Delete>
      </Batch>
   </Command>
   <Properties></Properties>
</Execute>
Where the following elements are to be defined by the user, depending on the tracing needs:
trace_id
Defines the unique identifier for the trace to be deleted.