View the Formula for a Time Series Model (Data Mining)
Applies to:  SQL Server 2019 and earlier Analysis Services
  Azure Analysis Services
  Fabric/Power BI Premium
Important
Data mining was deprecated in SQL Server 2017 Analysis Services and now discontinued in SQL Server 2022 Analysis Services. Documentation is not updated for deprecated and discontinued features. To learn more, see Analysis Services backward compatibility.
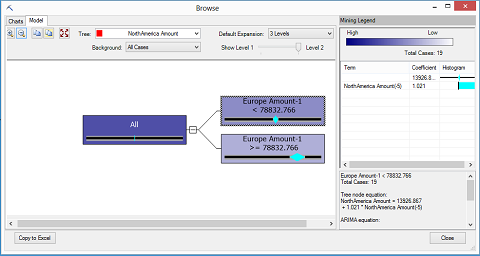
If you created a time series model using SQL Server Data Mining, the easiest way to see the regression equation for the model is to use the Mining Legend of the Microsoft Time Series Viewer, which presents all the constants in a readable format.
To view the ARTXP regression formula for a time series model
In SQL Server Management Studio, select the time series model that you want to view, and click Browse.
-- or --
In SQL Server Data Tools, select the time series model, and then click the Mining Model Viewer tab.
Click the Model tab.
If the model contains multiple trees, select a single tree from the Tree drop-down list.
Note
A model will always have multiple trees if you have more than one data series. However, you will not see as many trees in the Time Series viewer as you will see in the Microsoft Generic Content Tree Viewer. That is because the Time Series viewer combines the ARIMA and ARTXP information for each data series into a single representation.
Click any leaf node in the tree.
Nodes that are labeled as Data Series are always leaf nodes and can contain an equation. If an (All) node has no child nodes, it can also contain an equation.
If the Mining Legend is not available, right-click the node, and select Show Legend.
The ARTXP formula is displayed in the first half of the Mining Legend, as the Tree node equation.

To view the ARIMA formula for a time series model
In SQL Server Management Studio, select the time series model that you want to view, and click Browse.
-- or --
In SQL Server Data Tools, select the time series model, and then click the Mining Model Viewer tab.
Click the Model tab.
If the model contains multiple trees, select a single tree from the Tree drop-down list.
Note
The model will always have multiple trees if you include more than one data series.
Click any node in the tree.
The ARIMA formula is displayed in the second half of the Mining Legend, as the ARIMA equation.
If the Mining Legend is not available, right-click the node, and select Show Legend.
To get the coefficients and terms for the equation
You can also get the terms and coefficients of the regression formula for a time series model by creating a content query on the model content.
For more information, see Time Series Model Query Examples
You can also browse the time series models and find the terms and coefficients by using the Microsoft Generic Content Tree Viewer.
For more information, see Mining Model Content for Time Series Models (Analysis Services - Data Mining).
Note
If you browse the content of a mixed model that uses both the ARIMA and ARTXP models, the two models are in separate trees, joined at the root node representing the model. Even though the ARIMA and ARTXP models are presented in one viewer for convenience, the structures are very different, as are the equations, which cannot be combined or compared. The ARTXP tree is more like a decision tree, whereas the ARIMA tree represents a series of moving averages.
See Also
Mining Model Viewer Tasks and How-tos
Browse a Model Using the Microsoft Time Series Viewer