Inspect your app with IntelliTrace historical debugging in Visual Studio (C#, Visual Basic, C++)
Applies to: ![]() Visual Studio
Visual Studio ![]() Visual Studio for Mac
Visual Studio for Mac
Note
This article applies to Visual Studio 2017. If you're looking for the latest Visual Studio documentation, see Visual Studio documentation. We recommend upgrading to the latest version of Visual Studio. Download it here
You can use historical debugging to move backward and forward through the execution of your application and inspect its state.
You can use IntelliTrace in Visual Studio Enterprise edition but not the Professional or Community editions.
Navigate your code with historical debugging
Let's start with a simple program that has a bug. In a C# console application, add the following code:
static void Main(string[] args)
{
    int testInt = 0;
    int resultInt = AddIterative(testInt);
    Console.WriteLine(resultInt);
}
private static int AddIterative(int j)
{
    for (int i = 0; i < 20; i++)
    {
        j = AddInt(j);
    }
    return j;
}

private static int AddInt(int add)
{
    if (add == 10)
    {
        return add += 25;
    }
    return ++add;
}
We'll assume that the expected value of resultInt after calling AddIterative() is 20 (the result of incrementing testInt 20 times). (We'll also assume that you can't see the bug in AddInt()). But the result is actually 44. How can we find the bug without stepping through AddIterative() 10 times? We can use historical debugging to find the bug faster and more easily. Here's how:
In Tools > Options > IntelliTrace > General, make sure that IntelliTrace is enabled, and select IntelliTrace events and call information. If you do not select this option, you will not be able to see the navigation gutter (as explained below).
Set a breakpoint on the
Console.WriteLine(resultInt);line.Start debugging. The code executes to the breakpoint. In the Locals window, you can see that the value of
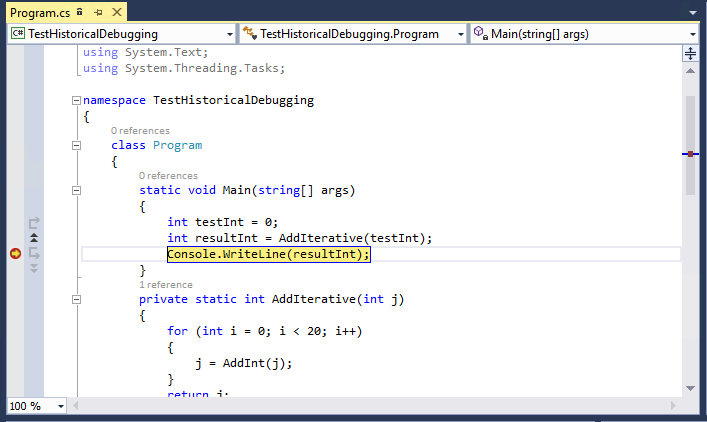
resultIntis 44.Open the Diagnostic Tools window (Debug > Show Diagnostic Tools). The code window should look like this:

You should see a double arrow next to the left margin, just above the breakpoint. This area is called the navigation gutter, and is used for historical debugging. Click the arrow.
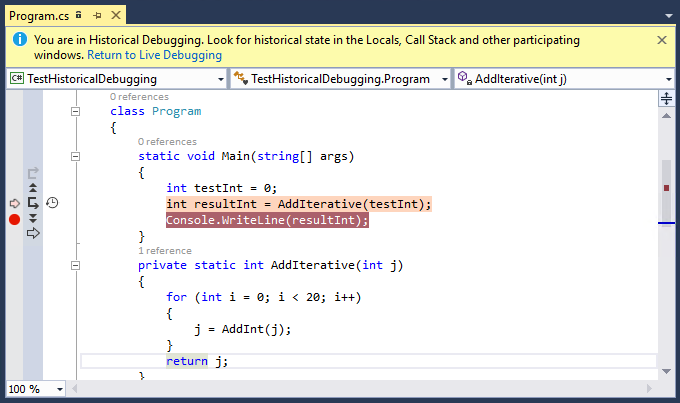
In the code window, you should see that the preceding line of code (
int resultInt = AddIterative(testInt);) is colored pink. Above the window, you should see a message that you are now in historical debugging.The code window now looks like this:

Now you can step into the
AddIterative()method (F11, or the Step Into button in the navigation gutter). Step forward (F10, or Go to Next Call in the navigation gutter). The pink line is now on thej = AddInt(j);line. F10 in this case does not step to the next line of code. Instead, it steps to the next function call. Historical debugging navigates from call to call, and it skips lines of code that do not include a function call.Now step into the
AddInt()method. You should see the bug in this code immediately.
Next steps
This procedure just scratched the surface of what you can do with historical debugging.
- To view snapshots while debugging, see Inspect previous app states using IntelliTrace.
- To find out more about the different settings and the effects of the different buttons in the navigation gutter, see IntelliTrace Features.