Reporting Services reports
TFS 2017 | TFS 2015 | TFS 2013
The SQL Server reporting solution is based on a data warehouse and OLAP cube coupled with a SQL Server Reporting server to host reports.
Important
Integration with the data warehouse and SQL Server Reporting Services is only supported for on-premises Azure DevOps Server versions. If you don't have a reporting site and want to add it, see Add reports to a project.
You can analyze the progress and quality of your project by using the reports in SQL Server Reporting Services. These reports aggregate metrics from work items, version control, test results, and builds. These reports answer questions about the actual state of your project.
Most of these reports provide filters that you can use to specify contents to include in the report. Filters include time period, iteration and area paths, work item types, and work item states. The questions that they answer relate to all types of work items such as user stories, test cases, tasks, and bugs.
Prerequisites
- Your Azure DevOps on-premises deployment must be provisioned with SQL Server Reporting Services. These reports aren't available if your Team Explorer home page doesn't contain a link to Reports.
- Your team project must be provisioned with reports.
- To provision your deployment with Reporting Services or add reports to an existing team project, see Add reports to a team project.
- To view these reports, you must be assigned or belong to a group that has been assigned the Browser or Team Foundation Content Manager role in Reporting Services. For more information, see Grant permissions to view or create reports.
Monitor code quality
Build reports track the quality of software under development. By defining tests to run automatically as part of each build pipeline and instrumenting tests to gather code coverage data, you can gain insight about the quality of the builds, tests, and code.
Build and test activities
- Configure a build system
- Get started with CI/CD
- Run tests in your build process
- (Optional) Rate completed builds to populate the Build Quality dimension.
Build reports
- Build Quality Indicators (Agile and CMMI only)
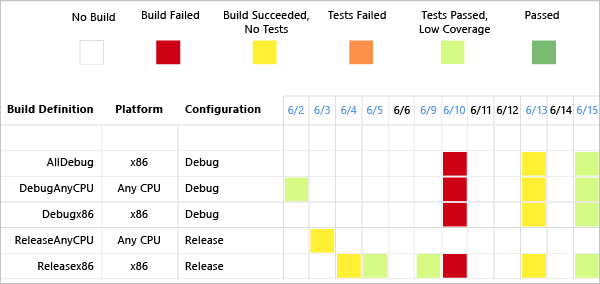
- Build Success Over Time (pictured)
- Build Summary
Sample build success over time report

Monitor progress
Project management reports provide insight into how much work the team is tackling within a sprint or release, and the rate of their progress. By linking work items and updating specific fields as work is carried out, you can track the progress of individual stories and can more accurately estimate future activities.
Work item tracking activities
- Create product backlog items and specify the Effort (Scrum).
- Create user stories and specify the Story Points (Agile).
- Create requirements and specify the Size (CMMI).
- Work in sprints. Assign backlog items to sprints, create tasks and link them to parent backlog items, and assign to a team member.
- Update Remaining Work for tasks. For Agile and CMMI team projects, update Completed Work as well.
Tip
The only report that references Original Estimate is Status on All Iterations.
4. Create test cases and bugs, link them to their parent backlog item, and update their State.
5. (Optional) Assign work items to areas for filtering in reports.
Project management (Scrum) reports
Project management (Agile and CMMI) reports
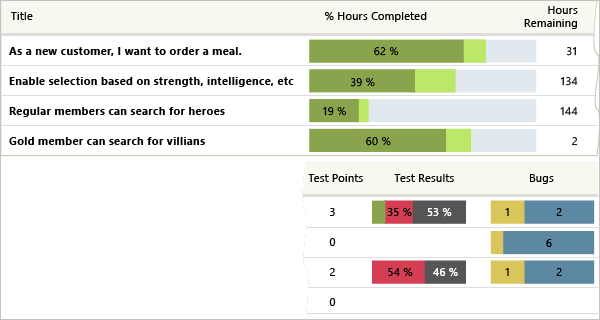
Sample stories overview report

Monitor test plans and bug tracking
Test planning reports support monitoring the test progress and coverage of backlog items or user stories. Bug tracking reports illustrate the team's capacity to find and resolve bugs.
Test planning and bug tracking activities
- Define test plans and test cases, and update their State as work progresses.
- Mark the results of each validation step in manual tests as either passed or failed.
- Create bugs, specify the Priority and Severity, assign to a team member, and update the State.
- (Optional) Assign test cases and bugs to areas and iterations to filter reports.
Bug and test reports
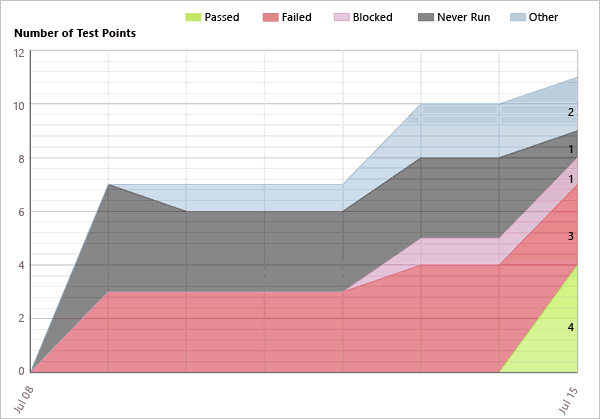
Sample test plan progress report

Open a report
You can open a report from Team Explorer, your team project portal, or any team home page in the web portal.
Open the report site from the Reports page in Team Explorer.

Here's a view of reports for a Scrum project in Report Manager.

Note
If a red X icon appears on the Reports node in Team Explorer, you might not have permissions to access the reports or Team Explorer might have lost communication with the server that hosts SQL Server Reporting Services. In these instances, check with your project administrator to make sure that you have permissions to access the reports node and that the server that hosts Reporting Services is running.
The red X icon might appear on the Reports node if both of the following conditions are true:
- If Team Explorer is running on the same computer as SQL Server Reporting Services
- You are not logged on as the administrator, or enhanced security is enabled for Internet Explorer.
To correct this issue, log onto your computer as an administrator, or open Internet Explorer, open Internet Options, choose the Security tab, and clear the Enabled Protected Mode check box.
Refreshing a report
All data captured for work items is written to the WIT data store, but only select data is written to the Analysis Services data warehouse. The WIT data store is updated in real time as team members create and modify work items. Incremental updates are then written to the relational warehouse database every two minutes and the OLAP cube every two hours. To change these settings, see Change the Data Warehouse Refresh Frequency.
The following table describes how you can refresh the report.
| Option | Result |
|---|---|
| Refresh button on the browser window | Refreshes the display with the report that is stored in the session cache. A session cache is created when a user opens a report. Reporting Services uses browser sessions to maintain a consistent viewing experience when a report is open. |
| Causes the server that is running Reporting Services to rerun the query and update report data if the report runs on-demand. If the report is cached or a snapshot, the report that is stored in the report server database appears. | |
| CTRL+F5 keyboard combination | Produces the same result as choosing Refresh on the report toolbar. |
Manage and work with published reports
You can also carry out the following tasks when you view a report in Reporting Services:
- Zoom in or out of the report.
- Search for text that the report contains.
- Open a related report.
- Export the report to another format such as XML, CSV, PDF, MHTML, Excel, TIFF, or Word.
- Refresh the report.
- Print the report.
- Create a subscription for the report.
Q & A
Q: Do reports handle stories and substories or tasks and subtasks?
A: Yes, you can subdivide stories or backlog items and tasks, creating a nested hierarchy of both backlog items and tasks. You can nest items several levels deep. If you subdivide a task into subtasks, specify hours only for the subtasks. These hours are rolled up as summary values for the parent task and their parent backlog item. To correct reports you believe are in error, see Address inaccuracies published for summary values.
Q: Which reports depend on linking work items?
A: The overview and progress reports depend on linking tasks, test cases, and bugs to backlog items. Link these items using the parent-child link for tasks and bugs and the Tested By link for test cases.
Q: Why isn't code churn and code coverage data appearing in my reports?
A: If you use Git for version control, code churn and code coverage report data aren't available.
Q: Are the reports the same as the charts that appear in the web portal?
A: While some reports do display similar information, such as sprint burndown and velocity or status on all iterations, these reports are formatted differently and support other filters.
Q: How do I create other product areas or release milestones?
A: See Create areas or iterations.
Q: How do I bulk edit work items to assign them to an area, iteration, team member, or priority?
A: See Bulk modify work items.
Q: How do I add a field to track more data?
A: See Add or modify a work item field to support reporting.