Message Summary Lists Viewer
Message Analyzer provides the Message Summary Lists viewer, which is currently a preview feature. If you wish to use the Message Summary Lists viewer, you will need to select its check box on the Features tab of the Options dialog, which is accessible from the global Tools menu, and then restart Message Analyzer. It will then be available for selection in the New Viewer drop-down list on the global Message Analyzer toolbar.
Understanding the Message Summary Lists Viewer
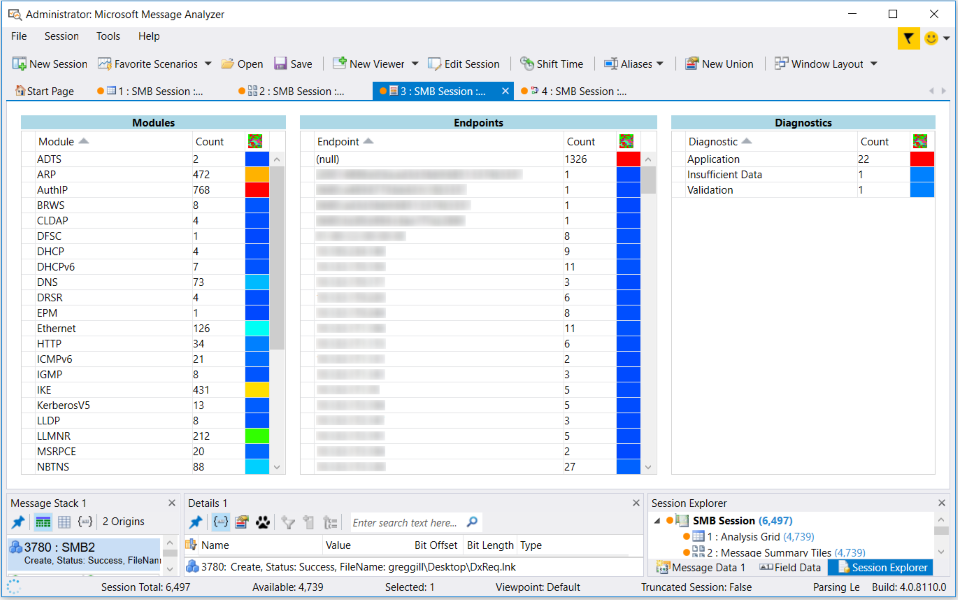
Message Analyzer enables you to use the Message Summary Lists viewer to obtain statistics that reflect key data points across the time line of a set of trace results. These data points provide basic summary information about a trace at-a-glance, as shown in the figure that follows:

Figure 49: Message Summary Lists viewer
Viewing Statistical Summary Data
The statistics data that you can view is organized into three different categories and within each there are three sortable columns of data. The categories for the statistics data that you can observe with this viewer consist of the following:
Note
This viewer does not interactively drive the display of data in any other data viewer or Tool Window.
Modules — displays each Module that supported a message conversation, along with the total message Count for each Module, across the time line of a trace.
Endpoints — the address of each Endpoint associated with a message conversation, along with the total message Count for each Endpoint conversation, across the time line of a trace.
Diagnostics — the total Count of DiagnosisType messages detected in a set of trace results, which includes Application, Validation, Insufficient Data, and Parsing message types.
More Information
To learn more about Diagnosis message types, see the Diagnosis Category topic.
You can sort each column in any of the indicated categories to organize the data display differently, which includes sorting the heatmap column. The heatmap column in each category provides a color-coded visual representation of the message volume in each category, as indicated by the Count column. Higher volumes correspond with the red shades and lower volumes correspond with the blue shades.
Tip
To isolate the data that is associated with any selected row of data in the Modules, Endpoints, or Diagnostics categories of the Message Summary Lists viewer, right-click a data row and select the Open Selected Items command in the context menu that appears. Message Analyzer will then open a new Analysis Grid viewer session tab to display the data associated with the row you selected, for further examination.