Automating analysis of Windows Store crash reports
If you are a developer with applications published in the Windows Store for Windows or Windows Phone, then you have probably come across crash reports. These reports include basic information on the crash and a crash dump file for you to look at. Since this is an unexpected termination of your application, it is imperative to understand why the crash occurred. However, we see quite a few questions come into support with questions on what to do with the triage dump provided in the report. This blog will walk you through how to set up an environment you can run triage dumps through, which may provide actionable results for the developer to fix their application.
Setting up your Analysis Environment
Our environment will use a DebugDiag 2.0 automated crash dump rule to analyze the dumps provided to the developer. The complete source code for this rule is provided as part of this blog. To set up this environment we have to complete the following 3 tasks.
Download and Install DebugDiag 2.0
Download and Install DebugDiag 2.0 from the following location:
https://www.microsoft.com/en-us/download/details.aspx?id=42933
There is an x86 and x64 installer. Choose the version that matches your computers CPU architecture and use the default options.
Install the Debugging Tools for Windows
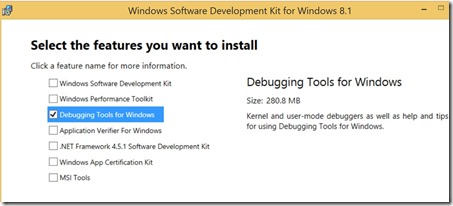
This step is required as the DebugDiag 2.0 script we develop requires a debug extension from the Debugging Tools for Windows installation. To install Debugging Tools for Windows we have to run the Windows SDK Setup and choose the Debugging Tools For Windows option. Start the install by clicking the following link:
During the installer only choose the debugging tools for windows:
This will install the Debugging Tools for Windows to the following locations:
C:\Program Files (x86)\Windows Kits\8.1\Debuggers\x64
C:\Program Files (x86)\Windows Kits\8.x1Debuggers\x86
After the install finishes we have to copy the debugging extensions needed for analyzing dump files to the DebugDiag extensions directory. The following commands can be used to do that.
 copy "C:\Program Files (X86)\Windows Kits\8.1\Debuggers\x64\winext\ext.dll" "C:\Program Files\DebugDiag\Exts\ext.dll"
copy "C:\Program Files (X86)\Windows Kits\8.1\Debuggers\x64\winext\uext.dll" "C:\Program Files\DebugDiag\Exts\uext.dll"
copy "C:\Program Files (X86)\Windows Kits\8.1\Debuggers\x64\winxp\ntsdexts.dll" "C:\Program Files\DebugDiag\Exts\ntsdexts.dll"
copy "C:\Program Files (X86)\Windows Kits\8.1\Debuggers\x64\winxp\exts.dll" "C:\Program Files\DebugDiag\Exts\exts.dll"

copy "C:\Program Files (X86)\Windows Kits\8.1\Debuggers\x86\winext\ext.dll" "C:\Program Files\DebugDiag\x86Support\Exts\ext.dll"
copy "C:\Program Files (X86)\Windows Kits\8.1\Debuggers\x86\winext\uext.dll" "C:\Program Files\DebugDiag\x86Support\Exts\uext.dll"
copy "C:\Program Files (X86)\Windows Kits\8.1\Debuggers\x86\winxp\ntsdexts.dll" "C:\Program Files\DebugDiag\x86Support\Exts\ntsdexts.dll"
copy "C:\Program Files (X86)\Windows Kits\8.1\Debuggers\x86\winxp\exts.dll" "C:\Program Files\DebugDiag\x86Support\Exts\exts.dll"
Installing the Analysis Script
DebugDiag 2.0 introduced the ability to write custom debug analysis rules in C#. Rules written in C# are compiled into managed assemblies. For this blog I have written a DebugDiag 2.0 analysis rule that runs a debugger extension which outputs detailed information about the dump file. The first step is to install the managed assembly containing this rule. For this blog I included the entire DebugDiag 2.0 C# Project used to create the analysis rule as a zip file at the end of the blog. Download this zip file and extract it. Copy the \bin\Release\StoreCrashDataAnalysis.dll to C:\Program Files\DebugDiag\AnalysisRules to install the rule.
Running the Automated Crash Analysis
All of the hard work is done. Yay! Now, anytime you get a report for your Windows Store application that contains a Triage Dump you can do the following to get a simple report with a callstack and possibly additional information to assist you in determining why your application crash occurred.
- First rename the dump file from triagedumpname.hdmp to triagedumpname.dmp. This is so the DebugDiag analysis engine can open it. This will be fixed in future versions of DebugDiag.
- Start the DebugDiag.Analysis.exe from C:\Program Files\DebugDiag\DebugDiag.Analysis.exe
- By default symbols will be set to download from the Microsoft public symbol server. However, you may want to add your symbols to the path DebugDiag uses to load symbols to get better stack information. To do that click the Settings Button in the upper left corner, and configure your symbol paths as shown here:

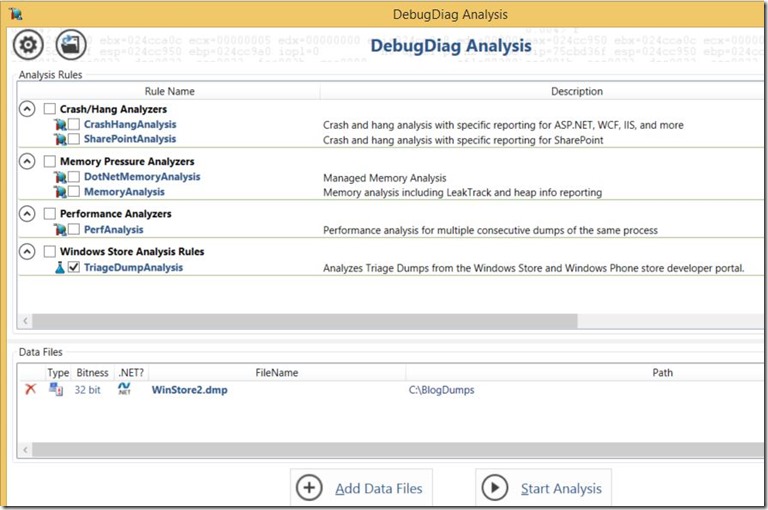
- Click the Add Data Files button and point it to the triagedumpname.dmp.
- Under Analysis Rules you should see a category named “Windows Store Analysis Rules” and one rule named “TriageDumpAnalysis”. Put a check mark next to this rule. The application should look like this:

- Click the Start Analysis button
The analysis will start. The first time an analysis is run may take a while because DebugDiag will download symbols from the Microsoft Public Symbol servers. Once it is complete you should see a report launch in your web browser. If you do not you can go to the following path to look at the report:
My Documents\DebugDiag\Reports
Here is an example of what the report should look like:
 Output of !analyze -v

*******************************************************************************
* *
* Exception Analysis *
* *
*******************************************************************************


FAULTING_IP:
Windows_Networking_BackgroundTransfer!Microsoft::WRL::Details::RuntimeClass00007ff9`f191f1bc f00fc15810 lock xadd dword ptr [rax+10h],ebx

EXCEPTION_RECORD: ffffffffffffffff -- (.exr 0xffffffffffffffff)
ExceptionAddress: 00007ff9f191f1bc (Windows_Networking_BackgroundTransfer!Microsoft::WRL::Details::RuntimeClass > >,Microsoft::WRL::RuntimeClassFlags<1>,1,1,0>::Release+0x0000000000000010)
 ExceptionCode: c0000005 (Access violation)
 ExceptionFlags: 00000000
NumberParameters: 2
 Parameter[0]: 0000000000000001
 Parameter[1]: 0000000000000010
Attempt to write to address 0000000000000010

CONTEXT: 0000000000000000 -- (.cxr 0x0;r)
rax=aaaaaaaaaaaaaaaa rbx=aaaaaaaaaaaaaaaa rcx=aaaaaaaaaaaaaaaa
rdx=0000000000000000 rsi=0000000000000000 rdi=aaaaaaaaaaaaaaaa
rip=00007ffa0af0b13a rsp=0000009fc697d7e8 rbp=0000009fc697fa70
 r8=aaaaaaaaaaaaaaaa r9=0000000000000000 r10=0000000000000040
r11=aaaaaaaaaaaaaaaa r12=0000000000000010 r13=0000009fc697dc00
r14=0000000000000000 r15=0000000000000000
iopl=0 nv up ei pl zr na po nc
cs=0033 ss=002b ds=002b es=002b fs=0053 gs=002b efl=00000246
DBGHELP: >>SymAddrIncludeInlineTrace(F,7ffa0af0b13a,ntdll)
DBGHELP: >>SymAddrIncludeInlineTrace(F,7ffa0af0b13a,ntdll)
ntdll!NtWaitForMultipleObjects+0xa:
00007ffa`0af0b13a c3 ret

DEFAULT_BUCKET_ID: WRONG_SYMBOLS

PROCESS_NAME: 499+1px_WinStore.exe

ERROR_CODE: (NTSTATUS) 0xc0000005 - The instruction at 0x%08lx referenced memory at 0x%08lx. The memory could not be %s.

EXCEPTION_CODE: (NTSTATUS) 0xc0000005 - The instruction at 0x%08lx referenced memory at 0x%08lx. The memory could not be %s.

EXCEPTION_PARAMETER1: 0000000000000001

EXCEPTION_PARAMETER2: 0000000000000010

WRITE_ADDRESS: 0000000000000010

FOLLOWUP_IP:
Windows_Networking_BackgroundTransfer!Microsoft::WRL::Details::RuntimeClass00007ff9`f191f1bc f00fc15810 lock xadd dword ptr [rax+10h],ebx

NTGLOBALFLAG: 0

APP: 499+1px_winstore.exe

ANALYSIS_VERSION: 6.3.9600.17029 (debuggers(dbg).140219-1702) amd64fre

MANAGED_STACK: !dumpstack -EE
OS Thread Id: 0x18b4 (19)
Current frame:
Child-SP RetAddr Caller, Callee

PRIMARY_PROBLEM_CLASS: WRONG_SYMBOLS

BUGCHECK_STR: APPLICATION_FAULT_WRONG_SYMBOLS

LAST_CONTROL_TRANSFER: from 00007ff9f921739c to 00007ff9f191f1bc

STACK_TEXT:
0000009f`c697f040 00007ff9`f921739c : 00000000`00000000 0000009f`c16775c0 aaaaaaaa`aaaaaaaa 00000000`00000000 : Windows_Networking_BackgroundTransfer!Microsoft::WRL::Details::RuntimeClass > >,Microsoft::WRL::RuntimeClassFlags<1>,1,1,0>::Release+0x10
0000009f`c697f070 00000000`00000000 : 0000009f`c16775c0 aaaaaaaa`aaaaaaaa 00000000`00000000 aaaaaaaa`aaaaaaaa : Microsoft_ApplicationInsights+0x9739c


FAULTING_SOURCE_LINE:

FAULTING_SOURCE_FILE:

FAULTING_SOURCE_LINE_NUMBER:

FAULTING_SOURCE_CODE:


SYMBOL_STACK_INDEX: 0

SYMBOL_NAME: windows_networking_backgroundtransfer!Microsoft::WRL::Details::RuntimeClass
FOLLOWUP_NAME: MachineOwner

MODULE_NAME: Windows_Networking_BackgroundTransfer

IMAGE_NAME: Windows.Networking.BackgroundTransfer.dll

DEBUG_FLR_IMAGE_TIMESTAMP: 524fc313

STACK_COMMAND: ~19s; .ecxr ; kb

BUCKET_ID: APPLICATION_FAULT_WRONG_SYMBOLS_windows_networking_backgroundtransfer!Microsoft::WRL::Details::RuntimeClass_Microsoft::WRL::Details::InterfaceList_Windows::Networking::BackgroundTransfer::IBackgroundUploader,Microsoft::WRL::Details::InterfaceList_Windows::Net

FAILURE_BUCKET_ID: WRONG_SYMBOLS_c0000005_Windows.Networking.BackgroundTransfer.dll!Microsoft::WRL::Details::RuntimeClass_Microsoft::WRL::Details::InterfaceList_Windows::Networking::BackgroundTransfer::IBackgroundUploader,Microsoft::WRL::Details::InterfaceList_Windows::Networking::BackgroundTransfer::IBa

ANALYSIS_SOURCE: UM

FAILURE_ID_HASH_STRING: um:wrong_symbols_c0000005_windows.networking.backgroundtransfer.dll!microsoft::wrl::details::runtimeclass_microsoft::wrl::details::interfacelist_windows::networking::backgroundtransfer::ibackgrounduploader,microsoft::wrl::details::interfacelist_windows::networking::backgroundtransfer::iba

FAILURE_ID_HASH: {2cada8ca-e147-99d9-47d5-2f7d1c6c05f8}

Followup: MachineOwner
---------
In this case there are a few key items to look at in the report. The Exception address and the exception code. This means the crash occurred in the following code:
Windows_Networking_BackgroundTransfer!Microsoft::WRL::Details::RuntimeClass 00007ff9`f191f1bc f00fc15810 lock xadd dword ptr [rax+10h],ebx
And the Exception Code is c0000005 (Access Violation) with the indication that it attempted to write to address 00000010.
The first thing that probably comes to a developers mind is, Microsoft’s code is broke. I have worked in support for 16 years, and most of the time, even when the crash occurs in a Microsoft component that is actually not the case. Don’t get me wrong, our code does have bugs and we get those reported as well and work to fix them. I just want folks to keep in mind ,when reviewing these reports, that even though it is failing in a Microsoft component it might be an issue with the way the application is using that component. In the case of this report it was an issue with how the application was using the Background downloader.
Conclusions
This blog is intended to make it easier for application developers to get information from triage dumps provided in the developer dashboard. It is also recommended to read the Windows blog on Understanding and Resolving failures in Windows Store Apps. Until next time, have fun coding!
Don’t forget to follow the Windows Store Developer Solutions team on Twitter @wsdevsol. Comments are welcome, both below and on twitter.
- Bret Bentzinger(Microsoft) @awehellyeah
Comments
Anonymous
July 23, 2014
Thank you for putting this information together. I wanted to share that the first time I tried to run DebugDiag.Analysis.exe, I got an error while trying to load the StoreCrashDataAnalysis.dll. I thought it might be because the DLL needed unblocking but it wasn't that. The error report said that "An attempt was made to load an assembly from a network location which would have caused the assembly to be sandboxed in previous versions of the .NET Framework. This release of the .NET Framework does not enable CAS policy by default, so this load may be dangerous". Rebuilding the StoreCrashDataAnalysis solution on my own computer and re-copying the DLL didn't fix it either. The only solution seemed to be to enable loadFromRemoteSources as described here: blogs.msdn.com/.../more-implicit-uses-of-cas-policy-loadfromremotesources.aspx I'm not sure if there was a cleaner way for me to solve this.Anonymous
February 03, 2015
The comment has been removed
