New support for source-level debugging of WDF code in Windows 10
Last March we published the WDF source code on GitHub for all to read, debug, and learn from. Today we are happy to announce new support for source-level debugging of WDF code! When debugging a WDF driver, you can now step freely into the surrounding framework code to get a full picture of what's going on internally. And all this without ever needing to manually download the WDF source code, or figure out which build and framework version your target system is running. The debugger automatically downloads the correct code from our GitHub repository.
Overview
Suppose you are using WinDbg to debug your WDF driver loaded on a Windows 10 machine, and the debugger is broken-in with framework code in the call stack. You can double-click on the WDF frame in the Call Stack view, and WinDbg will automatically download and open the relevant WDF source file at the matching line, fetched directly from our public Git repo. You can then step through the code, set breakpoints, and see exactly what's happening under the hood.
The following WinDbg screenshot shows the call stack in the lower right corner with a WDF function call circled, and the corresponding source file loaded in the left panel.
This feature supports target systems running public releases of Windows 10, Technical Preview build 10041 or later. These builds have private source indexed symbol files for KMDF (Wdf01000.sys) and UMDF (Wudfx02000.dll) available on the Microsoft Public Symbol Server. Note that source-level debugging of WDF code is currently only available in WinDbg, and not in the Visual Studio debugger.
Quick Start
It is very simple to get started. You need to have a target machine with Windows 10 build 10041 or newer. Start a WinDbg kernel debug session to the target machine, break in, and follow these steps.
1. Set the default symbol path using .symfix. This sets the symbol path to point to the symbol server at https://msdl.microsoft.com/download/symbols.
kd> .symfix
2. Set the default source path using .srcfix. This sets the source path to srv*, which tells the debugger to retrieve source files from locations specified in the target modules' symbol files.
 kd> .srcfix
Source search path is: SRV*
3. Reload symbols using .reload, and confirm that the Wdf01000.sys symbols (or Wudfx02000.dll for UMDF) are source-indexed. As shown in the output of !lmi below, the Wdf01000.sys PDB is source indexed. If yours is not, see the WinDbg Setup section later in this post.
 kd> .reload
...
kd> !lmi wdf01000.sys
Loaded Module Info: [wdf01000.sys]
...
Load Report: private symbols & lines, source indexed
C:\...\Wdf01000.pdb\...\Wdf01000.pdb
4. Now you're all set! An easy way to step through WDF source code is to set a break point on the framework's IRP dispatch routine, and then step through the rest of the code. Since a Windows system has many inbox KMDF drivers, WDF is always loaded and running, so this breakpoint will be hit right away (without needing to load your own driver).
 kd> bp Wdf01000!FxDevice::DispatchWithLock
kd> g
Breakpoint 0 hit
Wdf01000!FxDevice::DispatchWithLock:
87131670 8bff mov edi,edi
If this does not work, check out the WinDbg Setup steps below.
WinDbg Setup
If the above example did not work as expected, you may need to perform one or more of the instructions below.
Enable Source Mode Debugging
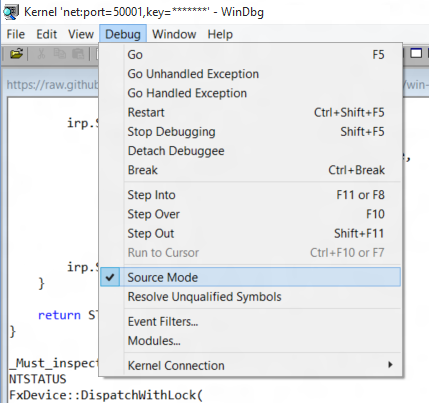
Make sure debugging in Source Mode is enabled. Open the Debug menu and confirm that Source Mode is checked:

Clear Stale Symbols Cache
If you previously debugged WDF drivers for the same Windows target, then you may be using the locally cached WDF symbols that were not source indexed. You can check this with the !lmi command:
 kd> !lmi Wdf01000.sys
Loaded Module Info: [wdf01000.sys]
...
Load Report: private symbols & lines, not source indexed
C:\...\Wdf01000.pdb\...\Wdf01000.pdb
According to the Load Report above, Wdf01000.pdb is not source indexed. This means your local WinDbg symbols cache is stale. To fix this, you will need to unload the PDB from WinDbg, clear the local cache (your path may differ based on the !lmi output above), and finally reload the PDB:
kd> .reload /u Wdf01000.sys
CMD> del
C:\...\Wdf01000.pdb\...\Wdf01000.pdb
kd> .reload Wdf01000.sys
Now run !lmi to check again: the PDB should appear as source indexed and a source code window should pop up.
 kd> !lmi Wdf01000.sys
Loaded Module Info: [wdf01000.sys]
...
Load Report: private symbols & lines, source indexed
C:\...\Wdf01000.pdb\...\Wdf01000.pdb
You can use WDF source-level debugging not just for live debugging and analyzing crash dumps, but also for learning more about the framework internals by setting breakpoints on core functions like the IRP dispatcher and exploring the subsequent code paths. We hope you will find this helpful!
A video that demonstrates this is available here.
- The WDF Team
Comments
- Anonymous
August 24, 2015
Neeto! I was just thinking how it'd be an ongoing hassle to pull down the correct version of the WDF sources to debug, and then I ran across this. Problem solved (and very elegantly too)! Thanks WDF Team!
