Feature Flags Performance Testing
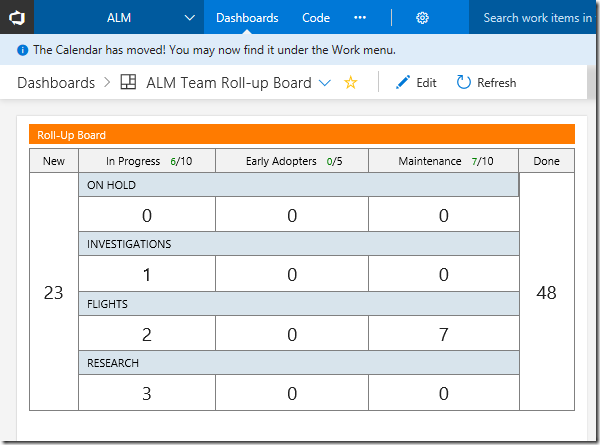
As described in the article Phase the features of your application with feature flags, a Feature Flag is a way to turn features on or off in a solution. The Visual Studio ALM | DevOps Rangers now use a solution from LaunchDarkly for the VSTS and TFS portals. As part of the rollout of this new “feature” <pun intended> the Ranger team wanted to see what impact using the flags would have on one of their VSTS Extensions (specifically the Roll-up board). Below is a screenshot of the Roll-up Board as it appears on our site.
This article describes the planning, execution and reporting for that testing.
AUTHORS – Danny Crone, Geoff Gray
Planning
Normally for any type of performance or load testing, I prefer to do a great deal of planning to ensure that we are testing the right things, fir the right reasons, and gathering the right data, to give the right results. Right? However, for this project, the scope was extremely narrow, and the planning was minimal. We needed to simulate several concurrent users hitting the Roll-up Board BEFORE Feature Flags were enabled, and AFTER Feature Flags were enabled. We were given a couple of VSTS accounts to use against our own dashboard, and we decided upon the following use case:
- [Webtest]:
- User logs into the Rangers VSTS subscription, then displays the Roll-up Board.
- Datasource with login information. Two different user accounts added to datasource
- [Loadtest]:
- Load Profile: “Based on Number of Tests Started”
- Constant User Load: 20
- Run Settings: “Use Test Iterations” = true; 500 Iterations
The webtests were stripped down to the base set of calls that were necessary for our purposes and then cleaned up as follows (we had a few hurdles to tackle while building the tests, which will be covered in a future article):
- VSTS (and many other sites) are very chatty, so we needed to remove “off-box” calls.
- We broke the requests into transaction timers to group each user action into a set of requests.
- We added a number of extraction rules to allow the tests to work properly.
- We added a conditional rule to allow the webtest to execute with both “Federated” and “Managed” user accounts.
- We finally added a number of “Reporting Names” to the requests to make it easier to find and analyze the results. I used a “0_” prefix for all wiql query calls, describing what the basic query structure was. I used a “1_” prefix for all other calls (like login, landing page, etc.) that I wanted to use for reporting. By adding these, I could easily sort the response times in my reports.
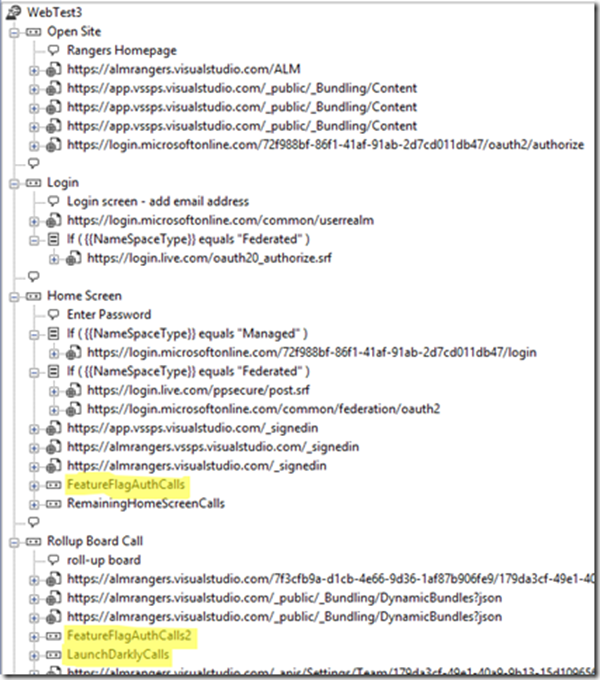
Once the webtest worked reliably, we executed the load test and gathered the results. We did have to modify the webtest after the Feature Flags were enabled since there are extra calls made when using Feature Flags. Below is a screenshot of part the webtest. The calls highlighted in yellow are the transactions that got added when Feature Flags were enabled:
Preparing for CLT
In order to get the tests working with a CLT rig we need to make a few tweaks, first of all, we knew we couldn't use the hosted agents as we needed to prep the agent machines so that they would be authorized to login to VSTS. So we created an Azure machine using the quick start template vsts-cloudloadtest-rig which does a lot of the heavy lifting for you in terms of registering the agent with your VSTS account. This allowed us to remote into the Azure machine and authenticate with VSTS using both of the users in the datasource. Next we modified the Loadtest so that it knows to target CLT but use our agent instead of hosted, so we needed two context parameters:
UseStaticLoadAgents : set to true to use private agents
StaticAgentsGroupName : set to the name that we provided as a parameter to the Azure template “AgentGroupName”
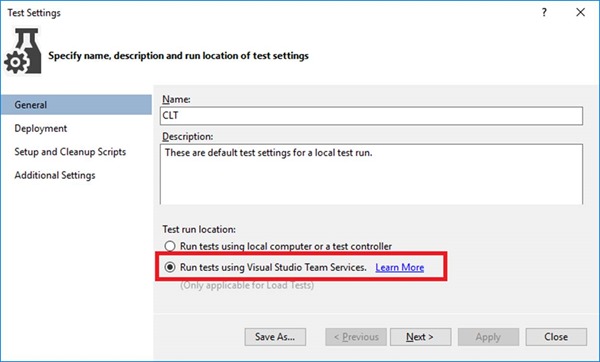
Last thing to do is to ensure that we have a “.testsettings” that tells Visual Studio to push the Loadtest to CLT:
Oh and don’t forget the pre-submit checklist, make sure to set the active test settings to the correct “.testsettings” file:
Execution
The load test was executed three separate times for each phase (BEFORE/AFTER):
- Local execution from a residential Internet connection.
- Local execution from a corporate Internet connection.
- Online execution from a CLT rig.
Before
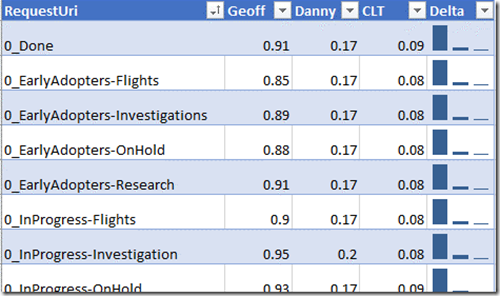
After the three runs were completed for the “BEFORE” testing, we imported the test results to a single Load Test Results Database and then built the reports. Below is a partial result set for the runs (the times are in seconds). It shows how choosing different environments for the test execution can have a huge impact on the results:
Based on these results, I should be looking for a new service provider for my Internet (which I already knew). It also shows that CLT is also significantly faster than Danny’s connection. NOTE: This is a great example of how external environments can have a huge impact on the results you get from executing tests.
After
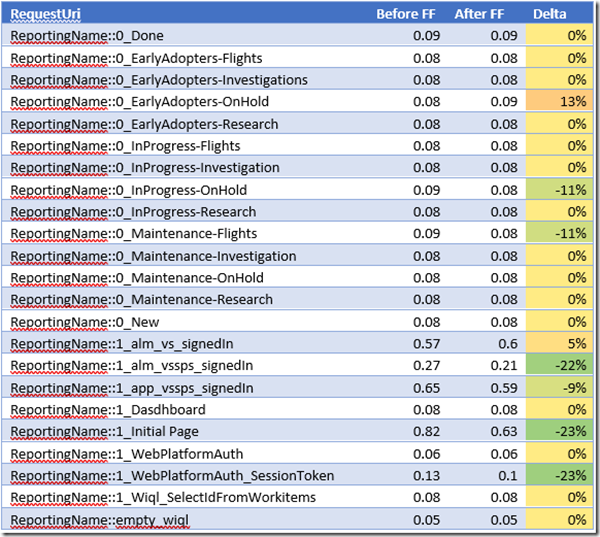
We ran the tests again once the Feature Flags were enabled. There was about a 10-day window between the BEFORE and AFTER runs because of schedule conflicts. The delay in these runs is the reason for the third table (Individual Response Times for all calls) being included in the reporting (below)
Reporting and Results
To generate the final results and build a report that showed the impact of enabling feature flags, I decided to use three different tables. Each one showed a different view of the data that helped understand the impact. Below are the three tables as well as an explanation of how each was created and what it indicates:
Transaction Timer for the Roll-up Board Comparison
This table shows the overall performance of clicking on the “Roll-up Board” from an end-user perspective. This is the most important table because it shows what the user experiences.
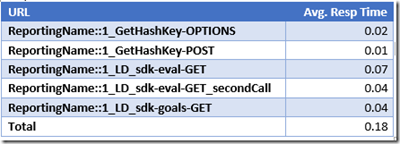
Individual Response Times for the New Calls
This table shows a list of the calls that were added to the test (in order to mimic the calls made by Feature Flags). All other calls in the test remained unchanged. The value of this table is to provide the developers of the product some insight into how well their specific calls performed.
Individual Response Times for all calls
This table is used to see how much difference there was between the two runs for calls that did not change . (It is not meant to demonstrate the performance as much as it was meant to show how variances can happen over time even while running the same requests due to environments, network, etc.) . This is useful to understand the impact that the environment and test rig may have on the results. This also let us verify that the main application’s behavior and performance had not changed significantly since we had a 10 day wait between the test runs. You will see that a couple of the calls had a bit of variance, but it was not significant enough for us to worry about the overall results, especially since the longest calls with the variance are login and landing pages.
Comments
- Anonymous
December 08, 2017
Great fun working on this with Geoff, now to put the CLT perf test into the pipeline!
![clip_image001[1] clip_image001[1]](https://msdntnarchive.z22.web.core.windows.net/media/2017/12/clip_image0011_thumb1.png)
![clip_image004[1] clip_image004[1]](https://msdntnarchive.z22.web.core.windows.net/media/2017/12/clip_image0041_thumb.png)
