Tuning a Parallel Ray Tracer in F#
One of the samples that is included with the Parallel Programming Samples for .NET 4 is a simple Ray Tracer. This ray tracer provides a nice visual way of seeing the benefits of .NET 4 parallelism features, as well as giving insights into the way work stealing happens under the hood.
The Problem
This ray tracer sample is available in C#, VB and F# versions, all of which were expected to behave and perform essentially the same.
Last November though, a post on the Parallel Computing Forums pointed out an interesting performance difference between the C# and F# implementations of the ray tracer. Quoting from the post:
I was playing with "Samples for Parallel Programming with the .NET Framework 4” and just tested the release version of Raytracer_CSharp and Raytracer_FSharp. The speed of both were the same in single threaded mode and interestingly the memory usage of F# version was less than the C# version. But when I switched to parallel mode, the C# version was faster than the F# version. I had a look at the CPU consumption and found out that the C# version was consuming 92% to 96% of CPU time while the F# version about 82% to 87%. Any explanation for this behavior?
Trying it out myself, I saw exactly the same thing – the F# version ran roughly as fast and used less memory when run on a single core, but slower and not at full CPU capacity when run in parallel using multiple cores.
Investigation
I spent some time looking into the parts of the code that were intentionally different, such as the use of F# async instead of explicit cancellation checking, but couldn’t see anything that would obviously cause a difference.
So I tried out the Concurrency Visualizer to try to understand the differences in the performance profiles of the two implementations. Fundamentally, they ought to be doing the same work – so I was surprised to see these very different results.
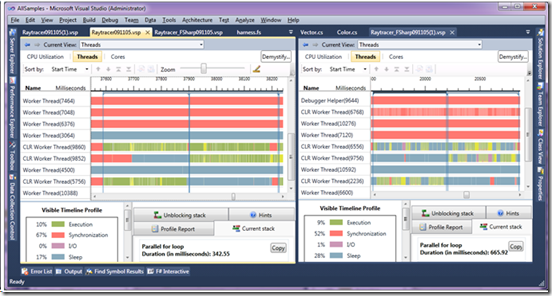
Here’s what the profile showed for the rendering of two scan-lines in each of the implementations. In the screenshot – the C# implementation is shown on the left, and the F# implementation on the right.
I noticed that in the C# trace, there is near pure green (execution time) on two threads. Different pairs of CLR Worker Threads are used on different iterations, but there appears to nearly always be CPU work being done on two threads at once.
In contrast, the F# trace shows two active threads on each iteration – but they both appear to be sleeping intermittently! The traces give a per-iteration view of the global observation from the forums post that the F# version was running slower and not fully utilizing the CPU.
So – curious why the F# code was going to sleep, I clicked around on various sleep blocks amongst the execution periods of the worker threads. And what did it show:
Category = Sleep
Subcategory = Sleep or Yield
Delay = 35.6818 ms
ntoskrnl.exe!SwapContext_PatchXRstor
ntoskrnl.exe!KiSwapContext
ntoskrnl.exe!NtYieldExecution
ntoskrnl.exe!KiSystemServiceCopyEnd
ntdll.dll!ZwYieldExecution
kernelbase.dll!SwitchToThread
clr.dll!__DangerousSwitchToThread
clr.dll!WKS::gc_heap::try_allocate_more_space
clr.dll!FastAllocateObject
clr.dll!JIT_NewFast
raytracer_fsharp.exe!Raytracer_FSharp.Vector.op_Subtraction
Almost all of the sleeps looked like this. Each had some Color or Vector operation at the bottom of the stack, followed by a CLR allocation. Stack frames like this didn’t appear anywhere in the C# trace.
These functions are very simple – so this immediately narrowed it down. In C#:
return new Vector(v1.X - v2.X, v1.Y - v2.Y, v1.Z - v2.Z);
Looking at the C# code for the Vector class immediately pointed out the difference. In the C# code, Vector was a struct.
struct Vector
{
public double X;
public double Y;
public double Z;
...
}
As was clear from the stacks in the pause blocks in the profiler, the F# code defined Vector as a class, and was pausing during memory allocation – most likely because of a GC. Changing the F# code to use structs and re-running, we saw similar profiles in the C# and F# implementations. We ultimately found a couple of other differences, and the combination of using structs and these changes resulted in similar performance of the two implementations.
Conclusion
The concurrency profiler provided a simple way of visualizing the different performance profiles of the two implementations, and looking at call stacks around the points where there was synchronization pointed quickly to the difference between the two implementations – the use of a struct vs. a class for one of the core datatypes.
Luke Hoban – Visual Studio Managed Languages
Comments
Anonymous
October 03, 2010
Do you have the list of other changes that you made in F# version to perform it like C# version in parallel mode?Anonymous
April 18, 2013
Thanks

