Parallel Performance Case Study: Finding References to Parallel Extensions
Stephen Toub Parallel Computing Platform
Visual Studio 2010 is quite a large application, comprising not only the entire integrated development environment (IDE) and all of the tools that make it up, but also the underlying runtimes and frameworks on which it runs, including the .NET Framework 4. When logic in one of these constituent components requires some new functionality, a good developer’s first instinct is to examine the underlying frameworks to see whether the required functionality has already been encapsulated somewhere, so as to enable reuse rather than rebuild. In this manner, with Parallel Extensions (including the Task Parallel Library, Parallel LINQ, new coordination and synchronization data structures, etc.) being part of the base class libraries in the .NET Framework, we’ve seen adoption of these new types throughout Visual Studio, often in places we hadn’t anticipated. It’s been beneficial for us to thus repeatedly examine the libraries that make up Visual Studio and the .NET Framework in order to root out this adoption.
To assist with this, I wrote a small tool that utilizes the Common Compiler Infrastructure (CCI) to parse through a large swath of Visual Studio’s DLLs, looking for particular kinds of references to our types. Visual Studio 2010 includes the FxCop tool, which internally utilizes the initial version of CCI. To get started, my tool utilized those same libraries. (It should be noted that the libraries referenced by this quick-and-dirty tool are part of the Visual Studio 2010 installation and were not designed to be used outside of the FxCop environment. The libraries are also not redistributable.)
Here is the core of the logic that makes up this tool’s Main method:
var dllPaths = DLL_DIRECTORIES.SelectMany(
dirPath => Directory.GetFiles(dirPath, "*.dll", SearchOption.AllDirectories));
foreach (Tuple<string,Tuple<string,string>[]> result in
dllPaths.
Select(dllPath => ProcessAssembly.Run(dllPath)))
{
// Display the assembly path. Then, for each usage,
// display the caller and the callee.
Console.WriteLine(result.Item1);
foreach (var item in result.Item2)
{
var output = item.Item1 + "\t" + item.Item2;
Console.WriteLine(output);
}
}
A user-supplied set of directory paths serves as the input to the above code. In my case, the directories are specified to include the root directory for the Visual Studio install, the .NET Framework folder containing all of the .NET 4 assemblies, and the F# installation point:
public static IEnumerable<string> DLL_DIRECTORIES = new string[] {
@"C:\Windows\Microsoft.NET\Framework\v4.0.21006",
@"C:\Program Files (x86)\Microsoft Visual Studio 10.0\",
@"C:\Program Files (x86)\Microsoft F#\v4.0"
};
Those paths are enumerated, searching for any DLLs that exist within those directories recursively. For each DLL found, my ProcessAssembly.Run method is used to attempt to load that DLL as a managed assembly, iterating through all of its methods looking for calls to members of a specific set of types, namely those that make up Parallel Extensions. The core logic of ProcessAssembly.Run is shown here:
var assemblyNode = LoadAssemblyNode(dllPath);
if (assemblyNode == null) return new Tuple<string, string>[0];
// Look at all call sites in every method in the target assembly.
// For each site, if the callee is one of the target types, store
// and return the caller and the callee.
return (from caller in IterateAllMethods(assemblyNode)
from callee in (caller.Instructions
.Where(i => i.OpCode == OpCode.Call ||
i.OpCode == OpCode.Callvirt ||
i.OpCode == OpCode.Newobj)
.Select(i => GetRootMethod((Method)i.Value).DeclaringType)
.Where(t => TARGET_TYPES.Contains(t))
.Distinct())
select Tuple.Create(caller.FullName, callee.Name.Name)).ToArray();
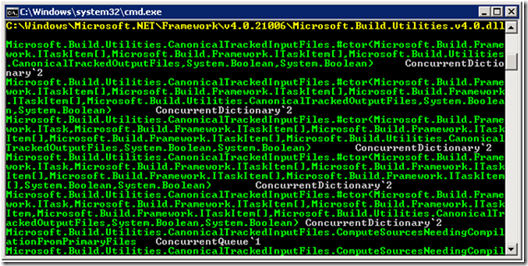
With all of this code in place, we’re able to run the tool to observe the expected output:
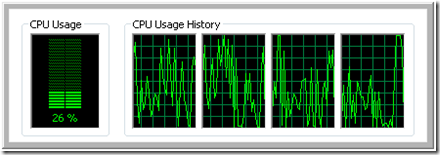
Looking at the Windows Task Manager during a run, I observed that this sequential implementation is CPU-bound, consuming approximately 25% of the available CPU on this 4-core machine:
As the processing of each DLL is theoretically entirely independent, it stands to reason that we should be able to process DLLs in parallel. This could dramatically improve processing time, especially when you consider that with the directories we were interested in examining, there were over 1300 DLLs to be processed. Looking back to the core code from our Main method shown previously, we can see the processing is all being done inside of a LINQ query over all the available DLLs, projecting a result for each:
foreach (Tuple<string,Tuple<string,string>[]> result in
dllPaths.
Select(dllPath => ProcessAssembly.Run(dllPath)))
As such, we can take advantage of Parallel LINQ (PLINQ), to enable parallelization with just one additional line of code (at least in theory… we’ll see shortly why this parenthetical clarification is necessary):
foreach (Tuple<string,Tuple<string,string>[]> result in
dllPaths.
AsParallel().WithMergeOptions(ParallelMergeOptions.NotBuffered).
Select(dllPath => ProcessAssembly.Run(dllPath)))
The call to AsParallel() enables parallelization for the rest of the query. The call to WithMergeOptions is purely optional: this invocation tells PLINQ to output results as soon as they’re available rather than the default action of partial buffering of output. Buffering output can improve performance by minimizing synchronization costs between threads, but it can also hamper an interactive experience by increasing the latency before a user sees each batch of output; as such, in order to see results in the console as soon as they’re available, I’ve told PLINQ not to do output buffering.
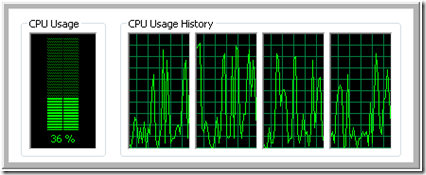
Excited to see the performance improvements that PLINQ should bring to bear, I ran the query again, expecting to see significantly better CPU utilization on my pretty quad-core box. Instead, I saw the following:
The increase is nowhere near what we might expect from parallelization on such a machine. Moreover, Task Manager shows us CPU utilization, but it doesn’t split apart how much of that utilization is actually work that makes forward progress in the application, and how much of it is overhead, such as costs associated with taking and releasing locks. In fact, even though there was an almost 50% increase in CPU utilization, there was only a 2% performance improvement observed from timing the actual execution.
Using Visual Studio To Find The Problem(s)
The Concurrency Visualizer within the Visual Studio 2010 profiler is quite valuable in debugging these kinds of parallel performance problems. I profiled the tool’s parallelized execution in order to see what issues we might be able to spot. In the resulting trace, I examined the Threads view and sorted by Execution:
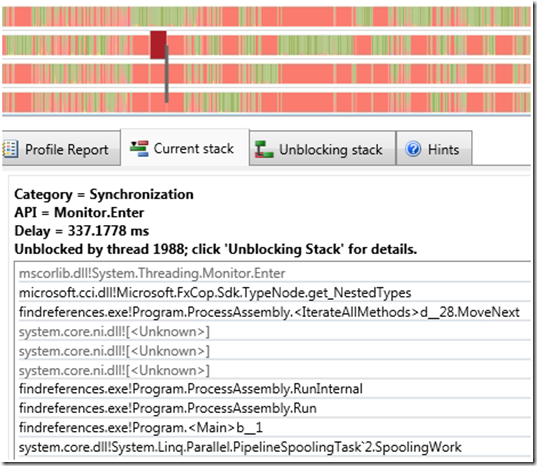
First, we can see all of PLINQ’s four processing threads at the top of the trace, as these threads represented the bulk of the processing being done in parallel on this quad-core machine. However, we also immediately notice a lot of red. Red regions in the profiler trace represent blocking, times in a thread’s lifetime when it was waiting for a synchronization primitive to become available. By clicking on red regions in the trace, we quickly get an understanding for why the application is spending so much time blocked:
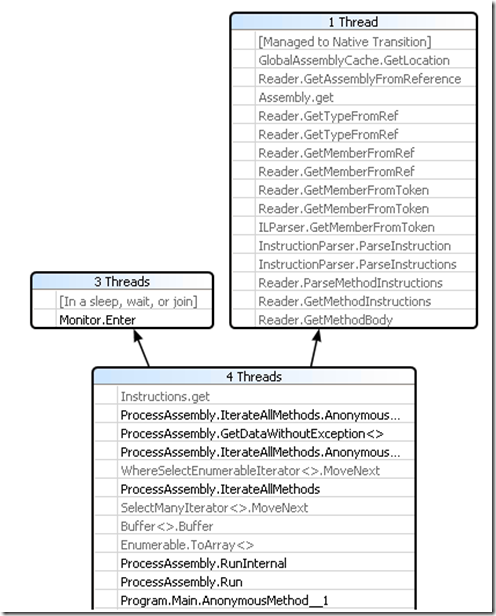
Wherever we click on red in the trace, we invariably see a stack that looks almost identical to this. As it turns out, the Instructions property on the Method type (which we’re using in the LINQ query shown earlier) takes a lock, which the library uses to protect access to shared data structures used to cache frequently-used information. This is obviously causing a scalability problem for our parallelized tool, as the ThreadPool threads utilized by PLINQ are spending most of their time blocked on this particular lock. Note that this is also easily spotted at runtime using the new Parallel Stacks window in the Visual Studio 2010 debugger; rerunning the application, I broke into the debugger after a few seconds and was presented with the following Parallel Stacks visualization, demonstrating that three of the four threads are blocking on the aforementioned lock:
At the same point, the Parallel Tasks window is able to summarize the state of affairs, and even show me the exact object being waited on and who holds it:
The lock is not our primary issue, however. There’s a more fundamental problem with our tool, which is only exacerbated by using parallelization. This issue can be seen at a glance in Task Manager after running the tool for a minute:
We’re loading hundreds of DLLs, and iterating through every instruction in every method in every type in every DLL. As mentioned, the FxCop libraries are caching data, which is leading to a continued growth in memory utilization. Eventually, our process starts throwing out-of-memory exceptions. Timing our program in order to determine parallel speedups is thus not relevant at this point, as our program is in effect incorrect; before we can really parallelize and measure the speedup, we need to address the application’s memory problems.
As it turns out, however, one solution can be applied to address both of the aforementioned problems. That solution is use to AppDomains. As discussed in the MSDN documentation, application domains “help provide isolation, unloading, and security boundaries for executing managed code”. This assists us in two ways. First, we can unload an AppDomain in which we were processing an assembly using the CCI; all of the caching done by Microsoft.Cci.dll will be contained within that AppDomain, and thus by unloading it, we’re also allowing the garbage collector to reclaim the memory utilized by the caches. Second, with a few unfortunate exceptions (see this blog post for more details), Monitor locks are isolated to a single AppDomain, and thus the “global lock” employed by the FxCop library is an AppDomain-wide lock rather than a process-wide lock. Given this, by doing the processing for each DLL in its own AppDomain, we avoid the scalability impact of the lock (in doing so, however, we’re also trading off some efficiency, as the cache will in effect be emptied for each new DLL being processed; we also have to pay the overheads of spinning up and tearing down a new AppDomain for every DLL).
To switch to doing the processing of each DLL in its own AppDomain, a few steps are necessary. First, we modify the ProcessAssembly class to derive from MarshalByRefObject:
private class ProcessAssembly : MarshalByRefObject
This enables us instantiate the class in another AppDomain, and then utilize a proxy in the primary AppDomain to target that remote instance (managed by the .NET remoting infrastructure). We extract all of the logic in our original ProcessAssembly.Run method into a RunInternal method, and then rewrite Run as follows:
public static Tuple<string, Tuple<string, string>[]> Run(string dllPath)
{
var ad = AppDomain.CreateDomain(dllPath);
try
{
//var pa = new ProcessAssembly();
var pa = (ProcessAssembly)ad.CreateInstanceFrom(
typeof(ProcessAssembly).Assembly.Location,
typeof(ProcessAssembly).FullName).Unwrap();
var callersCallees = pa.RunInternal(dllPath);
return Tuple.Create(dllPath, callersCallees);
}
finally { AppDomain.Unload(ad); }
}
Now when we call Run, a new AppDomain will be spun up, an instance of ProcessAssembly will be created in that domain, we invoke the RunInternal method on the remote instance, having its results marshaled back in the resulting Tuple, and we return the results.
Unfortunately, upon running the application again, CPU utilization has remained at the low rate previously seen. Again, we run the profiler:
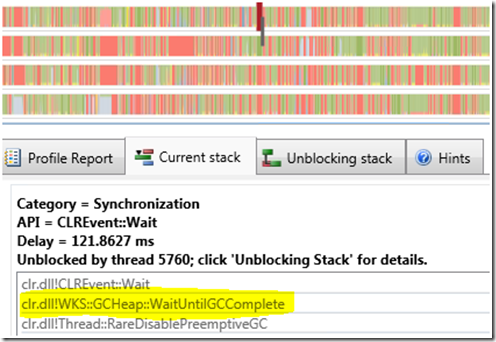
While still heavily red, the trace looks a bit different this time. Zooming in on several blocked regions, we see that the common call stack has morphed:
Now, we’re spending most of our time waiting for garbage collections to complete. Lots of objects are being created, cached, promoted to higher GC generations, and then allowed to be collected, resulting in a lot of garbage for the collector to deal with. The default garbage collector for non-server workloads in .NET 4 is the background GC, which is not ideal for parallel workloads. Instead, we can switch to using the server flavor of the GC; this should help not only to decrease collection times, but it will also result in cheaper allocations due to decreased synchronization between threads performing allocations. Enabling the server GC can be done with a configuration file:
<?xml version="1.0" encoding="utf-8" ?>
<configuration>
<runtime>
<gcServer enabled="true"/>
</runtime>
</configuration>
Rerunning the profiler on our application utilizing the server GC generates a trace that shows an improvement:
While there are still some significant red regions, the trace is much greener than it was before. With the server GC enabled, we can also look at the dedicated GC threads and see that most of the times our worker threads were red, the GC threads were generally doing processing.
With our new found approach of utilizing AppDomains in order to avoid running out of memory and minimizing the impact of a process-wide lock, we can time our sequential and parallel solutions. To do so, I’ll limit this to processing the first 100 DLLs from the list. Running the sequential implementation to process the first 100 DLLs consumed 49.69 seconds, and running the PLINQ version consumed 20.7 seconds. That’s a 2.4x speedup on a quad-core; compare that to the 1.02x speedup observed initially, and it’s a marked improvement.
Even with our improvements in parallel speedup, however, we’re still very much limited by the support provided by the core library on which this tool relies. Not only is that library not meant to be used in this manner (it’s a DLL meant only for use by FxCop), it still has two fundamental issues for this tool’s purpose: it’s caching everything, and it’s locking aggressively. To make additional forward progress, we really need a different core library on which to rely.
A completely revamped version of the Common Compiler Infrastructure (CCI) is available as open source on Codeplex at https://ccimetadata.codeplex.com/. Utilizing this project is better for several reasons. First, it’s meant to be used outside of FxCop. Second, it enables much more fine-grained control over how data is cached, which means our tool can exhibit better memory behavior. Third, while it still takes a fairly course-grained lock for certain operations, that lock isn’t nearly the scalability bottleneck that its ancestor was in Microsoft.Cci.dll. Fourth, as an open source library, we now have the ability to modify aspects of the library to better suit our needs. And last, but certainly not least, it exhibits significantly better performance than the aforementioned library, even for serial usage… my sequential version with the new library is able to process all 1300+ of the target DLLs in just over 30 seconds.
Here’s the core processing method of the new version. This has dependencies on the Microsoft.Cci.MetadataHelper.dll, Microsoft.Cci.MetadataModel.dll, and Microsoft.Cci.PeReader.dll assemblies from the Codeplex project:
private Tuple<string, Tuple<string, string>[]> ProcessDllInternal(string dllPath)
{
var assembly = new HostEnvironment().LoadUnitFrom(dllPath) as IAssembly;
if (assembly == null)
return Tuple.Create(dllPath, new Tuple<string, string>[0]);
var callersCallees =
(from caller in assembly.GetAllTypes().SelectMany(t => t.Methods)
from callee in (caller.Body.Operations
.Where(i => i.OperationCode == OperationCode.Call ||
i.OperationCode == OperationCode.Callvirt ||
i.OperationCode == OperationCode.Newobj)
.Select(i => {
var imr = i.Value is ISpecializedMethodReference ?
((ISpecializedMethodReference)i.Value).
UnspecializedVersion :
(IMethodReference)i.Value;
var ct = imr.ContainingType.ToString();
foreach (string s in Inputs.TARGET_TYPES)
if (s == ct) return s;
return null;
})
.Where(t => t != null))
.Distinct()
select Tuple.Create(caller.ToString(), callee.ToString())).ToArray();
return Tuple.Create(dllPath, callersCallees);
}
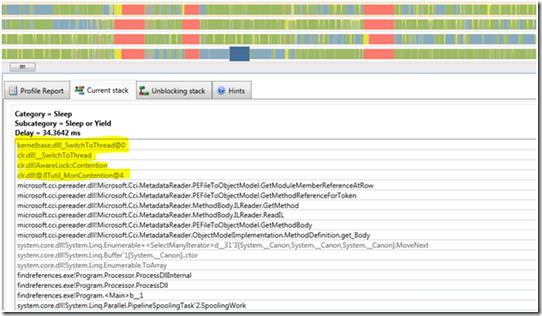
We can still take our learnings from the initial Microsoft.Cci.dll version and apply them here. A trace from the new version demonstrates that there’s a lock causing some significant slowdowns, even across HostEnvironment instances (note the fair amount of blue in this trace, which represents Sleep or Yield; monitor locks in .NET use some amount of spinning and yield prior to truly blocking, and as such times when a thread is stuck in synchronization may actually show up as blue… it could even show up as green if the thread was actively spinning):
With the new version we’re creating a HostEnvironment per DLL, and that HostEnvironment is where data gets cached, so our AppDomain solution for addressing caching is unnecessary for this purpose. The AppDomain solution will, however, still help with the lock. Since caching is no longer an issue, we simply want to maintain one AppDomain per thread that will be involved in the PLINQ processing, and we can do that using the ThreadLocal<T> type that’s new to .NET 4. ThreadLocal<T> will ensure that every thread accessing its Value property will have an initialization routine run to initialize that thread’s local copy, and that initialization routine can create the domain and return a proxy for a remote object created in the domain:
private static ThreadLocal<Processor> _processor =
new ThreadLocal<Processor>(() =>
{
//return new Processor();
var ad = AppDomain.CreateDomain(“”);
return (Processor)ad.CreateInstanceFrom(
typeof(Processor).Assembly.Location, typeof(Processor).FullName).Unwrap();
});
(Note that this tool shuts down as soon as the PLINQ query is completed, and thus I don’t bother to unload each of the AppDomains at the end of the program. If you needed to, however, the ReductionVariable<T> sample in the Parallel Extensions Extras project on Code Gallery is built on top of ThreadLocal<T> and provides a Values property that allows you to iterate from any thread through all of the thread-local values; this would enable you to easily find and unload all of the domains.)
With this addition in place, the parallelized tool achieves a speedup of approximately 3x over the revised sequential implementation. Note, however, that this tool doesn’t scale very well. While achieving 3x on a quad-core machine, on an 8-core machine it only achieved approximately 3.5x. This is due largely to I/O limitations, as the tool is reading and processing through almost a gigabyte of library files.
