Beginner's Guide to Profiling Parallel Apps Part I
Hello world! This is the first of four "beginner's guide" installments. Though individiuals more familiar with concurrency issues may find it easier to get started with our tools, my team and I are interested in making it easier for a broader range of developers to quickly get started with concurrency visualization.
This first post will highlight the basics: how to use the Performance Wizard to profile a mutlithreaded application built within Visual Studio. The next three installments will dig in to the basics of the Concurrency Visualizer. Let's get started!
I won't focus on the details of my app but it's worth mentioning that I parallelize my code by manually creating four threads (equal to the number of cores on my machine) and I have each thread operate on one fourth of the problem. To be sure that this actually executes in parallel, I want to profile my solution.
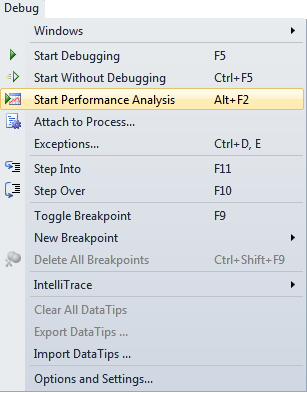
To do this, I start Visual Studio as an administrator. This is necessary because the Concurrency Visualizer enables kernel-level logging, which requires administrator privileges due to the low-level information exposed. Though there are two ways to get to the Concurrency Visualizer, I will describe how to access it via the Debug Menu (see my screencast for the other way). Once I have my solution ready to run, I click "Start Performance Analysis" under the Debug Menu.
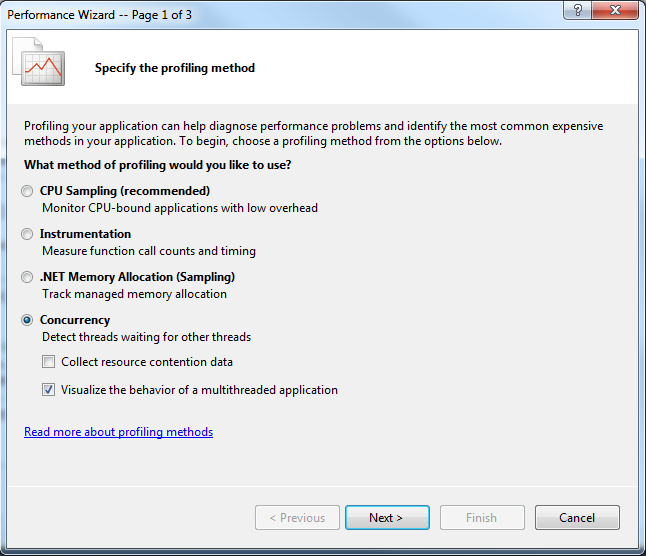
When prompted for a profiling method, I select "Concurrency" and check the box that says "Visualize the behavior of a multithreaded application".
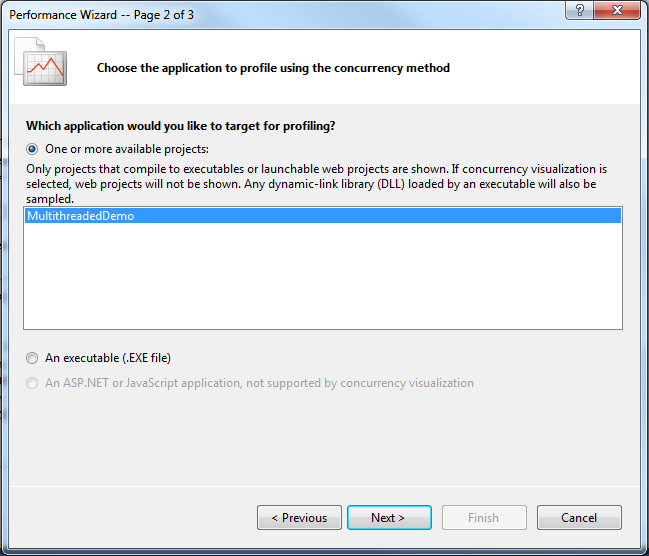
I then click "next" and get to the page shown below. Though I have the option of profiling an executable, I want to profile the solution I currently have open in Visual Studio. By default, my solution is highlighted so I just click "next".
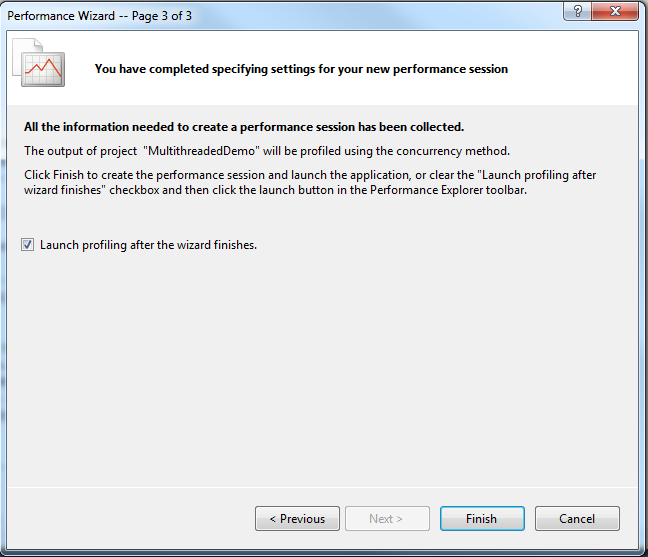
The last page in the wizard asks if I want to launch profiling after the wizard finishes. By default, this box is checked because users will most often want to do this. This is exactly what I want to do so I simply click "finish".
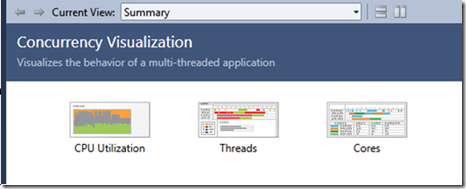
After waiting for a few seconds for the analysis to complete, I am presented with the summary report:
The summary report varies depending on the selected profiling options. In this case, the summary report presents me with three options. Each of these gives you a different way of viewing the multithreaded behavior of your application. I will give a more detailed overview of each of these three options in the following posts.
James Rapp - Parallel Computing Platform
