Temperature Sensing and Control using Raspberry Pi
Guest blog by Charig Yang. I am a second-year engineering student at the University of Oxford and Microsoft Student Partner.
I am interested in electronic and information engineering, particularly in telecommunications and digital control systems. I also have enthusiasm in education and science communication. I teach part-time as a tutor during term time and organise educational camps during my holidays. Outside academics, I am into dogs and board games.
https://www.linkedin.com/in/charig-yang-509945128
Introduction
In this project, I built a model for a temperature regulation system that can be used for small-scale temperature control. Admittedly the motor output can be too weak to have a high influence in non-trivial scale systems, but the underlying principles are still the same. A simplified flowchart of how things work looks like this:
Simplified block diagram of the process
I intend to make this blog beginner-friendly, starting with what to do after getting the Pi, setting up, and the problems that might be encountered.
Part 1: Setting Up the Raspberry Pi
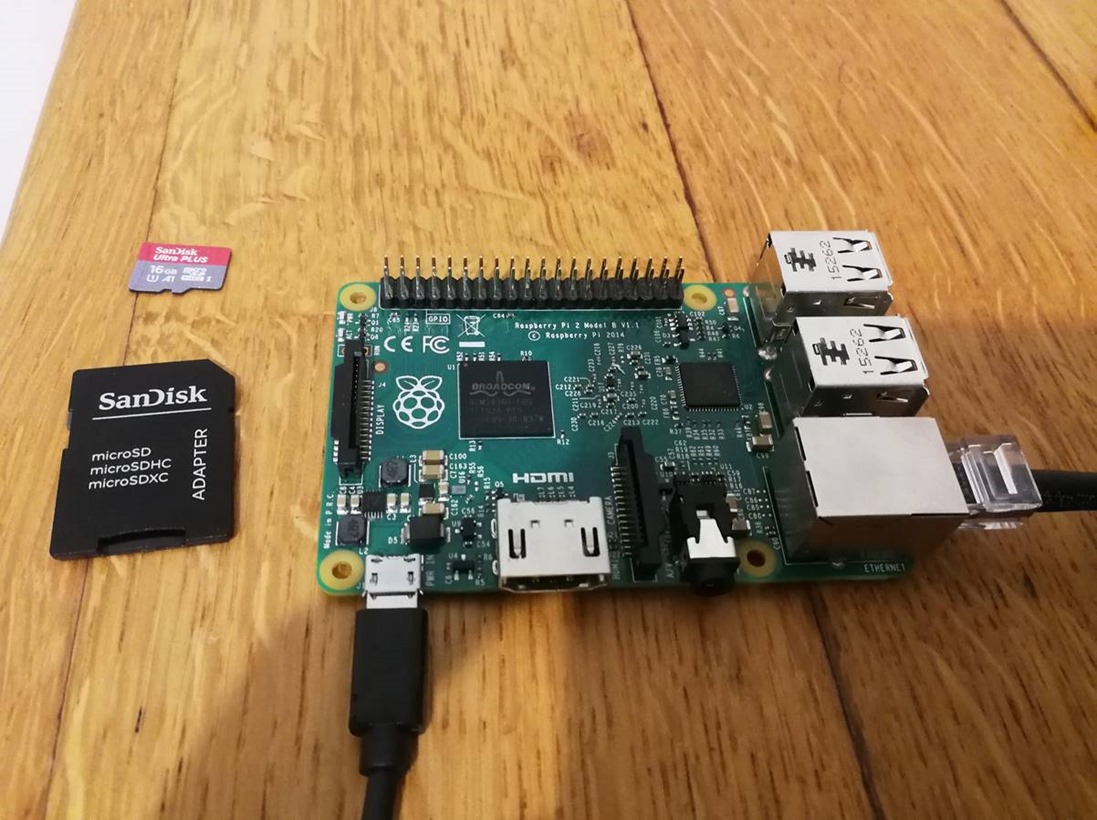
In this part I will cover how to setup the Raspberry Pi and start using it. To do this, you need a Raspberry Pi, an SD card (which should come with your Pi) with an adapter, a power supply connected through the micro-USB port (bottom left), an Ethernet cable
Do note that if you are using wifi for internet connection, you will need to check whether your version of Raspberry Pi has pre-installed wifi capability (Raspberry Pi 3), if not you will need a wifi dongle. Be careful here as not all wifi dongles are supported in the IoT Core. Check [/en-us/windows/iot-core/learn-about-hardware/hardwarecompatlist] before you buy one!
I got mine from [https://thepihut.com/products/official-raspberry-pi-wifi-adapter].
Instructions
- Download Windows 10 IoT Core Dashboard here: https://developer.microsoft.com/en-us/windows/iot/Downloads.htm
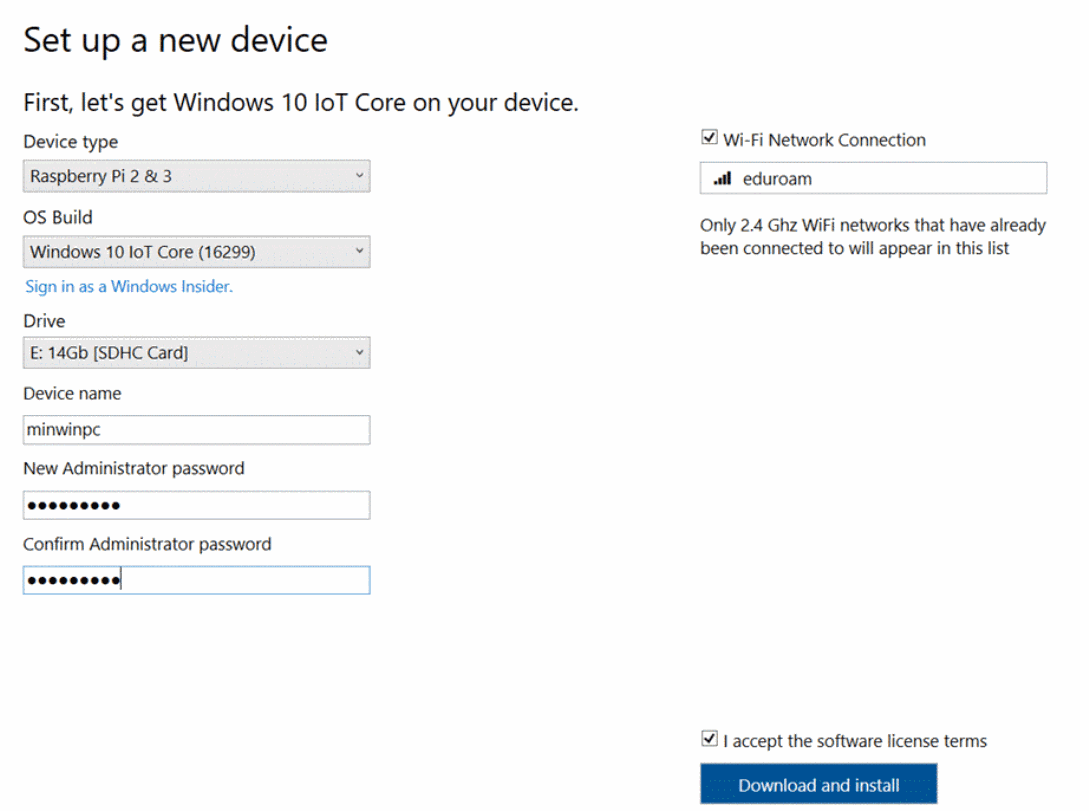
- You will see this page, click on Set up a new device
- Fill in your device name and password, make sure you get the Device type right, then click on Download and Install
- The installation should take a while, but will be ready in a bit. Once it is ready, plug in your SD card into the slot at the left side, from below the board.
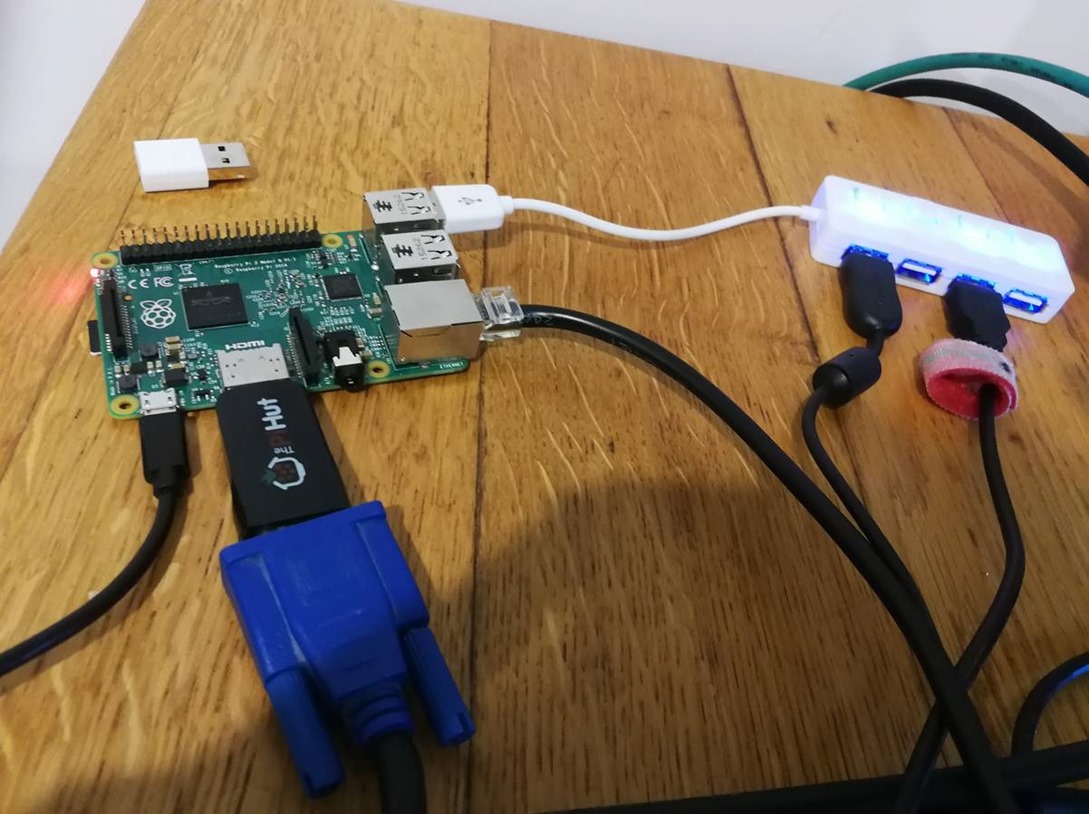
- Optionally, you may want to connect your Pi in a similar manner to a computer. (Without this you can still control your Pi through your PC, which will be illustrated in a while)
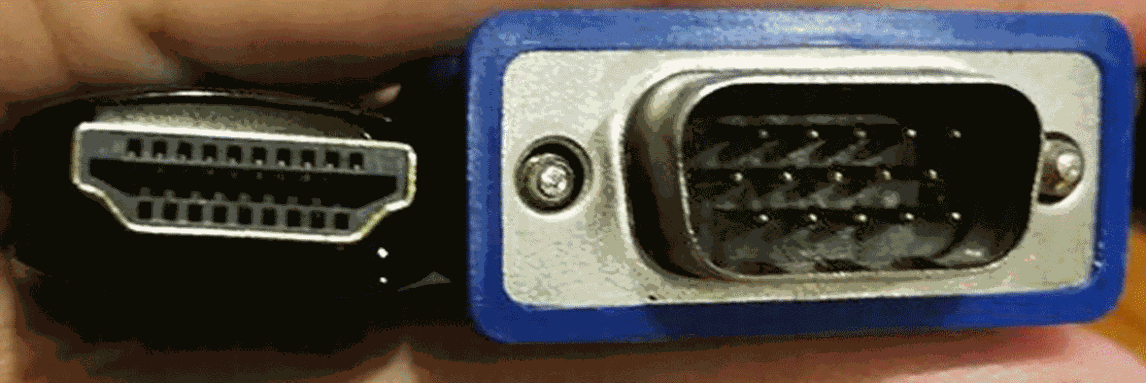
The extra connection to the right are the mouse and keyboard. The small thing lying on top is the Wifi dongle (but I am using Ethernet here, so that is not needed). Below is a connection to a monitor screen via a HDMI(digital, left)-to-VGA(analog, right) converter. The Pi only has a digital output (left), so you will need a converter if your screen is analog (right). I got mine from [https://thepihut.com/products/raspberry-pi-hdmi-to-vga-convertor]
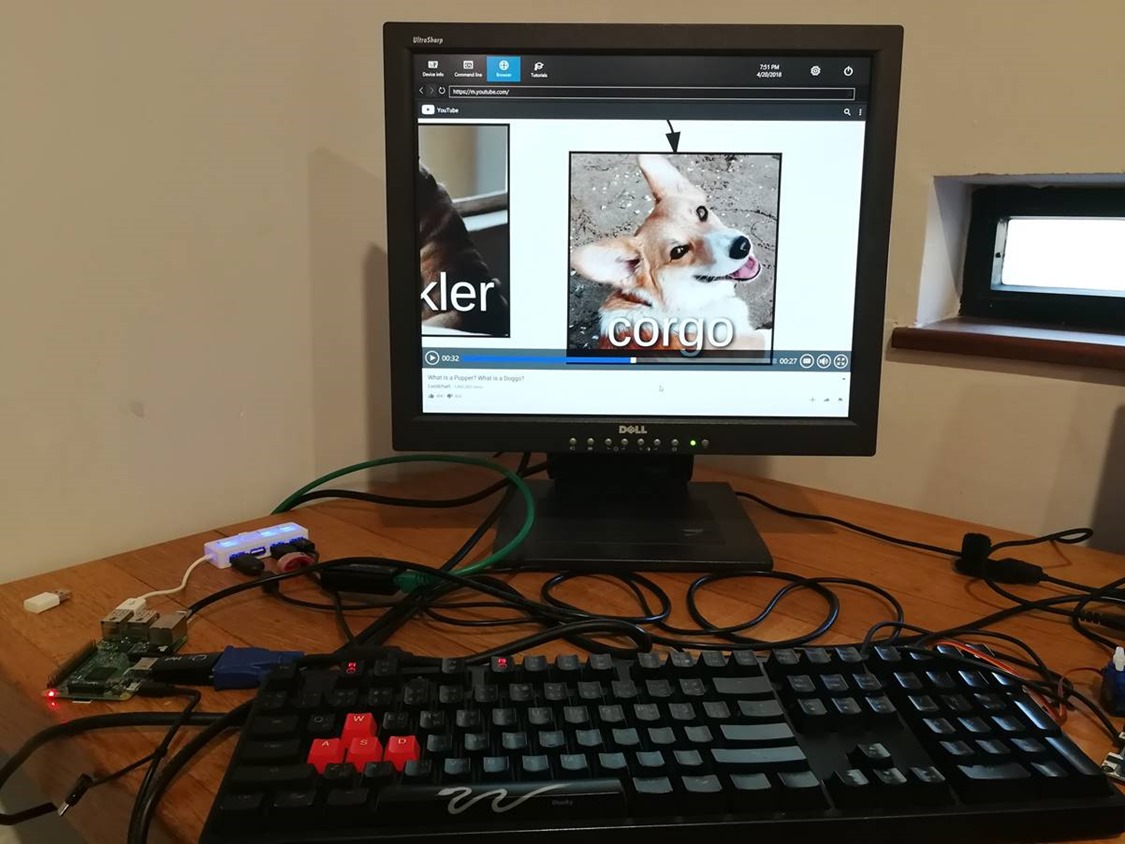
- Here’s a fully set-up Raspberry Pi using IoT Core - it functions just like a computer! The picture shows the Pi playing a Youtube video.
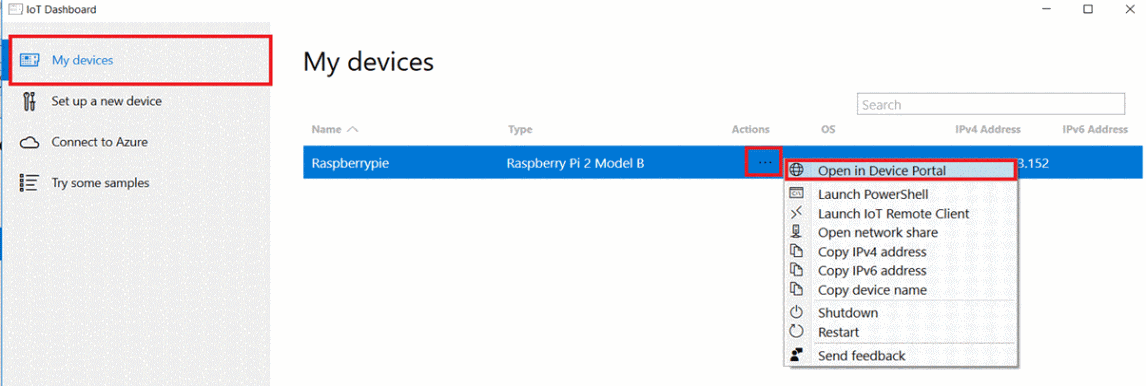
- You can also access the Pi from your computer by using the Windows Device Portal. Once connected, re-open the IoT Core Dashboard (the one that is used for IoT Core installation). Under My Devices tab (which was empty), you can now open the Windows Device Portal
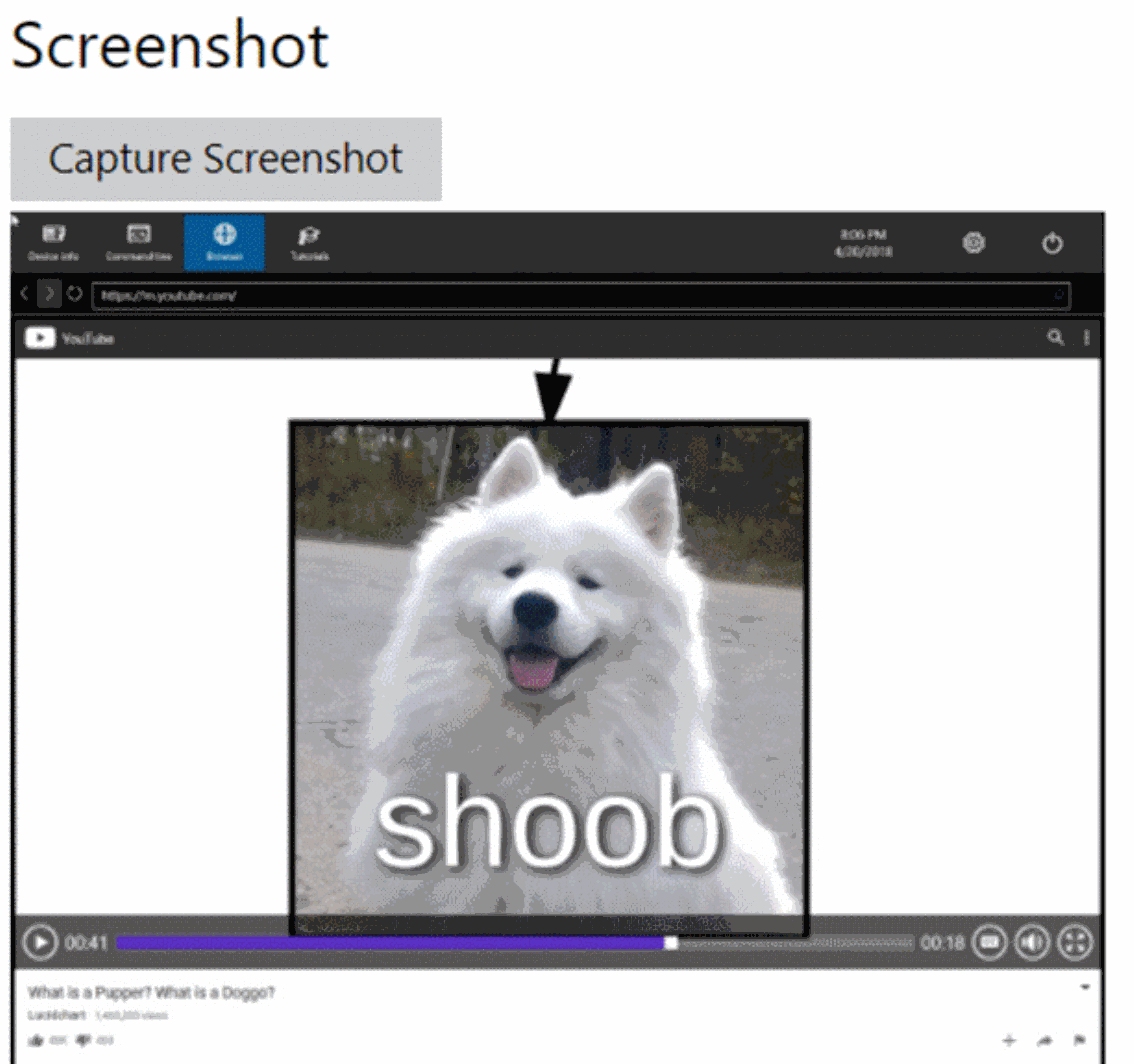
With the Device Portal, you can do several stuff from your PC such as Capture Screenshot (under Device Settings)
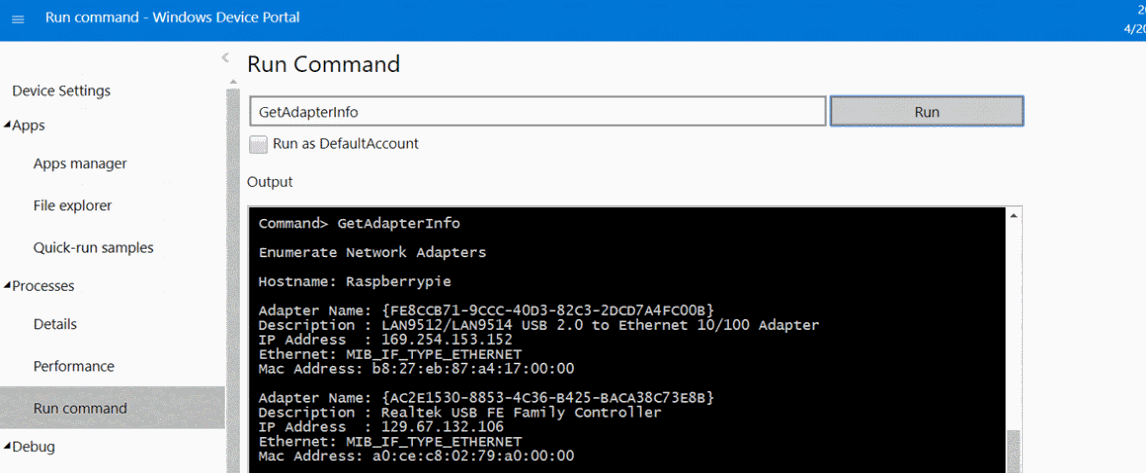
Run Command under the Processes tab (see the command list and what they do at [/en-us/windows/iot-core/manage-your-device/commandlineutils])
Or even run an app! This is done under the Apps Manager section
Part 2: FEZ Hat and Hardware Setup
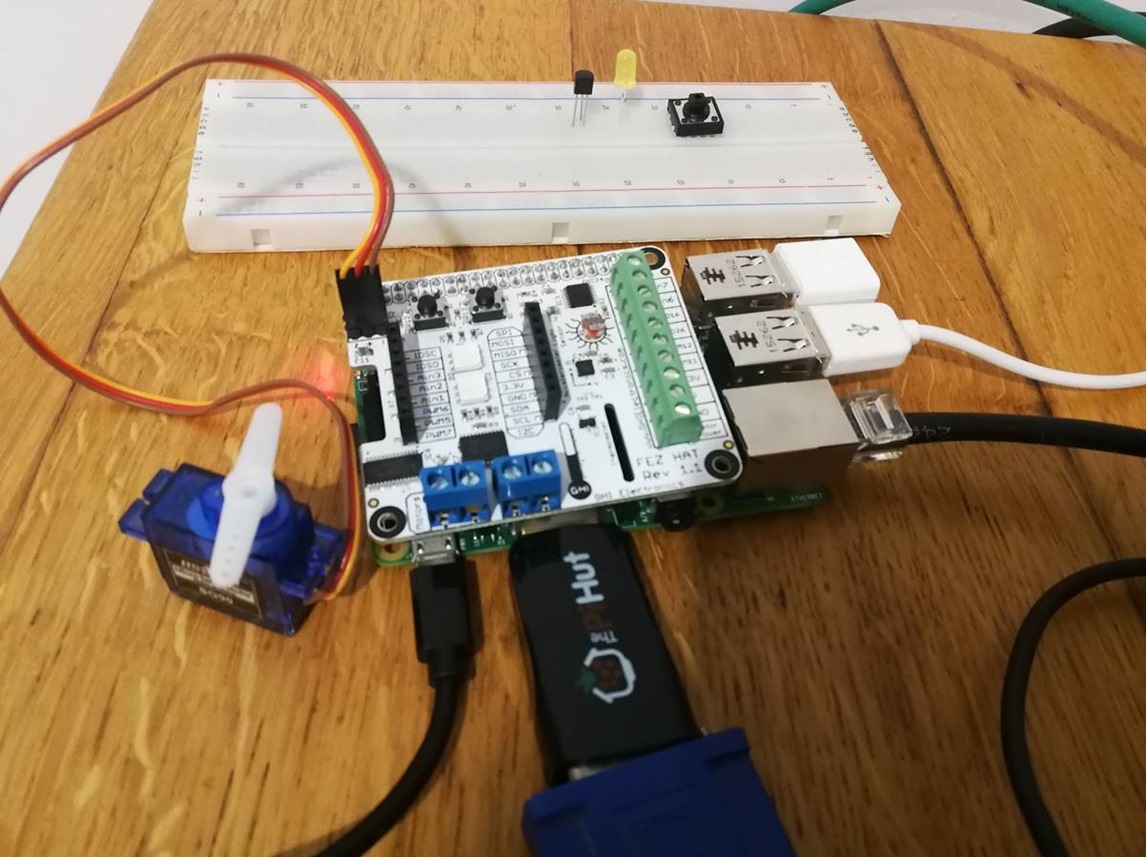
This time we will be using a FEZ Hat (stands for Fast and Easy) to do the project. It is pretty convenient as you can just put the Hat on top of the Pi. The setup looks like this:
Raspberry Pi Set-up
Note the breadboard behind is unrelated, but it shows how a temperature sensor, button, and LED separately, but they are all built-in within the FEZ Hat, so we will stick to that.
The connections to the Pi might look a lot, but they are things that are very close to us! Clockwise from the top are
- a Wifi Dongle (Raspberry Pi 2 does not come with wifi connection, so this allows the Pi to connect to the internet
- an extender that connects to a mouse and a keyboard
- an Ethernet cable that connects the Pi to the PC
- a connection to a monitor screen via a HDMI(digital)-to-VGA(analog) converter. Raspberry Pi only has a digital output, but my screen is analog, so that is needed
- a power supply
- a servo motor (which, in practice, can be replaced by a fan, heater, or something of similar nature)
Things to note:
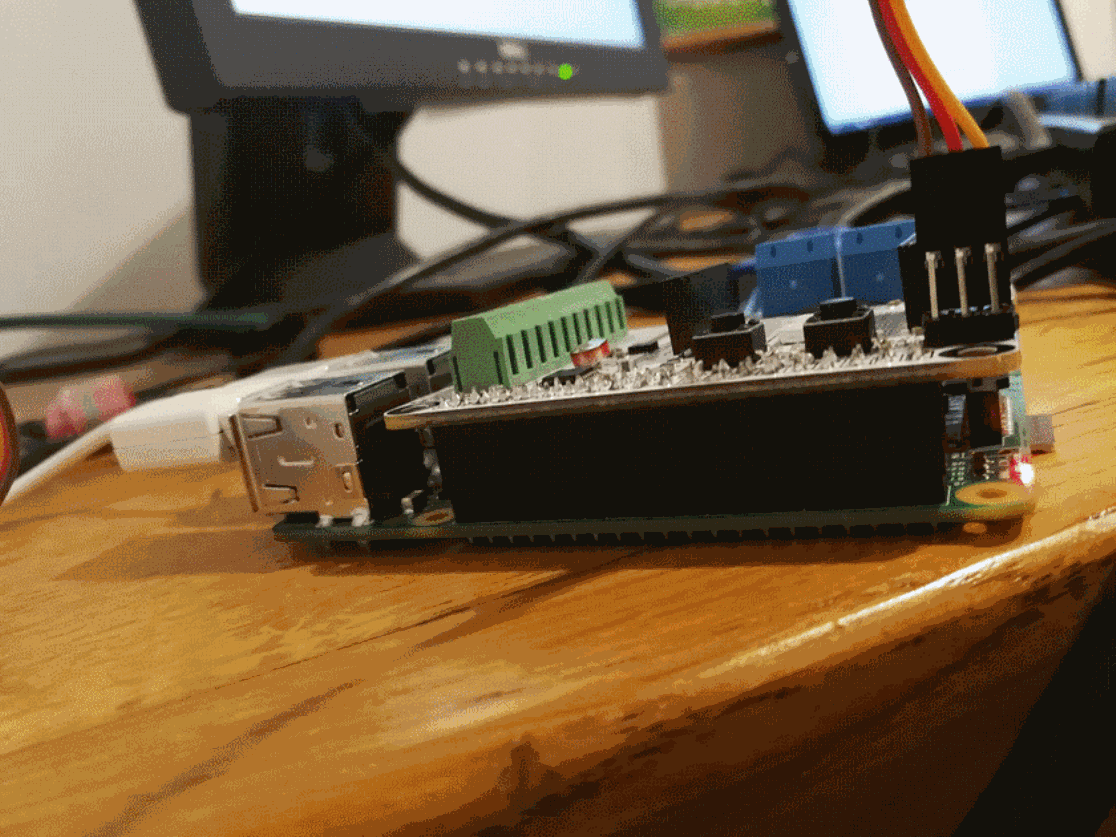
The FEZ Hat has to be plugged into the Pi, simply putting it on top of the Pi, while it actually looks secure, does not connect them. Also make sure you plug into the right socket, it is quite easy to miss it by one pin, and doing so will short the Pi.
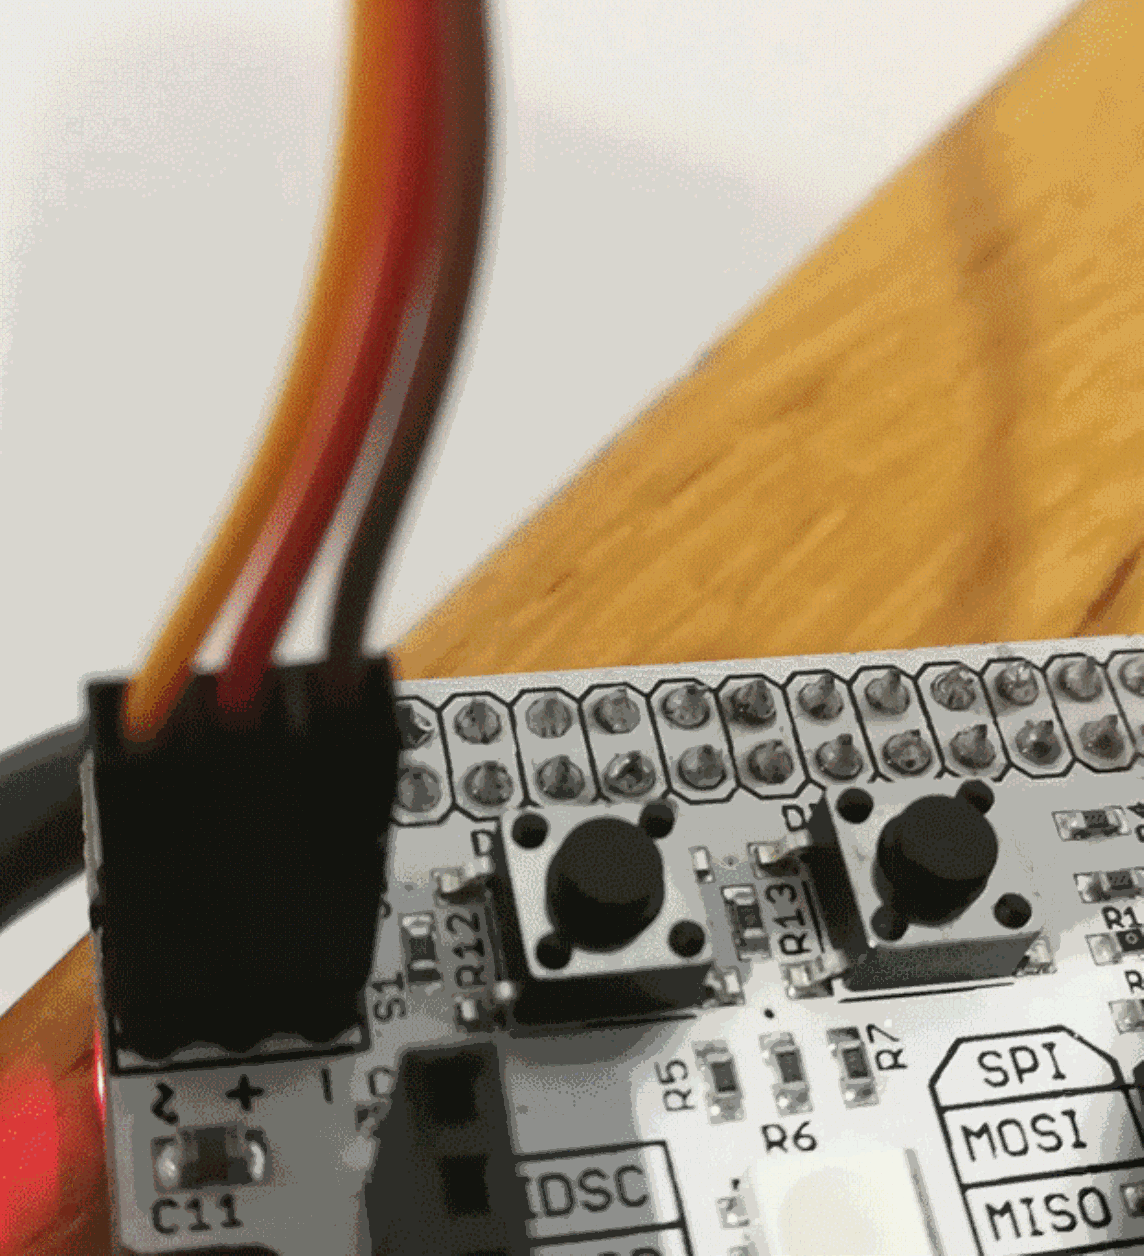
Also, the wires of the servo are connected this way, with positive at red, negative at black, and signal at orange/yellow. Some other servos may use other colours for signal but positive and negative should always be red and black.
Part 3: Using FEZ Hat’s Temperature Sensor
Before we begin, it is necessary to have Microsoft Visual Studio downloaded, it can be downloaded via this link [https://www.visualstudio.com/downloads]
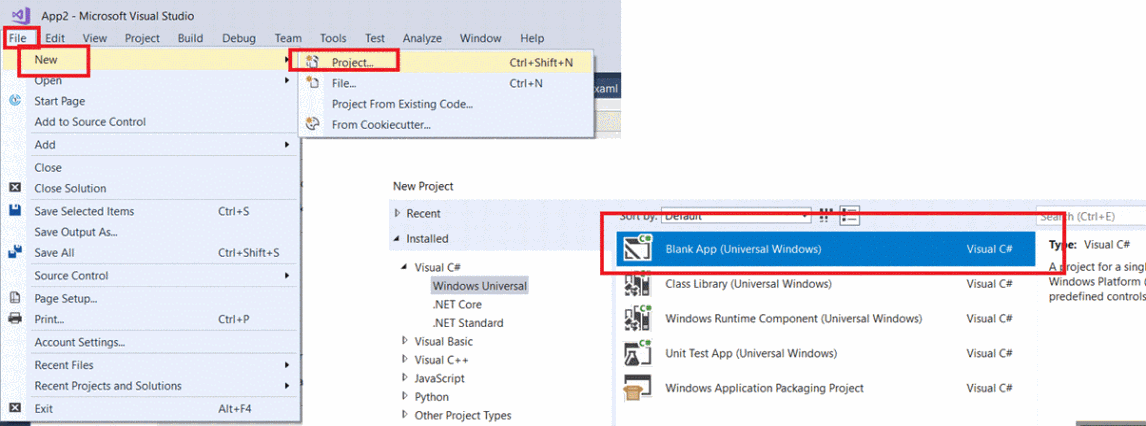
To create a new project, follow the instructions in the photo below, note that it would be convenient to set the name of the project as FEZHATDemo so that it matches the code, but the code can be edited if the name is different, not a big issue here.
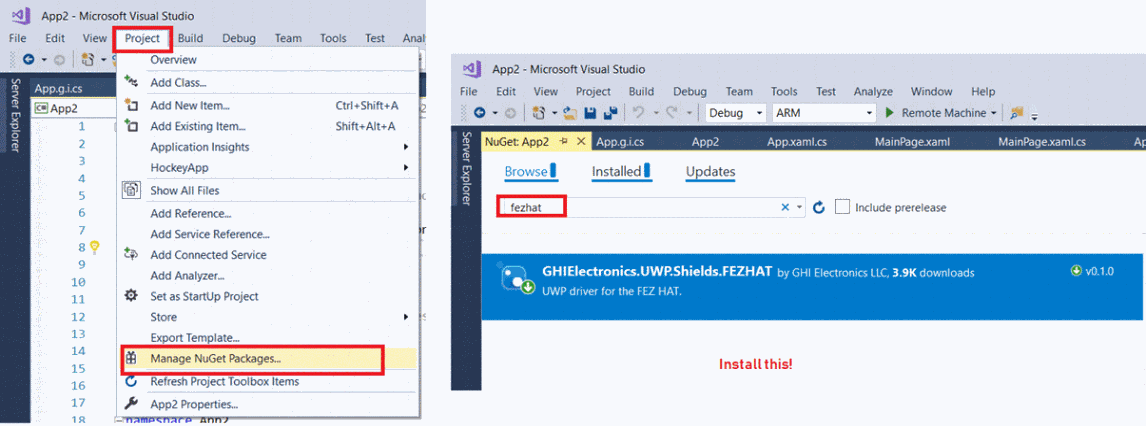
In Microsoft Visual Studio, there is a Package by the FEZ Hat provider called GHIElectronics.UWP.Shields.FEZHAT which commands the locations within the Hat (otherwise we won’t know where the temperature sensor is!).
This can be installed via Nuget, shown below
The code that reads the status of the FEZ Hat is pasted here, it can be downloaded from https://old.ghielectronics.com/docs/329/fez-hat-developers-guide
MainPage.xaml.cs (C#)
 using System;
 using Windows.UI.Xaml;
 using Windows.UI.Xaml.Controls;
 using GIS = GHIElectronics.UWP.Shields;

 namespace FEZHATDemo {
     public sealed partial class MainPage : Page {
         private GIS.FEZHAT hat;
         private DispatcherTimer timer;
         private bool next;
         private int i;

         public MainPage() {
             this.InitializeComponent();

             this.Setup();
         }

         private async void Setup() {
             this.hat = await GIS.FEZHAT.CreateAsync();

             this.hat.S1.SetLimits(500, 2400, 0, 180);
             this.hat.S2.SetLimits(500, 2400, 0, 180);

             this.timer = new DispatcherTimer();
             this.timer.Interval = TimeSpan.FromMilliseconds(100);
             this.timer.Tick += this.OnTick;
             this.timer.Start();
         }

         private void OnTick(object sender, object e) {
             double x, y, z;

             this.hat.GetAcceleration(out x, out y, out z);

             this.LightTextBox.Text = this.hat.GetLightLevel().ToString("P2");
             this.TempTextBox.Text = this.hat.GetTemperature().ToString("N2");
             this.AccelTextBox.Text = $"({x:N2}, {y:N2}, {z:N2})";
             this.Button18TextBox.Text = this.hat.IsDIO18Pressed().ToString();
             this.Button22TextBox.Text = this.hat.IsDIO22Pressed().ToString();
             this.AnalogTextBox.Text = this.hat.ReadAnalog(GIS.FEZHAT.AnalogPin.Ain1).ToString("N2");

             if ((this.i++ % 5) == 0) {
                 this.LedsTextBox.Text = this.next.ToString();

                 this.hat.DIO24On = this.next;
                 this.hat.D2.Color = this.next ? GIS.FEZHAT.Color.White : GIS.FEZHAT.Color.Black;
                 this.hat.D3.Color = this.next ? GIS.FEZHAT.Color.White : GIS.FEZHAT.Color.Black;

                 this.hat.WriteDigital(GIS.FEZHAT.DigitalPin.DIO16, this.next);
                 this.hat.WriteDigital(GIS.FEZHAT.DigitalPin.DIO26, this.next);

                 this.hat.SetPwmDutyCycle(GIS.FEZHAT.PwmPin.Pwm5, this.next ? 1.0 : 0.0);
                 this.hat.SetPwmDutyCycle(GIS.FEZHAT.PwmPin.Pwm6, this.next ? 1.0 : 0.0);
                 this.hat.SetPwmDutyCycle(GIS.FEZHAT.PwmPin.Pwm7, this.next ? 1.0 : 0.0);
                 this.hat.SetPwmDutyCycle(GIS.FEZHAT.PwmPin.Pwm11, this.next ? 1.0 : 0.0);
                 this.hat.SetPwmDutyCycle(GIS.FEZHAT.PwmPin.Pwm12, this.next ? 1.0 : 0.0);

                 this.next = !this.next;
             }

             if (this.hat.IsDIO18Pressed()) {
                 this.hat.S1.Position += 5.0;
                 this.hat.S2.Position += 5.0;

                 if (this.hat.S1.Position >;= 180.0) {
                     this.hat.S1.Position = 0.0;
                     this.hat.S2.Position = 0.0;
                 }
             }

             if (this.hat.IsDIO22Pressed()) {
                 if (this.hat.MotorA.Speed == 0.0) {
                     this.hat.MotorA.Speed = 0.5;
                     this.hat.MotorB.Speed = -0.7;
                 }
             }
             else {
                 if (this.hat.MotorA.Speed != 0.0) {
                     this.hat.MotorA.Speed = 0.0;
                     this.hat.MotorB.Speed = 0.0;
                 }
             }
         }
     }
 }
MainPage.xaml (Markup)
 <;Page x:Class="FEZHATDemo.MainPage" xmlns="https://schemas.microsoft.com/winfx/2006/xaml/presentation" xmlns:x="https://schemas.microsoft.com/winfx/2006/xaml" xmlns:local="using:App1" xmlns:d="https://schemas.microsoft.com/expression/blend/2008" xmlns:mc="https://schemas.openxmlformats.org/markup-compatibility/2006" mc:Ignorable="d">
     <;StackPanel Orientation="Horizontal" Background="{ThemeResource ApplicationPageBackgroundThemeBrush}">
         <;StackPanel Width="75">
             <;TextBlock Text="Light: " />
             <;TextBlock Text="Temp: " />
             <;TextBlock Text="Accel: " />
             <;TextBlock Text="Button 18: " />
             <;TextBlock Text="Button 22: " />
             <;TextBlock Text="Leds: " />
             <;TextBlock Text="Analog: " />
         <;/StackPanel>
         <;StackPanel>
             <;TextBlock Name="LightTextBox" />
             <;TextBlock Name="TempTextBox" />
             <;TextBlock Name="AccelTextBox" />
             <;TextBlock Name="Button18TextBox" />
             <;TextBlock Name="Button22TextBox" />
             <;TextBlock Name="LedsTextBox" />
             <;TextBlock Name="AnalogTextBox" />
         <;/StackPanel>
     <;/StackPanel>
 <;/Page>
Double click the names in bold in your file and paste the whole code into that. Edit all entries after the word namespace to make sure they match
Leave the rest of the code as it is. We also have to configure the remote debugging in the Raspberry Pi in order to send the code to the Pi and run it there, instructions below
We are finally ready to go!
If you connect your Pi to a screen you should see the program running on the screen after clicking the Remote Machine button. Otherwise you should be able to see it running in the Windows Device Portal, under the Apps Manager tab
It would be useful to gain some insight to what the code is doing, consider this:
 this.timer = new DispatcherTimer();
 this.timer.Interval = TimeSpan.FromMilliseconds(100);
 this.timer.Tick += this.OnTick;
 this.timer.Start();

 This means the timer ticks every 100 milliseconds (0.1 second)

 private void OnTick(object sender, object e)

     this.LightTextBox.Text = this.hat.GetLightLevel().ToString("P2", CultureInfo.InvariantCulture);
     this.TempTextBox.Text = this.hat.GetTemperature().ToString("N2", CultureInfo.InvariantCulture);
     this.Button18TextBox.Text = this.hat.IsDIO18Pressed().ToString();
     this.Button22TextBox.Text = this.hat.IsDIO22Pressed().ToString();
 This reads the value and shows it on every tick
Note that the code is not continuous! It is extracted for user-friendliness
Potential Errors and Fixes:
Make sure you
- Adjust the time [https://github.com/amykatenicho/IoTWorkshop under Setting Date_Time on IoTCore.docx]
- Label all the indexes correctly, especially the words after namespace in each code
- Make sure you connected the Pi to the PC (check through IoT Core Dashboard)
- Make sure you plugged in the Pi all the way in
Aside: Temperature Sensors and Signal Conditioning
This is not related to the main project, but just some insight to how a temperature sensor works. You might know that a thermistor is a resistor that changes its resistance when it is heated. The question remains: how then does it becomes a numerical reading of temperature? This is how it begins, the circuit measures Vin and Vout and hence can find the value of R and X
If we know R, Vout, Vin, we can find X. And if we compare it to reference value of X (e.g. X will be this at this temperature) then we know what temperature this is. This sounds straightforward in concept, but not mathematically. It is possible to build circuits that can be used configured to make sure that the temperature deviation is (largely) proportional to the change in the output voltage, and hence Vout can be used directly.
After we know the temperature we will have to send the (analog) signal to wherever we want. To do this, we need to amplify first (because Vout is normally in micro- to millivolts, if we just want to measure the level there is no need for a big voltage anyway) However do note that the output voltage cannot be too small as there might be random noises, and we have to make sure that the noise does not alter the reading. Then we pass it through a converter to make it a digital signal (zeros and ones). You can read on bridge circuits, instrumentation amplifiers and analog-to-digital converters if you are interested in this.
Part 4: The “I” in IoT - Connecting Data to Azure
This part concerns sending the data received from the sensors to Azure IoT Hub. The instructions are fully laid out in this link [https://blogs.msdn.microsoft.com/uk_faculty_connection/2016/01/27/windows-10-iot-core-beginners-walkthrough-using-raspberry-pi-2-and-the-fez-hat/] under the section Send telemetry data to the Azure IoT Hub. What we will focus in this section, however, is how to transfer data from the IoT Hub into a table format after we have connected the data.
First, we need to create a storage account. Do remember to use the existing resource group that is the same one used for IoT Core
Then we create Stream Analytics, this can be seen as a bridge linking the data between the IoT Hub and Storage Account
We select the input as the IoT Hub (named Raspberrypi here) and the output as Table. Each of them has to be configured individually.
The diagram shows that we are selecting data from [Raspberrypi] into [Table]
Do note that Stream Analytics is much more capable than this - it can take several inputs (say in an engine: pressure, temperature, velocity, etc) and present them in a single table. Not only this saves time, but it also makes sure that the data points are, to a large extent, synchronised.
As an example, let’s say if we want to control the temperature of a computer. We can activate the fan once the temperature is high enough, but that’s pretty much all we can do. If we have enough data, however, we can be a lot more predictive than that. We will know in average how long is required before the computer gets to a certain temperature, and protect it defensively rather than waiting for it to exceed. In a shorter term, we can also gain insight to the rate of increase of the temperature at the moment and guess when it will reach critical level.
As a side note, we could have used the Event Hub instead of IoT Hub up to this point, as the Event hub only allows Azure to receive data from the device, but not the other way round. Anything after this requires IoT Hub to send the data to the device.
Up to this point, we should have a table of the data recordings, and for the next section we will focus on how to use them.
Aside: The Servo Motor
Although knowing how to control the servo is useful, in actual temperature sensing systems we will instead connect to something like a fan or a heater, so going into detail about the servo might not be very useful.
The servo motor here is designed to resemble a fan or a heater in actual practice, but I replaced it with the motor for convenience. Note that in actual fact this motor would be a bad choice, as it can only turn 180 degrees (half a round) and maximally at 100 rotations per minute (which can hardly cool something down. That being said, the principles are similar. After we know what to do we then send the signal back to the FEZ Hat (using the same way, see above).
The pseudocode is simple (remember the motor doesn’t spin all the way, but half a round)
 Turn left all the way;
 Turn right all the way;
 repeat;
Do note that the actual principle behind controlling a servo motor is quite fascinating, it can be read here: https://makezine.com/projects/control-a-servo-motor-without-programming/, but since it is very likely to be replaced by something else in practice it is not of interest.
Part 5: The Controller
What is of our interest, however, is when do we have to switch on the control mechanism. This section will explore methods of doing that. Note that for this we will focus on #0 and #1 (because there isn’t a lot to do with the servo) but everything else is possible to implement.
#0 Manual
Let’s assume the situation to be a heater that switches the room off after it’s getting too hot
 Read temperature sensor
 If it is >;25 degrees,
 Switch LED on
This is more of a manual system where it just tells us that the temperature is high, and then does nothing to stop it. Not a bad choice to use in sensors where there is human supervision, such as fire alarms, but could have been more automatic. See the next section on Implementation of the Controller for how to do this.
#1 Automatic, One-way
 Read temperature sensor
 If it is >;25.5 degrees, and it was on
 Switch off
 Else, if it is <;24.5 degrees, and it was off
 Switch on
 Else, do nothing
This sounds like a good start! Note that we avoided the use of 25 degrees exactly as we didn’t want the the heater to fickle on and off repeatedly. This works in simple systems, but in actual engineering we might need more than that.
Other ways of controlling
#2 Two-way
Let’s assume now that we want to keep the temperature of a box that contains living cells constant at 5 degrees and we have both a heater and a cooler
 Read temperature sensor
 If it is >;5.1 degrees,
 Heater off cooler on
 Else, if it is <;4.9 degrees,
 Heater on cooler off
 Else, do nothing
This sounds okay, but what this lacks is the magnitude of how much we change things.
#3 Proportional
 Read temperature sensor, let it be x
 If x>;5, apply cooler level proportional to (x-5)
 If x<;5, apply heater level proportional to (5-x)
This sounds quite good, in a sense that if suddenly the cell is moved to a 20 degrees room, it gets more cooling than if it is just a slight disturbance. The constant of proportionality can be found experimentally by trying what is good. (Although in some sensitive systems doing random trials may not be a choice, in that case proper calculation will be required.
However, all three previous cases has an unaddressed problem, we switch off the heating system at a certain temperature, but the heat already released will still make an effect towards the temperature drop - so in a sense we are inefficient! (An analogy to this would be the car doesn’t stop after we release the pedal, but goes a long way). A bigger problem with this is that it will never reach equilibrium! Because if we heat up to the temperature we want we then have some heat left that will heat it further, same for cooling.
#4 Predictive
Let’s say we are doing a cooling system
 Read temperature sensor, let it be x
 Look at the temperature graph, draw a best fit line try to extrapolate where it will reach 5 degrees
 Gradually reduce the heat so that it reaches 5 degrees and stop there
*note that a more proper way of doing this is called integral control
This is the first use of our table we tabulated! We could not have done this if we only have the present values, but not any of the past. The math here seems a little more complicated.
A disadvantage of this is that it will obviously be slower to reach the desired temperature than the normal case. This could be made better by using something called a differential controller.
Implementation of the Controller
The instructions on how to control the LED and the servo is at [https://blogs.msdn.microsoft.com/uk_faculty_connection/2016/01/27/windows-10-iot-core-beginners-walkthrough-using-raspberry-pi-2-and-the-fez-hat] under Send commands to your device. The files associated with that blog can be downloaded from [https://github.com/amykatenicho/IoTWorkshop]
Aside: Discrete and Continuous Control
The schematic steps of what we are doing here looks like this
 Read temperature value (analog) every T milliseconds
 Convert it to digital, send to computer
 Let the computer decide what to do digitally
 Convert it to analog, send to device
 execute
Note that this is called the discrete way of doing it, because the data we have and the action we execute happen every T milliseconds. While this is close to real time, we have an alternative which is a continuous control system, which works like this
 Temperature value has an analog output Vout
 Pass through a circuit that has inputs of Vout and the reference voltage (what we want it to be), and an output of the voltage needed to make the change
 Send that output to the device
Doing it in analog makes it a little more difficult to control things, because we have to use circuits instead of coding, but allows us to really do it in real time.
The circuit is called the Proportional-Differential-Integral (PID) Controller and is very extensively used in the production industry to keep the level of heat, acidity, humidity and more. It basically calculates the Error (current value minus desired value) and tries to mitigate this error through three different ways - which the combined effect can mitigate the error quickly and reliably.
Aside: Connecting a Motor
After much theory, we can actually connect the motor to the circuit! Connect the ground to the negative terminal of the battery, and PWM12 to the motor.
Summary and Synthesis
I hope to show that the principle behind each step is actually quite simple, before they come into a program. To summarise, the program does
 Fetch temperature data;
 Send it to the cloud;
 Calculate what to do next; (or perhaps let the cloud do it!)
 Send the instructions back; (if any)
 Execute;
 Repeat;
Looking at it more generally, we can solve two problems with such a system, first is disturbance rejection, where we want to keep a value constant and mitigate any changes that are happening. Second is less straightforward, but we can do some tracking with it, which means that we have a graph of how fast a temperature should change, and we want the temperature to rise according to that graph, not too fast or too slow.
A possible extension to this project is to consider the fact that we have logged all the data and we can analyse that into some useful relationship about temperature, for example what is the relationship between increasing the speed of the fan to the rate of change of temperature afterwards, or more simply how long does it take for temperature to rise to a certain level, and whether or not that is consistent over a longer period of time.
We can also analyse the effectiveness of different fan speeds using the data we have. By comparing the temperature profile, we can estimate the effectiveness of using different types of controllers.
References and Useful Links
Transmitting Data from FEZ Hat to Azure: https://www.hackster.io/stepanb/fez-hat-windows-10-iot-core-and-azure-iot-hub-1172b5
FEZ Hat Schematic Diagram
https://old.ghielectronics.com/downloads/schematic/FEZ_HAT_SCH.pdf
Servo Motors
https://makezine.com/projects/control-a-servo-motor-without-programming/
Data Transfer from Pi to Azure
Necessary files


![clip_image002[4] clip_image002[4]](https://msdntnarchive.z22.web.core.windows.net/media/2018/04/clip_image0024_thumb.gif)

![clip_image002[6] clip_image002[6]](https://msdntnarchive.z22.web.core.windows.net/media/2018/04/clip_image0026_thumb.gif)
![clip_image004[4] clip_image004[4]](https://msdntnarchive.z22.web.core.windows.net/media/2018/04/clip_image0044_thumb.gif)

![clip_image002[8] clip_image002[8]](https://msdntnarchive.z22.web.core.windows.net/media/2018/04/clip_image0028_thumb.gif)
![clip_image004[6] clip_image004[6]](https://msdntnarchive.z22.web.core.windows.net/media/2018/04/clip_image0046_thumb.gif)
![clip_image006[4] clip_image006[4]](https://msdntnarchive.z22.web.core.windows.net/media/2018/04/clip_image0064_thumb.gif)
![clip_image008[4] clip_image008[4]](https://msdntnarchive.z22.web.core.windows.net/media/2018/04/clip_image0084_thumb.gif)
![clip_image010[4] clip_image010[4]](https://msdntnarchive.z22.web.core.windows.net/media/2018/04/clip_image0104_thumb1.jpg)
![clip_image002[10] clip_image002[10]](https://msdntnarchive.z22.web.core.windows.net/media/2018/04/clip_image00210_thumb.gif)