Understanding the TFS Cube
The initial learning curve for the TFS Cube is pretty steep. It is quite overwhelming to figure out the relationships between the large number of dimensions and measure groups in the TFS cube at first. In this blog entry I will explain some of the most commonly used perspectives and show how you can easily create Excel reports from them.
*Note* that this blog entry is still relevant to you even if you don't have perspectives on your cube. What I cover here will help you better understand the cube schema. In the demos below I connect Excel to cube perspectives. However you can create the exact same reports by connecting to the Team System Cube.
A perspective defines a viewable subset of a cube that provides focused, business-specific or application-specific viewpoints on the cube. It is a feature only available in the Enterprise Edition of SQL Server. Here are the out of box perspectives, we will explore the first 4 perspectives in this post:
-
- Current Work Item
- Work Item History
- Code Churn
- Test Result
- Build
- Code Coverage
- Load Test
The [Current Work Item] Perspective
Here are the cube dimensions related to the [Current Work Item] measure group:
Use the [Current Work Item] perspective if you would like to analyze the latest Work Item data. For example, you may answer questions such as these:
-
- What is the active bug count by Area?
- What is the remaining work by person?
- What is the list of active tasks, and how much work is left in each?
- Is there any active bugs assigned to my team that have not been modified in the past week?
In short, if you need to analyze the "as of now" work item data in the cube, [Current Work Item] perspective is the right perspective. Beware that the [Work Item History] perspective can answer many of the same questions, but it is much more expensive (slower).
Video: Demo 1 - Active Bug Count by Area
Also use the [Current Work Item] perspective if you would like to analyze Related Work Items. For example, You can answer questions such as these:
-
- List all Tasks with Active related bugs
- What tasks are blocked by active bugs assigned to my team?
There is a corresponding 'Related' dimension for every dimension that slices the [Current Work Item] measure group, e.g. [Area] and [Related Area], [Work Item] and [Related Work Item], etc. This allows you to filter and to show attributes for work items and their related work items. Note that the cube is designed for single hop relationships, i.e. work items and their related work items. For multi-hop relationships, e.g. work items and the related work items relating to their related work items, use SQL queries against the Relational Warehouse
Video: Demo 2- All Tasks with Active Related Bugs
The [Work Item History] Perspective
Here are the cube dimensions related to the [Work Item History] measure group:
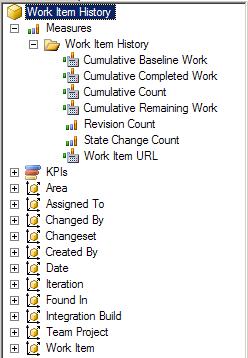
Use the [Work Item History] perspective to analyze historical work item data.
Use the [Cumulative…] measures and the [Date] dimension to analyze point in time status or to show historical trend. For example, you can answer questions such as these:
- Bug count as of a certain point in time
- Bug trend over a period of time
- Trend of Completed Work per person over a period of time
- The average time it takes to close an issue
Note that the [Cumulative…] measures are expensive during query time, shorten the date range if your report takes too long to render.
Although you can use the [Work Item History] perspectives to answer some of the questions concerning the latest work item data, use the [Current Work Item] perspective for greater performance.
Video: Demo 3 - Trend of Completed Work per Person over Time
Use the [State Change Count] measure for rate of change in work item state. For example, you can answer questions such as these:
- Incoming bug rate over a period of time
- Activation, Resolve and Close rate for over a period of time
Note that [State Change Count] returns the number of state transition events, but not the number of work items in state transition. For example, if we have a bug that was active yesterday, and it was resolved, reactivated and re-resolved today. [State Change Count] will return the resolved rate of 2, even though only 1 bug got resolved.
Video: Demo 4 - Incoming Bug Rate over Time
Video: Demo 5 - Activation, Resolve and Close Rate for Work Items over Time
The [Code Churn] Perspective
Here are the cube dimensions related to the [Code Churn] measure group:
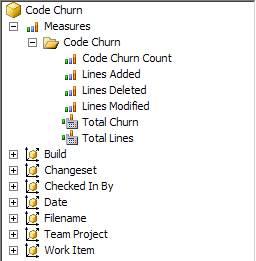
Use the [Code Churn] perspective to analyze historical code churn activities on Version Control. For example, you can answer questions such as these:
- How much code churn do we have over a period of time?
- How much code churn do we have over a series of build?
- How much code churn do we have over a series of changeset?
- Who introduced the most churn?
- What changesets go into each build?
- How much code churn was introduced as the result of resolving a certain work item?
The [Total Churn] measure is defined as [Lines Added] + [Lines Deleted] + [Lines Modified], and it is the measure you should use to answer questions concerning lines of code churned.
Note that the [Total Lines] measure is expensive during query time. Shorten the changeset, build or date range if your report takes too long to render.
Video: Demo 6 - Trend of Code Churn over Build per Person
Video: Demo 7 - Code Churn by Person per Changeset
The [Test Result] Perspective
Here are the cube dimensions related to the [Test Result] measure group:
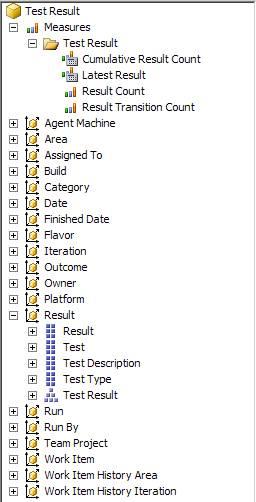
Use the [Test Result] perspective to analyze published test results.
In Team Test, each test can be run and published against a build multiple times. Each build can contain multiple published runs and each run contains at most 1 published result from each test. Let me illustrate the behavior of the different measures using a simple example:
Suppose there are 3 tests in the system and they were run and published to 2 builds in the following manner:
- Build 1
- Run 1-1
- Test 1 - Failed
- Run 1-2
- Test 1 - Passed
- Test 2 - Passed
- Run 1-1
- Build 2
- Run 2-1
- Test 2 - Passed
- Test 3 - Failed
- Run 2-2
- Test 3 - Passed
- Run 2-1
Here's how each measure would behave:
- [Result Count] – counts all published results individually
- Returns 1 for Run 1-1
- Returns 2 for Run 1-2
- Returns 3 for Build 1
- [Result Transition Count] – counts the number of times the outcome of tests change between runs within the same build
- Returns 1 for Run 1-1 because Test 1's changed no result to Failed
- Returns 2 for Run 1-2 because Test 1 changed from Failed to Passed and Test 2 changed from no result to Passed
- Returns 2 for Run 2-1 because both Test 2 and Test 3 changed from no result to having a result. Note that results are not carried forward from build to build
- [Cumulative Result Count] – counts the latest result of each test in a build
- Returns 2 for Build 1, the latest results come from Run 1-2
- Returns 2 for Build 2, Test 2's latest result comes from Run 2-1 and Test 3's comes from Run 2-2
- [Latest Result] – returns the string version of the latest result for a test
- Returns "Passed" for both Test 1 and Test 2 for Build 1
- Returns "Passed" for Test 2 and Test 3 for Build 2
Use the following measures to analyze results across Builds:
- [Cumulative Result Count] - Ex: How many tests have passed and failed against each build?
- [Latest Result] - Ex: What was the latest result for each test over a series of builds?
Video: Demo 8 - Number of Tests Passed and Failed over Build
Video: Demo 9 - Latest Test Result per Test per Build
Use the following measures to analyze results across Runs:
- [Result Count] - Ex: How many tests passed and failed against each run?
- [Result Transition Count] - Ex: Was there any improvement in pass rate over the previous run? i.e. how many failed tests from the previous run are now passing?
We will skip the details for the following perspectives. Here are their measure group and dimension relationships for your reference:
The [Build] Perspective
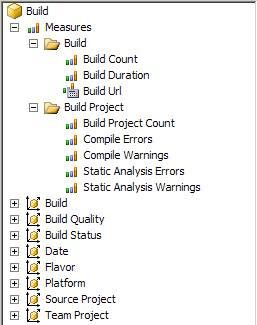
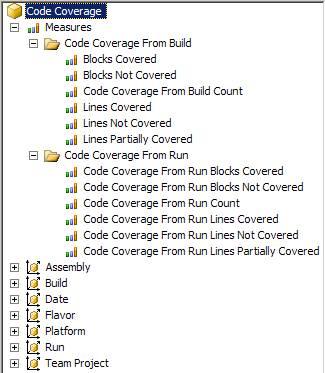
The [Code Coverage] Perspective
Comments
Anonymous
May 01, 2007
The comment has been removedAnonymous
May 01, 2007
One of the devs on the TFS data warehouse team has just started blogging. He plans to blog "how to" andAnonymous
May 01, 2007
En av utviklerne på teamet til TFS Data warehouse har begynt å blogge for å bedre forståelsen rundt detteAnonymous
May 02, 2007
The comment has been removedAnonymous
May 03, 2007
The Teams WIT Tools Blog on Understanding the TFS Cube. Buck Hodges on Update to "How to run tests in...Anonymous
May 04, 2007
Many of us lack the Enterprise version of SQL Server, and therefore don't have the perspectives.Anonymous
May 04, 2007
If you have STD version of SQL Server, you can create the same demo reports by connecting to the Team System Cube. I've updated my blog to clarify that. Thanks for the feedback.Anonymous
May 04, 2007
Один из разработчиков команды TFS data warehouse стартовал со своим блогом. Он планирует рассказыватьAnonymous
May 05, 2007
The comment has been removedAnonymous
May 05, 2007
The comment has been removedAnonymous
May 06, 2007
如果你已經採用了 TFS 專案一段時間了, 看到這些豐富的 動態報表之後, 你應該想要" 知道更多 "; 最近整理了一系列資料, 累積一段時間後. 在這裡重新整理了一次 所有 Wharehose 與 TFSAnonymous
May 06, 2007
Artigo simplesmente fantástico de como buscar as informações de seus projetos controlados no TFS. http://blogs.msdn.com/teams_wit_tools/archive/2007/04/30/understanding-the-tfs-cube.aspx...Anonymous
May 08, 2007
This is a great treatise on the TFS data warehouse and the TFS cube, giving some concrete informationAnonymous
May 08, 2007
Wish I could see these videos, but Soapbox doesn't support us poor folk in China!Anonymous
May 13, 2007
Unfortunately Soapbox isn't public access to folks in the Pacific Northwest either. Are there any other locations that the videos can be accessed from?Anonymous
May 25, 2007
Is it possible to get the cube project files so I can make add more perspectives? if so, from where? thanks!!Anonymous
July 16, 2007
Bonjour à tous et à toutes. J'ai découvert un article, de Jimmy Li, excellant sur Team Foundation ServerAnonymous
July 16, 2007
Wrapping up a few technical articles I hadn't had the time to look at in the past, I want to point youAnonymous
July 17, 2007
Wrapping up a few technical articles I hadn't had the time to look at in the past, I want to pointAnonymous
July 18, 2007
如果你已經採用了 TFS 專案一段時間了, 看到這些豐富的 動態報表之後, 你應該想要" 知道更多 "; 最近整理了一系列資料, 累積一段時間後. 在這裡重新整理了一次 所有 WharehoseAnonymous
July 19, 2007
如果你已經採用了 TFS 專案一段時間了, 看到這些豐富的 動態報表之後, 你應該想要" 知道更多 "; 最近整理了一系列資料, 累積一段時間後. 在這裡重新整理了一次 所有 WharehoseAnonymous
August 11, 2007
I don't often post about reporting. My last post was about sample reports for TFS from a year ago. IfAnonymous
August 11, 2007
I don't often post about reporting. My last post was about sample reports for TFS from a year agoAnonymous
August 11, 2007
The comment has been removedAnonymous
February 20, 2008
As the multitude of companies adopting TFS continues to grow, I'm getting more and more questions aroundAnonymous
April 21, 2008
Welcome! I thought that I would kick this blog off with a list of some good resources for learning aboutAnonymous
May 31, 2008
The initial learning curve for the TFS Cube is pretty steep. It is quite overwhelming to figure out the relationships between the large number of dimensions and measure groups in the TFS cube at first. In this blog entry I will explain some of the mosAnonymous
June 04, 2008
Here are some notes and a list of questions and answers regarding the TFS Reporting architecture. I gaveAnonymous
June 04, 2008
We just finished our first real sprint using TFS, Excel, and the Agile process. One of the things thatAnonymous
June 04, 2008
The initial learning curve for the TFS Cube is pretty steep. It is quite overwhelming to figure out the relationships between the large number of dimensions and measure groups in the TFS cube at first. In this blog entry I will explain some of the mosAnonymous
June 08, 2008
Järgnev on väärtuslik informatsioon, juhul kui kasutate Team Foundation Server 2008 -t ja olete mõelnudAnonymous
July 08, 2008
Хотя я уже довольно много времени занимаюсь TFS, его хранилище данных и создание собственных отчетовAnonymous
June 04, 2009
Occasionally I get asked how to create custom reports and modify the existing reports in TFS. First,Anonymous
July 21, 2009
Introducing such a topic you'd like to congratulate you've let us know. Have good workAnonymous
July 28, 2010
The comment has been removedAnonymous
June 19, 2013
Hi, i am not getting Current Work Item Work Item History cube can anyone tell me how to get these two cubeAnonymous
September 16, 2013
Any update for TFS 2012 using Scrum Template?Anonymous
April 23, 2015
Comment from year 2015: Please never delete this article :DAnonymous
January 13, 2016
Good document does anyone have any further links discussing some of the newer features in TFS 2015 ?