Everything you wanted to know about OpsMgr Data Warehouse Grooming but were afraid to ask
I know there are already quite some other blog posts about OpsMgr Data Warehouse Grooming. But I was helping a customer with grooming their OpsMgr Data Warehouse Database (OperationsManagerdw) and got some questions. And you may have the same questions but you are afraid to ask ;-)
How can I change the Grooming settings for the OpsMgr Data Warehouse?
This cannot be done from within the OpsMgr Console.
So what are the options then?DWdatarp tool
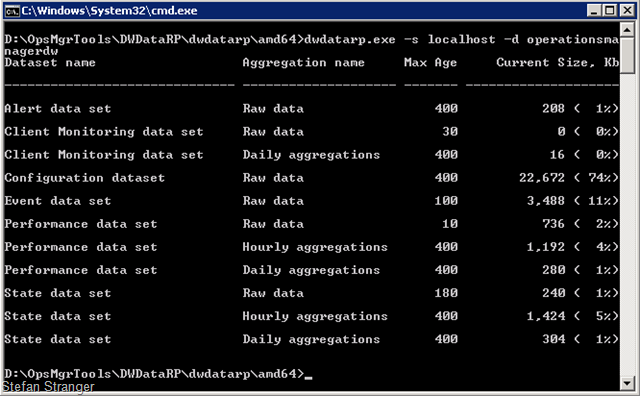
Use the Data Warehouse Data Retention Policy (dwdatarp.exe) tool from the MOM team weblog.
Tip: if after running the tool you don’t see any results, you may not be dbowner on the OperationsManagerDW database.
You can save the results to a csv, but you need to do some manual stuff in Excel to have a nice formatted overview.

Read the help (dwdatarp /?) for all the options. You can also change the Grooming settings for the OpsMgr Data Warehouse with this tool.
SQL queries
You have to use some SQL queries and run those on the operationsmanagerdw database in SQL Server Management Studio.
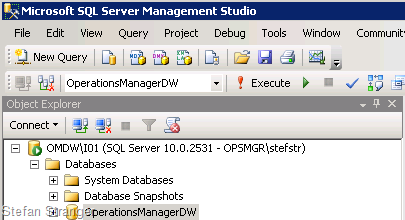
To view the Current OpsMgr Data Warehouse queries I use the next SQL queries from several sources.
--Current Grooming Settings USE OperationsManagerDW SELECT AggregationIntervalDurationMinutes, BuildAggregationStoredProcedureName, GroomStoredProcedureName, MaxDataAgeDays, GroomingIntervalMinutes, MaxRowsToGroom FROM StandardDatasetAggregation
--Last Grooming Time USE OperationsManagerDW select min(datetime) as MinDate, max(datetime) as MaxDate, datediff(d,min(datetime),max(datetime)) AS NoOfDaysInDataSet from Perf.vPerfHourly
--To view the number of days of total data of each type in the DW: USE OperationsManagerDW SELECT DATEDIFF(d, MIN(DWCreatedDateTime), GETDATE()) AS [Current Alert] FROM Alert.vAlert SELECT DATEDIFF(d, MIN(DateTime), GETDATE()) AS [Current Event] FROM Event.vEvent SELECT DATEDIFF(d, MIN(DateTime), GETDATE()) AS [Current Perf Raw] FROM Perf.vPerfRaw SELECT DATEDIFF(d, MIN(DateTime), GETDATE()) AS [Current Perf Hourly] FROM Perf.vPerfHourly SELECT DATEDIFF(d, MIN(DateTime), GETDATE()) AS [Current Perf Daily] FROM Perf.vPerfDaily SELECT DATEDIFF(d, MIN(DateTime), GETDATE()) AS [Current State Raw] FROM State.vStateRaw SELECT DATEDIFF(d, MIN(DateTime), GETDATE()) AS [Current State Hourly] FROM State.vStateHourly SELECT DATEDIFF(d, MIN(DateTime), GETDATE()) AS [Current State Daily] FROM State.vStateDaily
--To view the oldest and newest recorded timestamps of each data type in the DW: USE OperationsManagerDW select min(DateTime) AS [Oldest Event Date] from Event.vEvent select max(DateTime) AS [Newest Event Date] from Event.vEvent select min(DateTime) AS [Oldest Perf Date]from Perf.vPerfRaw select max(DateTime) AS [Newest Perf Date]from Perf.vPerfRaw select min(DWCreatedDateTime) AS [Oldest Alert Date] from Alert.vAlert select max(DWCreatedDateTime) AS [Newest Alert Date] from Alert.vAlert
--Which Tables used the most space USE OperationsManagerDW SELECT so.name, 8 * Sum(CASE WHEN si.indid IN (0, 1) THEN si.reserved END) AS data_kb, Coalesce(8 * Sum(CASE WHEN si.indid NOT IN (0, 1, 255) THEN si.reserved END), 0) AS index_kb, Coalesce(8 * Sum(CASE WHEN si.indid IN (255) THEN si.reserved END), 0) AS blob_kb FROM dbo.sysobjects AS so JOIN dbo.sysindexes AS si ON (si.id = so.id) WHERE 'U' = so.type GROUP BY so.name ORDER BY data_kb DESC
If you look at results of the first two queries (current grooming settings and last grooming time)
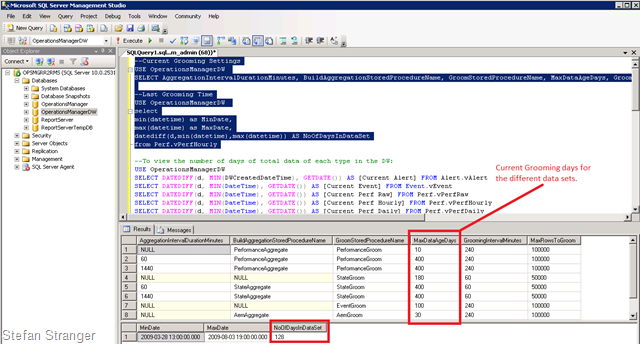
- Another interesting query is the “Which Tables used the most space” query. You can run this query before and after changing the grooming settings to see if the grooming had any effect.
If you want to change the Grooming settings you can use the next queries.
N.B. Change to the values you want to have your Grooming settings configured!!
-
-- From https://ops-mgr.spaces.live.com/blog/cns!3D3B8489FCAA9B51!176.entry -- Alert Data:
USE OperationsManagerDW UPDATE StandardDatasetAggregation SET MaxDataAgeDays = 100 WHERE GroomStoredProcedureName = 'AlertGroom'
--Event Data: USE OperationsManagerDW UPDATE StandardDatasetAggregation SET MaxDataAgeDays = 40 WHERE GroomStoredProcedureName = 'EventGroom'
--Performance Data: USE OperationsManagerDW UPDATE StandardDatasetAggregation SET MaxDataAgeDays = 100 WHERE GroomStoredProcedureName = 'PerformanceGroom' AND AggregationIntervalDurationMinutes = '60'
USE OperationsManagerDW UPDATE StandardDatasetAggregation SET MaxDataAgeDays = 200 WHERE GroomStoredProcedureName = 'PerformanceGroom' AND AggregationIntervalDurationMinutes = '1440'
--State Data: USE OperationsManagerDW UPDATE StandardDatasetAggregation SET MaxDataAgeDays = 40 WHERE GroomStoredProcedureName = 'StateGroom' AND MaxDataAgeDays = 180
USE OperationsManagerDW UPDATE StandardDatasetAggregation SET MaxDataAgeDays = 100 WHERE GroomStoredProcedureName = 'StateGroom' AND AggregationIntervalDurationMinutes = '60'
USE OperationsManagerDW UPDATE StandardDatasetAggregation SET MaxDataAgeDays = 200 WHERE GroomStoredProcedureName = 'StateGroom' AND AggregationIntervalDurationMinutes = '1440'
How can I see if Grooming has worked?
You can check if Grooming has worked after changing the Grooming settings by looking at the dwdatarp tool results or by running some SQL queries.Tip: save the results from the dwdatarp tool or SQL queries before and after changing the grooming settings to compare them.
If you have used the dwdatarp tool for saving the before and after grooming results you can have a look at the columns Current Size and Current Row Count if they changed after changing the grooming settings.
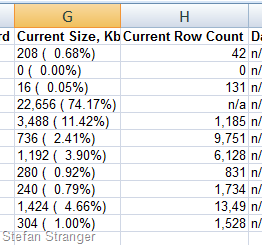
If you like to use SQL you can run the “Which Tables used the most space” sql query to look if those have changed after changing the grooming settings.
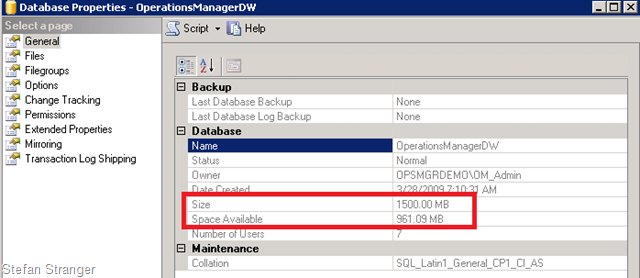
It’s also important to look at the current size and free space of the operationsmanagerdw before starting to groom.
Why don’t my database files shrink after grooming?
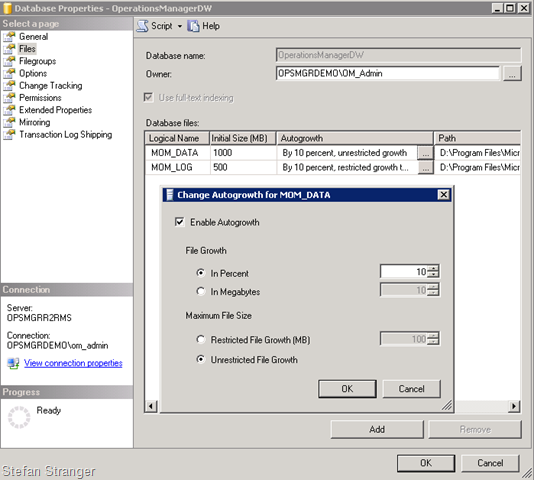
That’s another question people often ask, and that is because the SQL DB files are static – they are manually sized. You can check your autogrow settings for the OperationsManagerDW with the Microsoft SQL Server Management Studio. For the OperationsManager Database Autogrow is default disabled and for the OperationsManagerDW the default setting for Autogrow is enabled.
If you look at the Autoshrink setting for the OperationsManagerDW you can see it’s disabled.
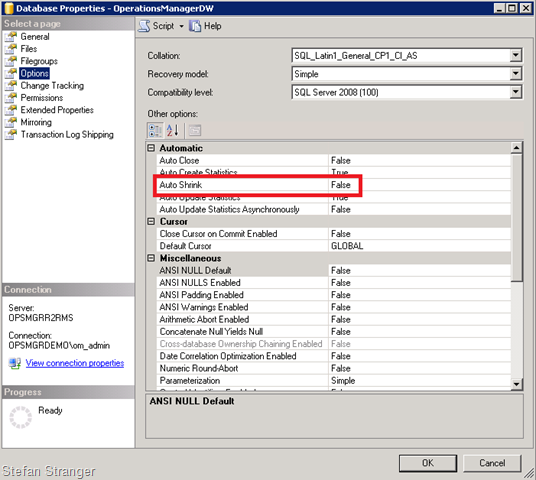
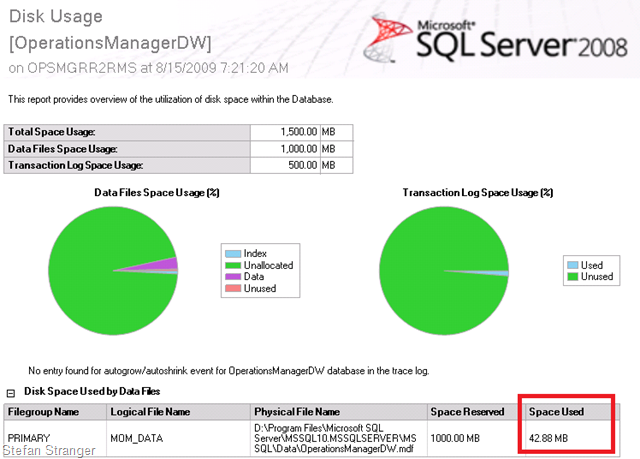
That’s why the database files won’t shrink after grooming has taken place. Please keep in mind that we don’t support/recommend EVER shrinking a DB file for OpsMgr. It causes fragmentation issues.The only thing that will change (shrink) after grooming is the used space in the database. You can check the used space for a database with the Disk Usage Report in Microsoft SQL Server Management Studio.
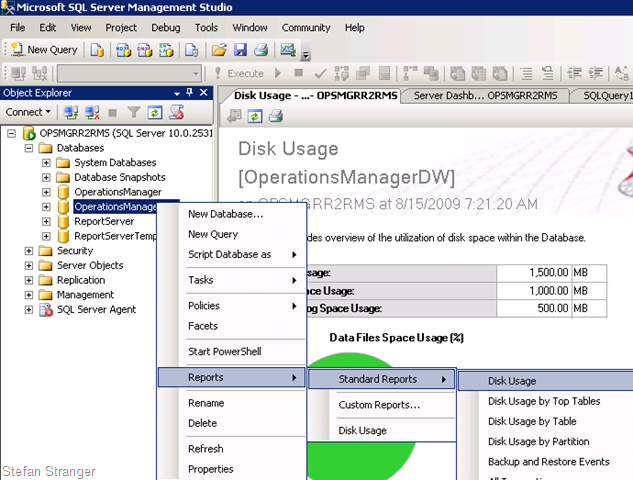
But, sometimes shrinking the database is the only option left if you don’t have any space left…
Disclaimer
Please be very careful when changing your grooming settings, you can loose data ;-) Posts in this blog are provided "AS IS" with no warranties, and confers no rights. Use of included script samples are subject to the terms specified in the Terms of Use
Links to other blog posts about Grooming:
- Modifying grooming settings for the OpsMgr databases
- Data Warehouse Data Retention Policy (dwdatarp.exe)
- Changing the data retention in the OpsMgr datawarehouse
Comments
Anonymous
January 01, 2003
Hi Jeff, Did you check the following blogposts? blogs.technet.com/.../grooming-process-in-the-operations-database.aspx blogs.msdn.com/.../scom-2007-operational-and-datawarehouse-grooming.aspx Hope that helps. /StefanAnonymous
July 02, 2013
The comment has been removedAnonymous
August 06, 2013
How do you manually start the grooming process?Anonymous
January 17, 2014
Here are some more links from my private collections. This links are very usefull to administrate, configure
