Perfect statistics histogram in just few steps
A similar question about statistics came to the team twice this week: why does updating with fullscan result in fewer histogram steps than when doing a sampled scan?
The answer is: the number of histogram steps can be fewer than the number of distinct values. For a histogram with perfect distribution (frequency* = 1), the consolidated histogram will have a minimum of three steps, because that’s how many steps are required to accurately portray the underlying data distribution.
* Frequency is calculated by multiplying the row count and density. Density is calculated as 1/distinct value count. For more information, refer to the documentation page on Statistics.
Let’s see a couple of examples where we can observe this: using IDENTITY (or any non-repeatable integer) and using GUIDs (specifically NEWID):
Create a new table with a UNIQUEIDENTIFIER column or IDENTITY as primary key. Both inherently unique by design.
 IF NOT EXISTS (SELECT [object_id] FROM sys.objects (NOLOCK) WHERE [object_id] = OBJECT_ID(N'[CustomersTableGuid]') AND [type] IN (N'U'))
CREATE TABLE CustomersTableGuid
(
    ID UNIQUEIDENTIFIER NOT NULL DEFAULT NEWID() PRIMARY KEY,
    FirstName VARCHAR(50),
    LastName VARCHAR(50)
)
GO

IF NOT EXISTS (SELECT [object_id] FROM sys.objects (NOLOCK) WHERE [object_id] = OBJECT_ID(N'[CustomersTableIdent]') AND [type] IN (N'U'))
CREATE TABLE CustomersTableIdent
(
    ID int IDENTITY(1,1) NOT NULL PRIMARY KEY,
    FirstName VARCHAR(50),
    LastName VARCHAR(50)
)
GO
Insert 1 million records.
 SET NOCOUNT ON;
DECLARE @i INT = 0
WHILE (@i <= 1000000)
BEGIN
    INSERT INTO CustomersTableGuid (FirstName, LastName)
    VALUES ('FirstName' + CAST(@i AS VARCHAR),'LastName' + CAST(@i AS VARCHAR))

    INSERT INTO CustomersTableIdent (FirstName, LastName)
    VALUES ('FirstName' + CAST(@i AS VARCHAR),'LastName' + CAST(@i AS VARCHAR))

    SET @i +=1
END
GO
And let's update the statistics with a FULLSCAN.
 UPDATE STATISTICS CustomersTableGuid WITH FULLSCAN
GO
UPDATE STATISTICS CustomersTableIdent WITH FULLSCAN
GO
Now, let’s find stats info:
Verifying sampled rows and steps, we have 3 steps for each statistic, with 100% row sampling (rows = rows_sampled).
 SELECT OBJECT_NAME(stat.[object_id]) AS [TableName], sp.stats_id, name,
    last_updated, rows, rows_sampled, steps, unfiltered_rows, modification_counter
FROM sys.stats AS stat
CROSS APPLY sys.dm_db_stats_properties(stat.[object_id], stat.stats_id) AS sp
WHERE stat.[object_id] = OBJECT_ID('CustomersTableGuid')
    OR stat.[object_id] = OBJECT_ID('CustomersTableIdent');
GO
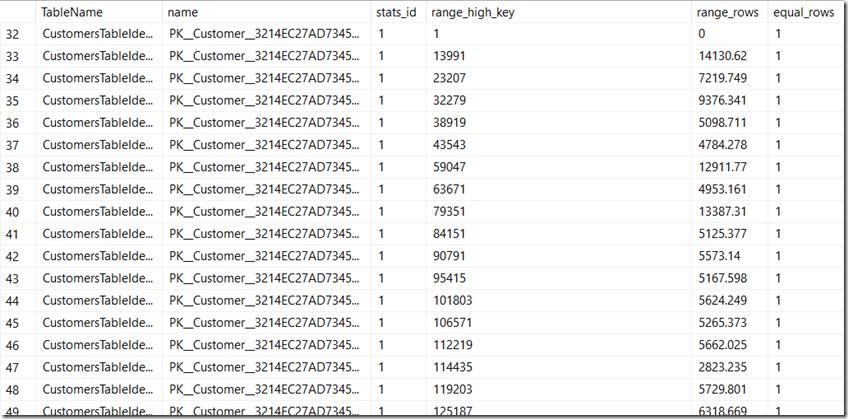
Looking at the histograms for ID column, we see the 3 steps for each statistic. SQL Server will compact multiple histogram steps into as few steps as possible, without losing histogram quality. As expected, the fullscan is a perfect distribution, and so it can be compacted into just 3 steps.
 SELECT OBJECT_NAME(stat.[object_id]) AS [TableName], stat.name, sh.stats_id,
    sh.range_high_key, sh.range_rows, sh.equal_rows
FROM sys.stats AS stat
INNER JOIN sys.stats_columns AS sc
    ON stat.stats_id = sc.stats_id AND stat.[object_id] = sc.[object_id]
INNER JOIN sys.all_columns AS ac
    ON ac.column_id = sc.column_id AND ac.[object_id] = sc.[object_id]
CROSS APPLY sys.dm_db_stats_histogram(stat.[object_id], stat.stats_id) AS sh
WHERE (stat.[object_id] = OBJECT_ID('CustomersTableGuid')
    OR stat.[object_id] = OBJECT_ID('CustomersTableIdent'))
    AND ac.name = 'ID';
GO
Let’s take the histogram steps on ID for the CustomersTableIdent table:
- 1st step with value 1;
- 2nd step with 999,998 rows with no repeats (the density is 1);
- 3rd step with the last row at 1,000,001.
Now let's update the statistics with a smaller sample (try whatever value you want), and look at the stats info.
SQL Server pulls pages worth of data, then extrapolates that to a full distribution. So, as expected, the sampled distribution is only approximate, and being an extrapolation, this is why we see frequencies that are close to 1, but not exactly 1.UPDATE STATISTICS CustomersTableGuid WITH SAMPLE 90 PERCENT GO UPDATE STATISTICS CustomersTableIdent WITH SAMPLE 90 PERCENT GO
In conclusion, what we have done here was to insert 1,000,001 unique keys into the tables. The fullscan histograms with 3 steps are reflecting this perfect distribution. With sampling on the other hand, SQL Server pulls random pages worth of data, then extrapolates distribution.
More importantly, having more steps in a statistic object is not always synonym of better key value coverage, and better estimations. Find more information in the documentation page on Statistics, namely how statistics are built.
One note on GUIDs: my advice is just don’t use them as predicates, or on anything that requires good estimates for range scans. If you really, really have to use them as PK on a table to maintain uniqueness and therefore leverage singleton lookups as possible, then GUID is ok enough. But use NEWSEQUENTIALID generation instead of NEWID, create the PK as non-clustered, and get a surrogate key that can fulfill the requirements of a good clustering key.
Pedro Lopes (@sqlpto) – Senior Program Manager


